LPSN - The 1-Minute Market Report August 12 2023
2023-08-14 13:30:00 ET
Summary
- After making a new 2023 high on July 31, the market is now in the process of consolidating its gains and expanding its participation.
- The Death Cross ended on February 2, 2023. We are now in a Golden Cross configuration, with the 50-day above the 200-day.
- The S&P 500 was down 0.3% last week. The mega-cap tech stocks led the way lower.
Originally posted on August 12, 2023
In this week's issue of the 1-Minute Market Report, I examine the asset classes, sectors, equity groups, ETFs, and stocks that led the market lower, and which market segments bucked the trend by moving up.
By keeping an eye on the leaders and laggards, we can get a sense of where the big money is going, and where it's coming from. Signs that market participation is broadening out are continuing to show up in the data. As this trend continues, it is improving the durability of the rally. Details to follow.
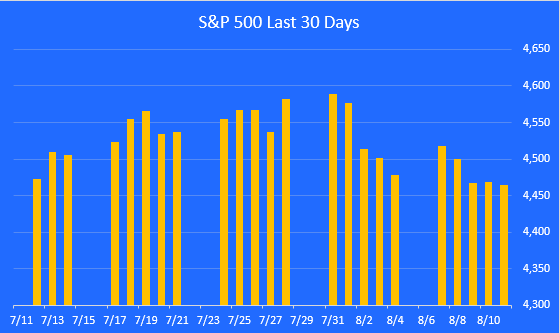
The S&P 500 rally takes a rest
After making a new 2023 high on July 31, the market is now in the process of consolidating its gains and expanding its participation. For the week, the S&P 500 was down 0.3%.
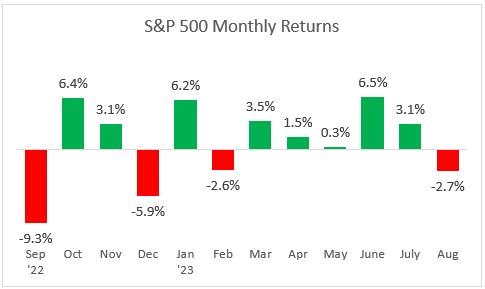
A look at monthly returns
This chart shows the monthly returns for the past year. After gaining 3.1% in July, August is starting out in negative territory. The Fitch downgrade of US Treasury bonds set a negative tone for the market. A small uptick in inflation didn't help.
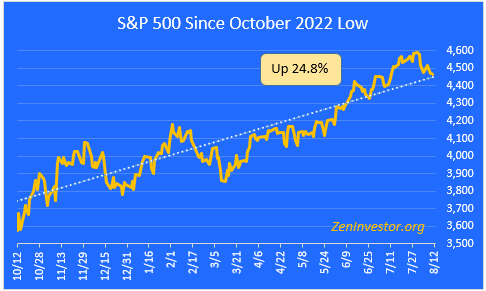
The bull market continues
This chart highlights the 24.8% gain in the S&P 500 from the October 2022 low through Friday's close. The index is now just 6.9% below its record-high close on January 3, 2022.
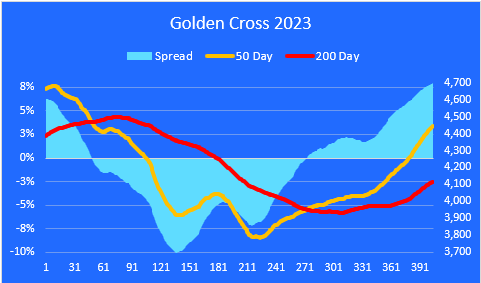
The Golden Cross
The market entered a Death Cross configuration (a Death Cross occurs when the 50-day moving average crosses below the 200-day) on March 14, 2022. The Death Cross ended on February 2, 2023. We are now in a Golden Cross configuration, with the 50-day above the 200-day.
The spread between these two moving averages is widening. Today, it stands at 7.9%, more than three times as wide as the long-term average of 2.3%. This widespread is one of the reasons I'm expecting a pullback of 5-7% for the S&P 500.
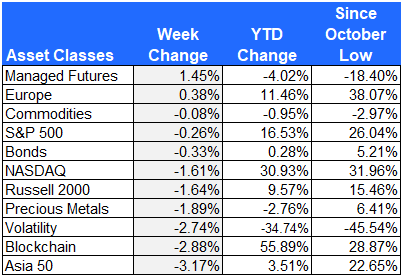
Major asset class performance
Here is a look at the performance of the major asset classes, sorted by last week's returns. I also included the year-to-date returns as well as the returns since the October 12, 2022 low for additional context.
The best performer last week was Managed Futures, as investors looked for ways to protect their gains from further downside in the market. Managed Futures can quickly shift from long to short exposure as conditions warrant.
The worst-performing asset class last week was Asia, which gave up 3.17%. This asset class is dominated by China equities, which have been struggling to keep up with the rest of the global markets.
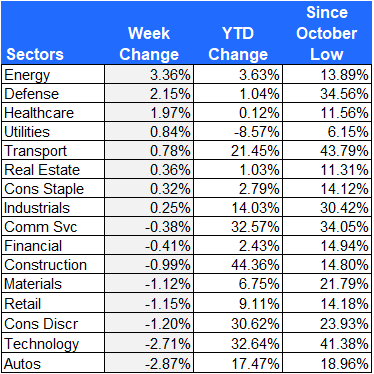
Equity sector performance
For this report, I use the expanded sectors as published by Zacks. They use 16 sectors rather than the standard 11. This gives us added granularity as we survey the winners and losers.
Energy stocks led the way higher last week thanks to a rebound in crude oil and natural gas prices. Defense contractors, Healthcare providers, and Utilities all bucked the trend by moving higher.
Autos and Technology were the hardest hit, losing almost 3% each for the week.
Equity group performance
For the groups, I separate the stocks in the S&P 1500 Composite Index by shared characteristics like growth, value, size, cyclical, defensive, and domestic vs. foreign.
Defensive stocks, which had been lagging behind, finally saw some buying interest as participation in the rally broadens out. Emerging Market stocks sold off, thanks in large part to the weakness in the China market.
The worst-performing group, for the second week in a row, was the mega-cap S&P Top 7. Three weeks ago, this group was up by an average of 100% on a YTD basis. Since then, they have given back 13%.
ZenInvestor.org
The S&P Top 7
Here is a look at the seven mega-cap stocks that have been leading the market all year. Nvidia ( NVDA ) gave back 8.6% as investors took profits and rotated into less expensive, more defensive names.
Google was the only winner among these 7 names. According to an article in Bloomberg, "San Francisco's Public Utilities Commission voted 3 to 1 to allow General Motors Co.'s ( GM ) Cruise LLC and Alphabet Inc.'s ( GOOG ) ( GOOGL ) Waymo to increase the areas of the city where they can operate a car without a safety driver, and charge riders a fare for it."
ZenInvestor.org
The 10 best-performing ETFs from last week
The ETF leaderboard was dominated by physical commodity producers last week. Uranium and Palladium both had a good week. Energy also did well.
ZenInvestor.org
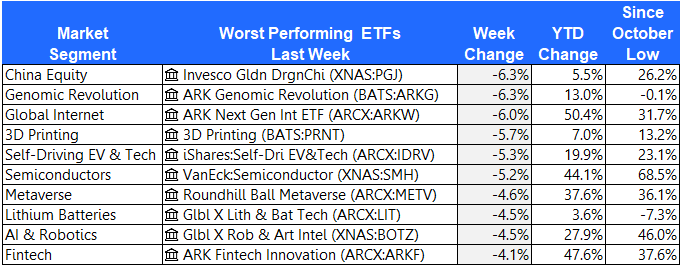
The 10 worst-performing ETFs from last week
Last week's losers were dominated by technology-based ETFs.
The 10 best-performing stocks from last week
Here are the 10 best-performing stocks in the S&P 1500 last week.
NKTR reported a narrower second quarter loss. CPRI beat their earnings number.
ZenInvestor.org
The 10 worst-performing stocks from last week
Here are the 10 worst-performing stocks in the S&P 1500 last week.
DBDQQ is now changing hands for 2 cents per share. Survival is far from assured.
EBIX plunged 40%. According to The Motley Fool, Ebix is "A provider of enterprise software solutions for the insurance and financial services industries. The pace of negative revenue growth has been accelerating. Ebix reported a 4% year-over-year decline in the fourth quarter of last year, expanding to a 15% decline in this year's first quarter."
ZenInvestor.org
Final thoughts
The S&P 500 was down 0.3% last week. The mega-cap tech stocks led the way lower. The good news is that market leadership and participation are continuing to broaden out. The fact that the market was only down by 0.3% while the mega-cap leaders were down 2.9% is very encouraging.
I have been expecting a pullback of 5-7%, which may have already begun. This would wring some of the froth out of the market and allow earnings to catch up with prices. As long as small caps, mid caps, and value stocks continue to outperform the S&P Top 7 mega-caps, I think a 5-7% pullback would improve the sustainability of this bull market.
Are you looking for more high quality ideas? Consider joining The ZenInvestor Top 7 , my Marketplace service. The Top 7 is a factor-based trading strategy. Its screening algorithm prioritizes reasonable price first, then the momentum, and finally projected earnings growth. The strategy produces 5-7 names, and rebalances every 4 weeks (13 times per year). The goal is to catch healthy companies that have gone through a rough period, and are now showing signs of making a strong comeback. Join now with a two-week free trial .
Editor's Note: The summary bullets for this article were chosen by Seeking Alpha editors.
For further details see:
The 1-Minute Market Report August 12, 2023