SQLV - The Bull Market No One Is Talking About...
2023-09-05 03:20:00 ET
Summary
- A burgeoning bull market in uranium (that no one is talking about).
- Bullish energy fundamentals point to higher prices.
- Manufacturing PMIs continue to support move higher in leading indicators of growth and inflation.
One
The best bull markets are those that move higher on very little fanfare. It seems uranium is now firmly in that camp.
On the back of ever-growing demand (the long-term bull case) and increasingly tight supply (the short-term bull case), the Sprott Physical Uranium Trust recently broke out of its 18-month resistance level and is now testing the highs that were set amidst the onset of the Russia-Ukraine conflict.
I am bullish uranium and continue to believe the market offers an excellent risk/reward setup over the medium term.
Two
The big elephant in the room for the sector is the ever closing discount to NAV of the Sprott physical fund ( SRUUF ). Remember, when this entity trades at a premium to NAV (which has historically occurred when speculation has run rampant), the fund can issue additional shares and use the proceeds to purchase physical uranium in the spot market, creating a convex bid to the upside.
Of course, the fund has been trading at a discount to NAV for most of the past 24 months and has not reported any physical purchases since April. But, should utilities begin to feel the pinch of dwindling supply and speculators return to the market, there remains the risk of much higher uranium prices on the horizon, of which a financial buyer such as Sprott would only exaccerbate.
Oh, and Cameco ( CCJ ) cutting its 2023 production estimates isn’t going to help this supply and demand imbalance one bit.
Source: Sprott
Three
The fact the uranium miners ETF ( URNM ) recently broke out of its two-year symmetrical wedge pattern and is testing 52-week highs only acts to reaffirm the outlook for uranium prices. Clearly, this is a sector to keep an eye on.
Four
Another sector where price action continues to unfold in a positive fashion is the oil market. I have been cautiously bullish oil and energy stocks for a few months now, and it seems the technical picture looks to be confirming the bullish fundamentals. If you look closely, oil looks to be breaking out to 2023 highs, suggesting the downtrend in oil prices is all but over.
Five
Speaking of oil market fundamentals, the term structure remains firmly in backwadation and thus continues to suggest the oil market is tight.
Six
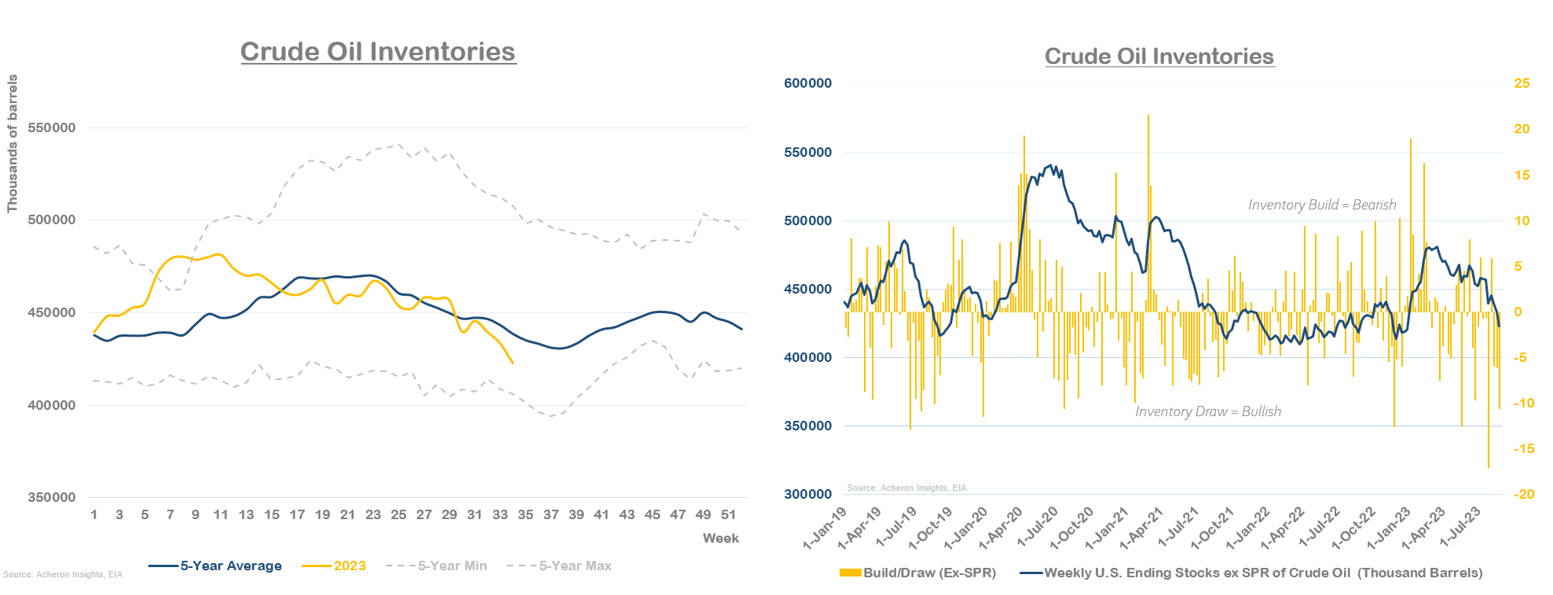
While the inventory picture seemingly confirms this point. Not only are inventory levels well below their seasonal averages, but we are seeing some of the largest inventory draws since 2021.
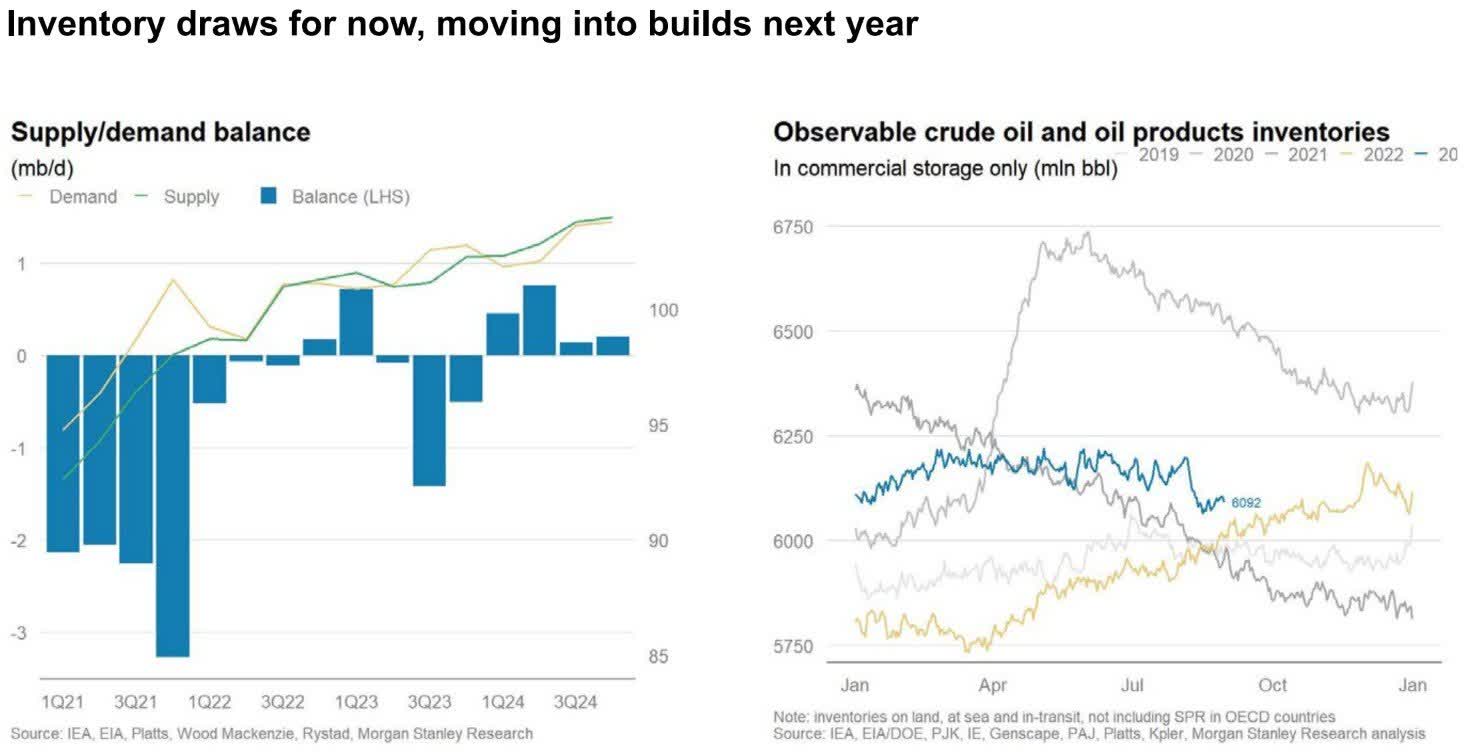
Seven
These inventory drawdowns and term structure backwardation continue to reaffirm the notion that supply is tight and the market is in a deficit. Whether this continues into next year remains to be seen (I must admit I am somewhat sceptical that we see $100+ oil just yet), but for now, things are looking good for oil bulls.
Eight
This near-term outlook is only further reinforced when we consider these dynamics in the context of what is historically a very favourable period for oil prices through September and October.
Nine
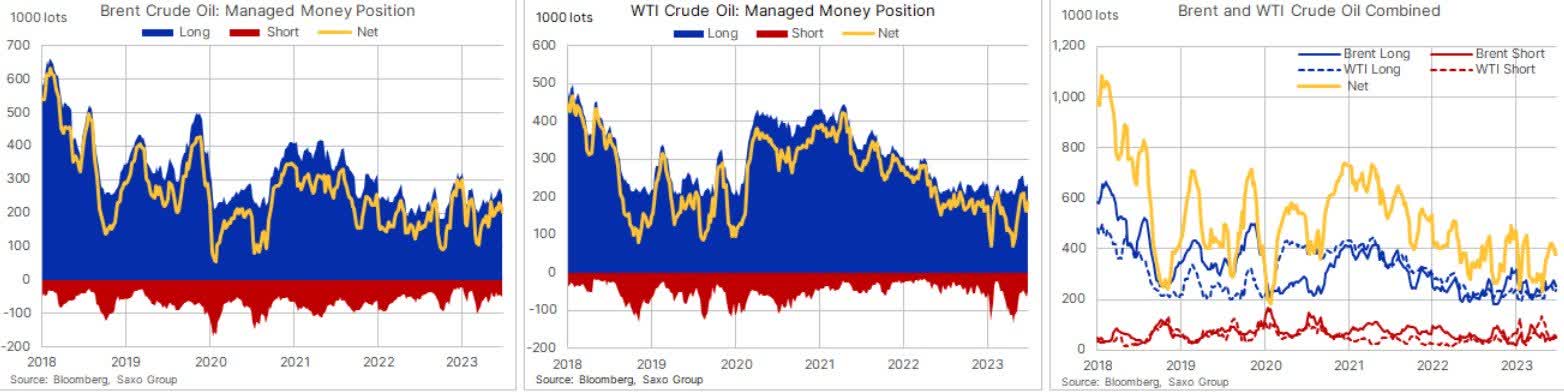
And although we have seen somewhat of an unwind of the recent multi-year low in speculative positioning, positioning and sentiment overall are far from any levels representative of irrational exuberance.
Until we see a change in the fundamentals, any pullback in oil and energy stocks should be viewed as a buying opportunity for the time being.
Ten
The ISM Manufacturing report for August was released this past week, with my overall takeaway being the overall PMI and its subcomponents continue to support the notion that many of the primary leading indicators of the business cycle have bottomed.
The ISM Manufacturing PMI - which I view as the most timely indicator of the business cycle, and tends to lead the primary hard economic data points such as industrial production, consumption and employment by around 3-6 months - increased by 1.2% from 46.4 to 47.6. Although it is still in contractionary territory (sub-50), it looks to be forming a bottom.
Eleven
In relation to the subcomponents of the ISM report, the New Orders index also ticked higher while Inventories ticked lower (with the spread between the two generally leading the composite PMI itself by around three months). We also saw the Prices Paid index tick higher, also confirming my thesis that goods disinflation may be over.
Although the Employment index ticked higher in August (+4.1%), the overall trend remains to the downside (albeit slightly). This was largely in-line with the BLS’s August payrolls report, which was stronger than expected (reinforcing the theme of a resilient economy and that we are likely not yet in recession), but the continued downward revisions confirms underlying weakness (as suggested by the ISM Manufacturing Employment) and that continued deterioration in the labour market lies ahead.
Twelve
Remember, when analysing economic data, it is important to remember the leads and the lags. Employment is lagging, which the ISM subcomponents are leading, and no single indicator can be relied upon in isolation to guide one's investment strategy.
For further details see:
The Bull Market No One Is Talking About...