JPST - The Confrontation Of Perfect Landing Narrative - Too Much Priced In
2024-01-03 01:47:54 ET
Summary
- Real yields have dropped, causing a rally in all assets, such as stocks, bonds, gold, and crypto. However, the tactical pair trade challenging the M7 concentration seems reasonable.
- The FOMC's decision and dovish press conference further increased the rate cuts bets. Two bond valuation models indicate the great risk-reward ratio is over.
- Inflation is showing improvement, but there are concerns about a bounce in the 3-month annualized rate and the trend in Core CPI.
- The main thesis is to challenge a current market easing narrative, which prices in -150 bps in rate cuts in 2024. I reveal some positioning and tactical pair ideas heading into 2024.
- Bonds are fairly valued based on market expectations and GDP and rich based on Core CPI. US10y declined in the last 6 cycles before and after rate cuts, my study reveals.
The most recent FOMC and Mr. Powell's press conference were surrounded by some dovish surprises, with some parts I agreed with and some outcomes I disagreed with. As you can see from my analysis on ( TLT ) and (AGG), I have been calling a massive bullish call on long end since September. I suggested that bonds were a lifetime opportunity because of real yields that have not been this high in a decade, combined with downward pressure from inflation and strong tightening. The real yield fell dramatically in the past month and even more so after the previous FOMC, which led to a rally in all risky assets. Though the Fed only disclosed -75 in the dot plot, the market is pricing in a sizable portion of rate cuts since year-end, close to -150 bps through December 2024. Because there is too much easing priced in, there are significant risks associated with the first inflation analysis that could lead to a resurgence of the inflation tiger. Furthermore, three-month annualized inflation shows no improvement in core levels, so I anticipated J. Powell to take a far more hawkish stance.
The rest of the inflation data, which calls for rate cuts, appears to be trending downward, though it may also be overstated. Although I still think there is a good opportunity in bonds, the risk-reward ratio has started to decline from one to three months ago. I think it would be better to invest in short-term bonds and make tactical positioning. I will show you two bond valuation models below, each using a different approach based on market expectations and core CPI. I think it can give us a clear understanding of where we are right now. In addition, I think bonds are still very appealing in the medium and long terms, but less so in the very short term. I think there is still a good time for ETFs in the money market, and given the risks associated with inflation and the potential for a pushback of market expectations, risk assets may see some pressure leading into Q1.
All risk assets, including safe assets like gold and bonds, rallied as a result of the real yields' decline from their peak. The US 10-year real rate dropped from 2.05% to 1,72% as a result of the FOMC's most recent decision and dovish press conference. This decline has persisted in recent weeks, impacting the designated assets such as stocks, bonds, gold, and crypto.
Starting with Inflation
The importance of 6m and 3m Core CPI rates
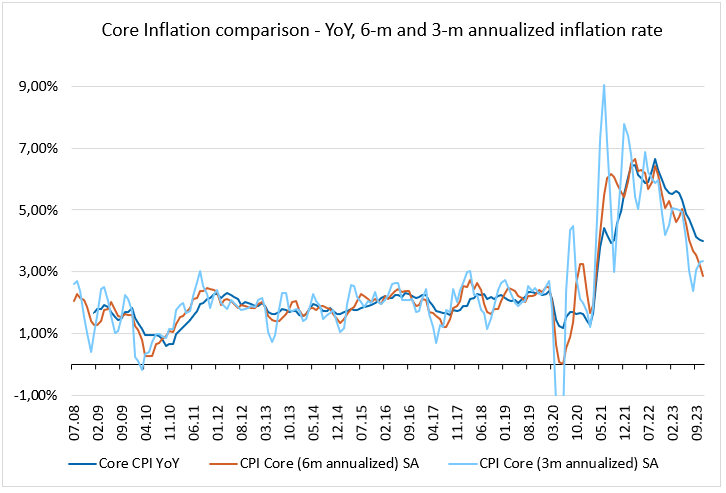
Even with the recent uptick in the headline MoM basic latest print, which "unexpectedly" rose by 0.1% vs. consensus 0.0%, we can still see a significant improvement in inflation. However, I don't think it's that of a big deal. First and foremost, as Powell has repeatedly stated, it is far more crucial to consider core inflation and core inflation ex. shelter , which is also closely monitored by the Fed. In order to track these changes, I have made two different charts. The YoY, 6-month, and 3-month annualized inflation rates—that is, the core inflation rate—are displayed below. As you can see, there has been a noticeable improvement, mostly on an annualized basis for 3m (3,4%) and 6m (2,9%). That being said, there is a boost, an increase from 2,4% to 3,4%, because of the shelter's development. But instead of focusing on YoY (4,0%), 3m scans the most recent inflation trend on an annualized basis, which is likely much better. YoY and 6m are approaching normal conditions, but 3m is exhibiting a bounce. Thus, that is the first warning indication, which could jeopardize the Fed's target of close to 2% if it continues to manifest in 6m and YoY later.
Core Inflation Comparison - YoY,6m and 3m inflation rate (Lucid Vision)
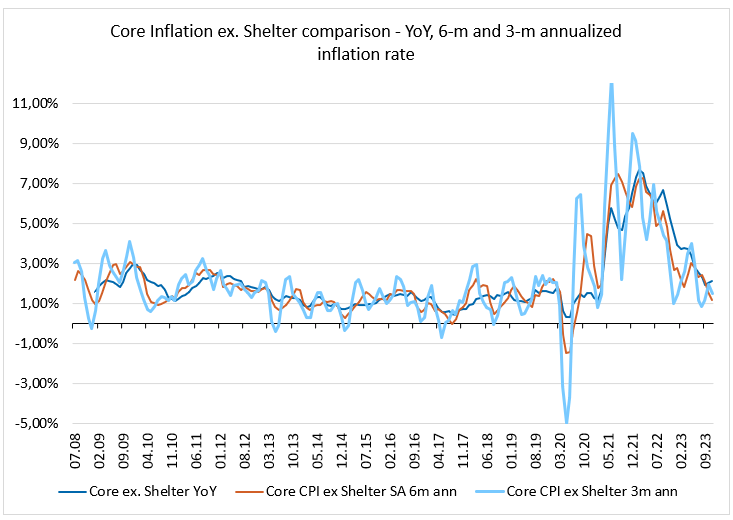
Now, let's take a closer look at Core CPI ex. Shelter using the same methodology as before. Now that YoY is at 2.1% and 6m and 3m annualized stand at 1.2% and 1.5%, respectively, it is evident that we are definitely approaching the goal. We are unmistakably moving toward our goal. So from this point, the job has been done.
Core Inflation ex. Shelter - YoY, 6m and 3m annualized inflation rate (Lucid Vision)
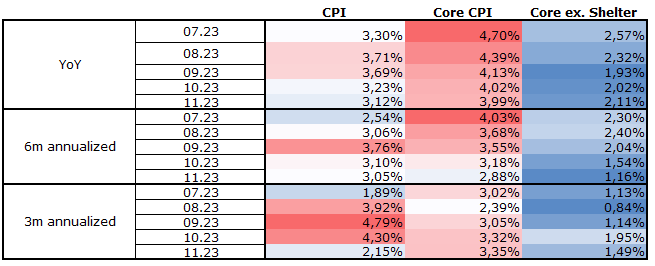
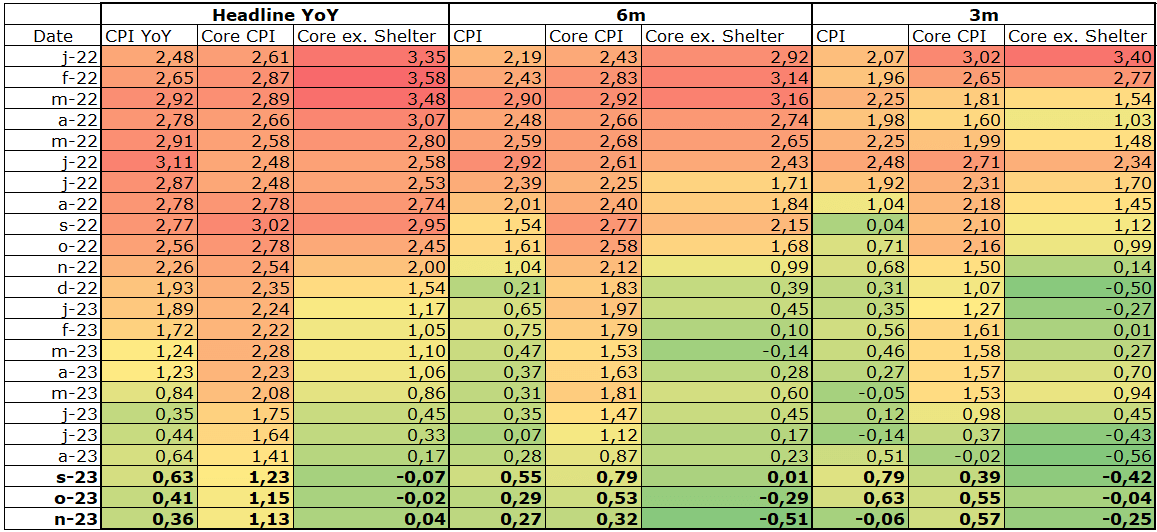
A more thorough trend analysis can be found here, based on the most recent 5-month trend releases. Although there is no longer a problem with core ex. shelter, you can see a positive trend here. Nevertheless, I find that the 6m and 3m annualized rates provide a clearer picture of the situation. Regarding the 6m trend, practically all metrics show a noticeable improvement in the most recent three-month prints. Although there is some cause for concern, the core CPI is on the rise but there is a medium-term declining trend. However, the sharp decline in the price of energy and oil is evident when examining the CPI, which indicates that 6 and 3 are plunging off a cliff. There is a slight variation when looking at the core. You can observe a significant improvement in Core ex. shelter, which made excellent progress on both a 6m and 3m basis.
Core CPI starts to be a problem thanks to the shelter
Core CPI prints, which are over 3.35%, are the main problem here, but what's more concerning is that this trend is very slightly rising and could be dangerous. It recovered from the 2,39% lows to print 3,35% at this time. On the other hand, it is evident that the shelter inflation is its main driving force when compared to the core ex-shelter. To put it another way, the shelter portion stays sticky.
Inflation trend (Lucid Vision)
To gain even more insight into the deviation from the long-term normal, we can also examine the Z-score (as of 2008). In the range of -1 to +1 STD, all annualized metrics at 6 or 3 months are displaying values close to the long-term average. The only real problem is the Core CPI YoY, which is 1 standard deviation above normal. However, the annualized 6-month data indicates a strong trend of decline, and the raw data shows a slight increase in deviation from normal over the previous 3 months.
Inflation - Z Score (Lucid Vision)
We can assume that differences between Core CPI and Core CPI ex. Shelter is sticky, as the "shelter part" remains sticky. It's due to some reasons. When you are checking what drives the shelter costs in CPI, it is:
- Owner´s equivalent rent (OER) is the largest sub-component and represents the implicit rent an owner could pay to live in their own home (assuming it was leased and not owned). It's based on a survey of homeowners, which accounts for approximately 25% of CPI).
- The second important part is the rent of the primary residence, which accounts for approximately 7% of CPI.
Both are impacted by the current and expected development of house and rent prices. While looking at the Core CPI and House Price Index, it's pretty clear that we can see a bounce from house prices upwards during the decreasing trend in the Core CPI. In my view, this can imply that the core CPI remains sticky and will not fall back too fast, as many analysts on the street suggest.
Wage growth, which is currently declining very smoothly as people demand and attempt to make up for the wage increases brought on by the previous inflation cycle in 2022 and 2023, is another factor that could counteract the cooling of inflation. And since the new year is quickly approaching, there will likely be more negotiations, albeit with less favorable results. The difference between the Wage tracker and Core CPI is widening and is likely to do so for some time to come.
Market expectations
In addition, there has been a rise in the price of commodities like oil in previous days, which will affect the CPI but could also have a secondary effect on core. Most likely, the mid-cycle low in oil prices has been reached, but a lot will depend on the market's price easing and other factors. But as I mentioned in the first chart, almost all assets saw an increase in value as a result of the real yields falling, and as a result, the market priced in faster easing, which may pose a risk to the cooling of inflation. However, data indicates that we are making excellent progress in Core ex Shelter and CPI; overall, I believe that Core will remain sticky. But because of the early market easing, it may also rise, and the market may experience another unpleasant surprise or a "push-back" from the Fed to lower market expectations.
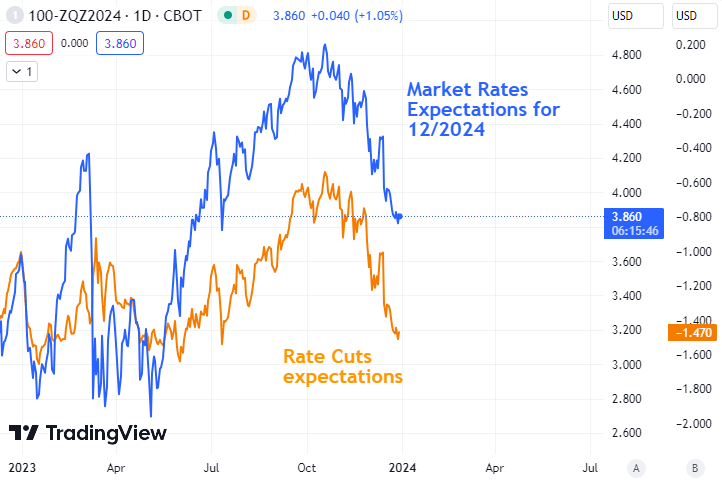
The evolution of Fed Funds Futures expectations throughout 2023 is depicted below. Market expectations place rates at 3,86% at the December 2024 meeting, which would be a nearly -150 basis point drop from the current Fed Funds rate (December 2023). So that is a current market pricing.
Market Expectations - Fed Funds Rate ( Lucid Vision via TradingView )
The Fed announced in the latest dot-plot projection that they will be ready to cut 75 bps in 2024. I believe it will be more but less than current market pricing, somewhere near -100 bps if there is not a recession. However, a pushback from currently priced -147 bps to -100 bps would bring another pressure on asset prices and short-term rates, and maybe on gold as well. And that, thanks to the sticky Core CPI and maybe to the too-resilient economy. Maybe there will be a soft landing with the Goldilocks scenario, but in my view, it's a little bit tricky and not what the market currently prices in. The market, in my view, is pricing a perfect landing . However, the very good question is, what are the overperformers based on these assumptions? Well, that´s not easy to answer, but the main winner is the very short-term money market, which should provide some kind of protection and rather prefer a waiting approach.
Few months ago I was very bullish on ((AGG)) and ((TLT)), where I pointed out :
Imagine the following long-term yields: 4.24 percent for 10 years, 4.55 percent for 20 years, and 4.33 percent for 30 years. These are the levels that investors and many analysts believed would never be reached again. Levels last seen in 2009. Nonetheless, this threat persists. From a timing perspective I believe, there could be a little bit spark up by 10-20 bps from current yields, which could pull down the AGG and TLT down. This could be solid opportunity.
As I believe the market to be fairly valued, I do not currently see such a great risk-reward opportunity in it in the very short term. Long-term yields will likely decline further, but as of two to three months ago, I did not see such a good opportunity there. Below you can see some of my valuation approaches.
Bond valuation based on 6m annualized Core CPI rate - fairly valued or slightly pricey
Comparing the US10y (y-axis) against the 6m annualized core inflation rate (x-axis), we can see that US10y is almost at fair value given the current Core CPI print. That's only if you take into account the new valuation line AfterCovid. Based on the current trajectory of core inflation, I view rates as rich when we examine the pre-COVID trend. I find it a little unrealistic that this model, which sees the current 6m Core CPI rate of 2.88 percent, assumes that US10y will be close to 5%. However, the relationship directs back to the PreCovid line following Monetary Policy Normalization, which is accompanied by rate increases and a run-off of the balance sheet. This is the next noteworthy fact. Stated differently, the yield curve is presently more influenced by Core CPI than it was in early 2023 (black), 2022 (red), and most definitely in 2021–2020 (blue). Therefore, we can conclude that US10y is either slightly rich or close to fair value when core inflation does not surprise to the downside.
Us Core 6m annualized vs US10y - After MP normalization, US10y moves to PRECOVID trend (Lucid Vision)
When bonds broke through 4,34–4,5% and I was a mega bond bull at the time, I made a great call for longing bonds. Bonds, however, reached a peak close to 5%, offering even lower levels. However, based on this measure, its value was reasonable. From this point, it is also very good to focus on more approaches and not just on this one. The second one revealed a multi-year opportunity.
Bond valuation based on market expectations and GDP - slightly undervalued
Using a slightly different method, I followed the one that Jurrien Timmer from Fidelity had inspired me to use. For US10y, I take into account short- to medium-term market rate expectations and GDP. As you can see in the chart, US10y was extremely cheap in 3Q 2023 (green boxes), compared to market expectations, when US10y was firmly above its fair value (model values). The deviation was greater than it was in 2015, 2017 and 2021. Furthermore, the model revealed also when US10y was rich; see the red areas for 2020 and 2021. This chart indicates that US10y is undervalued by about 20–30 basis points based on current market expectations, which assume nearly -150 rate cuts through the end of 2024 and more than -200 bps through the end of 2025. That's not a big deal to me in the short term, though.
Bond Valuation - Bonds were very cheap, currently fairly valued (Lucid Vision)
The yield pattern is pretty clear before and after rate cuts
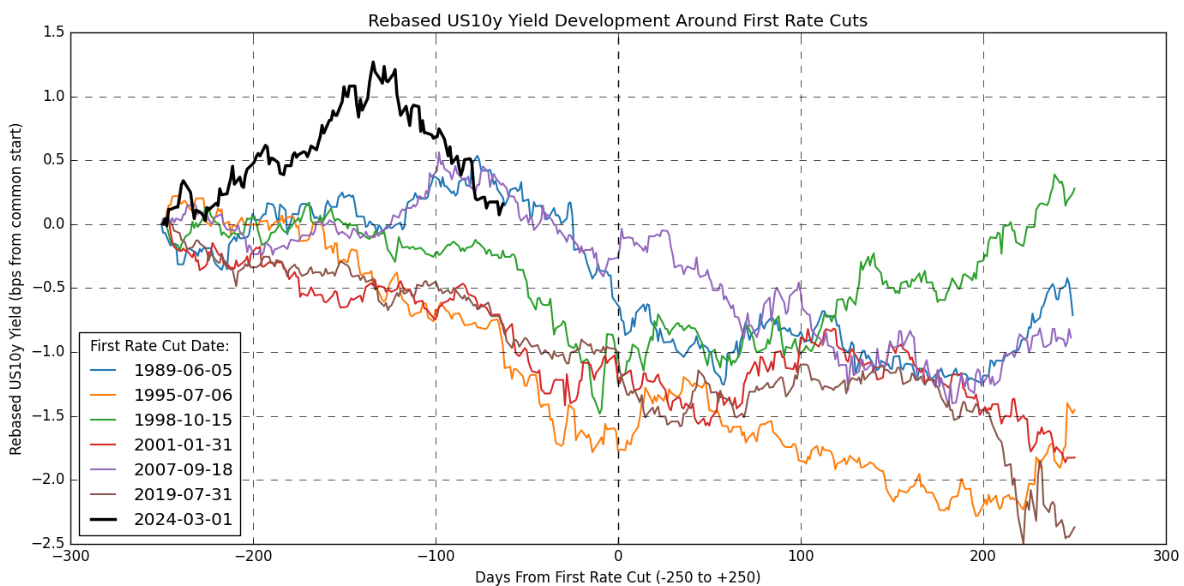
There is another reason for going long, and this is one in the medium term. The chart shows how bond yields develop before the first rate cut and afterward (250 days before and after). This is the reason for being a medium-term bull . However, my narrative is that based on the argument of sticky core, bounce in home prices, sticky wage rise, increase in commodity prices, and finally, significant easing priced by market could cause a slow uptick in inflation, which could delay significant easing already priced in. I strongly believe that the Fed will bring inflation down to target, but maybe it will be slightly longer than the market anticipates—the core could remain sticky, unemployment low, and the economy strong. For this reason, I believe that there could be some very easy sell-off in 1Q–2Q 2024 by 20–40 bps, which should be once again a great time to lock in bonds, even long-term. However, as you can see in the chart below, there is no reason to sell US bonds because the trend below is very strong and obvious. Yields in general decline before and after the first rate cut, even though it is anticipated by the market. However, the pattern shows that 20–40 days after the first rate cut, they tend to rise slightly. The last cycle (2024-03) is just for imagination; the first rate cut will come in March 2024 and shows the development from the last hike. But maybe this time will be different; who knows?
US10y before and after rate cuts (Lucid Vision via ChatGPT)
Two strategies
Money market
However, what are the good outcomes when assuming a repricing of the money market or expectations? First of all, the base scenario is a reduction of the number of cuts from -150 bps to -100 bps in 2024; thus, there could be a sell-off in risk assets as well as in gold due to a potential increase in real yields.
However, based on the cute rate cycle chart, I would definitely not bet on shorting the bond market right now. However, I would see opportunity in two options:
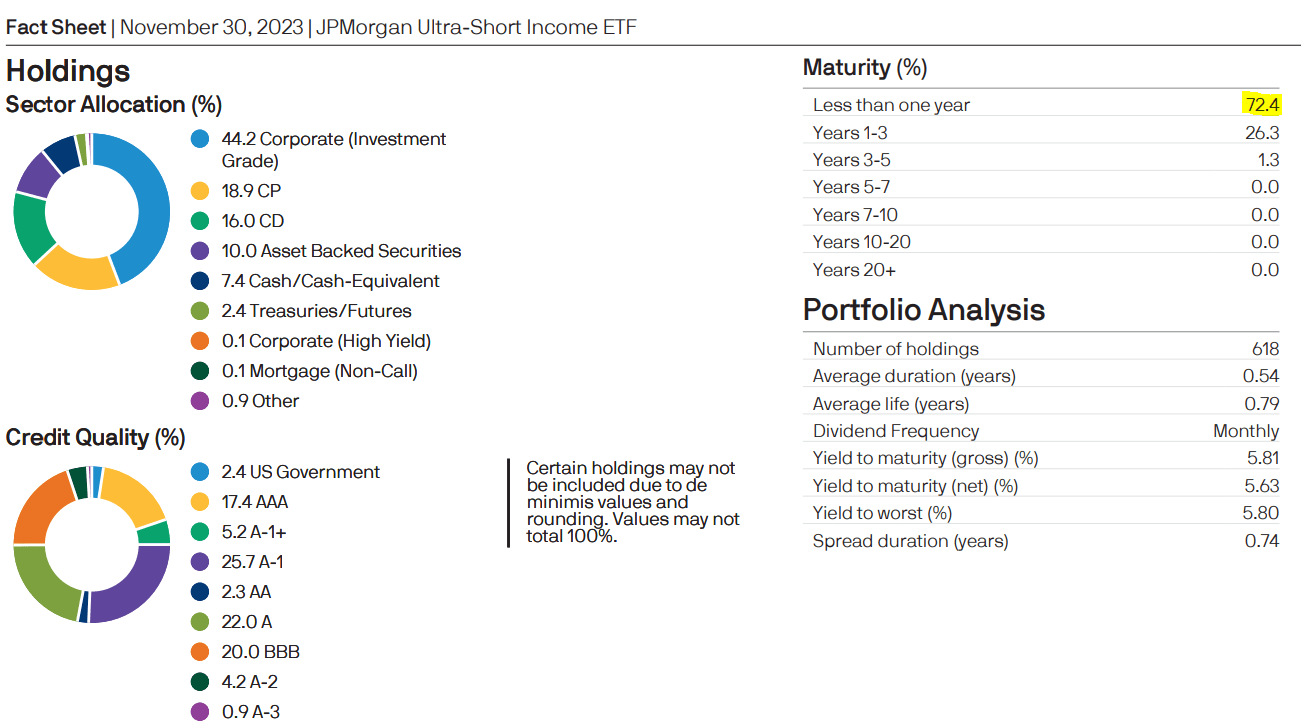
Firstly, being long in the money market because it is still attractive almost without any big volatility, even after a possible repricing of expectations. For this reason, it is a very good bet to lock in (JPST), which is an ultra-short or money market ETF that currently yields nearly 5,43% (30-day SEC yield). Moreover, the ETF has a very strong allocation, mainly with a 44.2% allocation to corporate IG; however, it has the best ratings so far, and most of the holdings have a maturity of less than one year (72.6%). From this point, you will get slightly better returns than US government securities. And that´s all with just a 0.18 percent expense ratio.
JPST Factsheet (JP Morgan)
In 2023, YTD return accounted for 5,19% and since 2017 for 16,02%. Heading into 2024 and sets for that base scenario, I believe it's worth watching and waiting for.
Being Long AGG - But wait for price pullback
Given the shift in market expectations, I think there is a medium-term opportunity in long-term bonds like AGG, but not in the near term—let's say within the next one to two months. Looking ahead, though, the ETF is still appealing for 2024 and 2025. As I previously indicated, there won't be as many rate cuts in 2024 as the market currently believes, but there's a good chance that 2025 rate cut expectations will stay unchanged. Although the long-term trade before and after rate cuts is fairly obvious, I think that when the sticky core persists, there may be a small bounce of 20–40 basis points for US10y, which will reduce some rate cuts in market pricing. Along with the valuation and pattern near rate cuts, the correction also makes sense.
Summary and Risks
Despite a solid decelerating trend with inflation based on 3m and 6m annualized data, the core 3m and 6m remain quite sticky thanks to the resilient shelter. Home prices started to reaccelerate, and wage increases remained quite sticky. With such low unemployment, it will be hard to cool down the core CPI. However, Core Ex Shelter shows very good progress, but the combination of so much easing priced in, a slight increase in commodity prices, and other factors could reboot the category again (slightly), which could cause stubborn prints and not deceleration. Thanks to the Fed´s monetary policy normalization, fundamentals started to matter more for bonds and not just short-term rates.
Thus, based on Core CPI and its PreCovid trend, US10y shows to be a little more pricy, so that´s a reason why expecting some 20–40 bps upward correction would be possible, but that is not guaranteed. Maybe it will not come. Valuation based on GDP and market expectations showed that bonds are slightly cheap, but most of the great risk-reward faded due to current market conditions (expectations). As there is a great correlation between short-to-medium term rate expectations and US10y, I believe the money market will re-rate and diminish some of the 50 bps prices (from 150 to 100 bps; the Fed target is 75 bps). It could cause a slight increase in short-term and long-term yields, which could give us a great call for 2024. In my view, market pricing is a little bit aggressive based on the current trend in Core CPI. So I guess there will be a pushback. From this point, I believe it is good to be well paid for being long ((JPST)), which bears only opportunity risk to be uninvested in risky assets instead. In my view, the market is pricing a perfect landing, which may not be so perfect. Finally, I see solid long-term opportunity in US10Y, but short term, there could be one more push-up. As revealed in the patterns in the chart from previous cycles, yields tend to decline in general before and after rate cuts (even when they are priced in). So betting against that evidence is not appropriate, from my view. The problem is whether the anticipated cuts in the market will materialize or not.
Magnificent 7 Concentration is an opportunity for tactical pair trade
On risk assets ( SPY ) or (QQQ), there could be a little pain heading to the repricing of the curve, but I believe returns will be positive in 2024, even if inflation shows a little bit more sticky or not. The Goldilocks scenario is possible, but that would also be a super outcome for other assets such as TLT or gold. As I said, I believe there will be "something less than perfect lending," thus, lower returns for risky assets could follow. However, I firmly believe that quality picks could significantly outperform. From a tactical side or pair trade heading into 2024 recovery, I prefer to be long ((JPST)) currently or more aggressively ((AGG)) or ((TLT)) if a 20–40 bps pullback materializes (or if core will go down), and on the other side, I see the potential of being long ( RSP ) and being short ((SPY)) as a tactical trade for:
- recovery, where an equal-weighted index could perform better on recovery
- due to the strong weight of Magnificent 7 companies reaching 28% in the SPY, thus the concentration risk remains very high
- even in the possibility of a market downturn, there could be a protection
I believe that the comparison of the estimated weights of M7 in SPX (which are very similar to those in SPY) and the RSP/SPY ratio best captures the essence of the pair trading concept as a whole. There is a clear negative correlation between the variables, so as the weights of M7 contract, the ratio increases, meaning that the RSP performs better than the SPY and vice versa. Even though I think the ratio is near the bottom and the M7 weights are near the top, I genuinely think that a tactical pair trade of this kind would make sense for statistical and economic reasons. Such high concentration risk is, in my opinion, underappreciated and ignored by many. It is important to keep in mind that the strategy does not guarantee that M7 will not rise; rather, it suggests that either M7 would experience a significant decline due to its higher beta (in case of downturn) or that other companies may perform better during the recovery. Therefore, I think that this tactical trade—with a combination of AGG (after pullback) and JPST—might make sense.
Peaking Concentration of M7 is opp for tactical pair trade (Lucid Vision)
However, the best strategy is to seek out and lock in quality companies. For the upcoming year 2024, I wish you guys all the best and feel free to leave a comment. I would be glad for a solid discussion or your feedback. Finally, do your own research before making any investments. The analysis shouldn't be considered investment advice as it is based solely on my opinions and knowledge.
For further details see:
The Confrontation Of Perfect Landing Narrative - Too Much Priced In