AFMC - The Debt Ceiling Standoff Could Be Worse For Markets Than You Think
2023-05-08 17:00:20 ET
Summary
- Republicans and Democrats always work out the debt ceiling at the last minute, right?
- Actually, this is a big deal. The economy has been juiced by unprecedented amounts of borrowing and deficit spending over the past three years.
- By my back-of-the-envelope calculations, government deficits are soon likely to be cut by 1.5% of GDP via spending cuts and revenue raises.
- Federal tax rates and interest rates have virtually only gone down over the past 25 years. If you don't understand how much deficits and QE have pumped up stocks, not much else matters.
- The debt ceiling alone could create a 10%-20% correction in the S&P 500.
This week, House Speaker Kevin McCarthy is due to meet at the White House with President Joe Biden. The topic of discussion is the debt limit, which has given recurring anxiety to the markets over the years –but has always been resolved at the 11th hour. This time, the anxiety is a little higher. Chaos ensued at last week's Treasury bill auction as traders demanded nearly a 6% yield on 1-month government debt to compensate for the risk of default. The US Treasury's cash balance has sharply declined this year, serving to stimulate the economy in the short run, but with the hangover to come of sharply higher interest rates after the debt limit is raised. This isn't normal!
Background: Out of Control Deficits
Before you ask "why" it's important to ask "if." It's been fashionable for a long time to say government spending is out of control, but recent government deficits truly are out of control. The consequences are obvious, creating a Catch-22 of either accepting much higher inflation and a declining standard of living – or accepting sharply higher interest rates. This isn't rocket science. Spending money you don't have has negative consequences.
For some explanation on the matter, let's turn to the Congressional Budget Office .
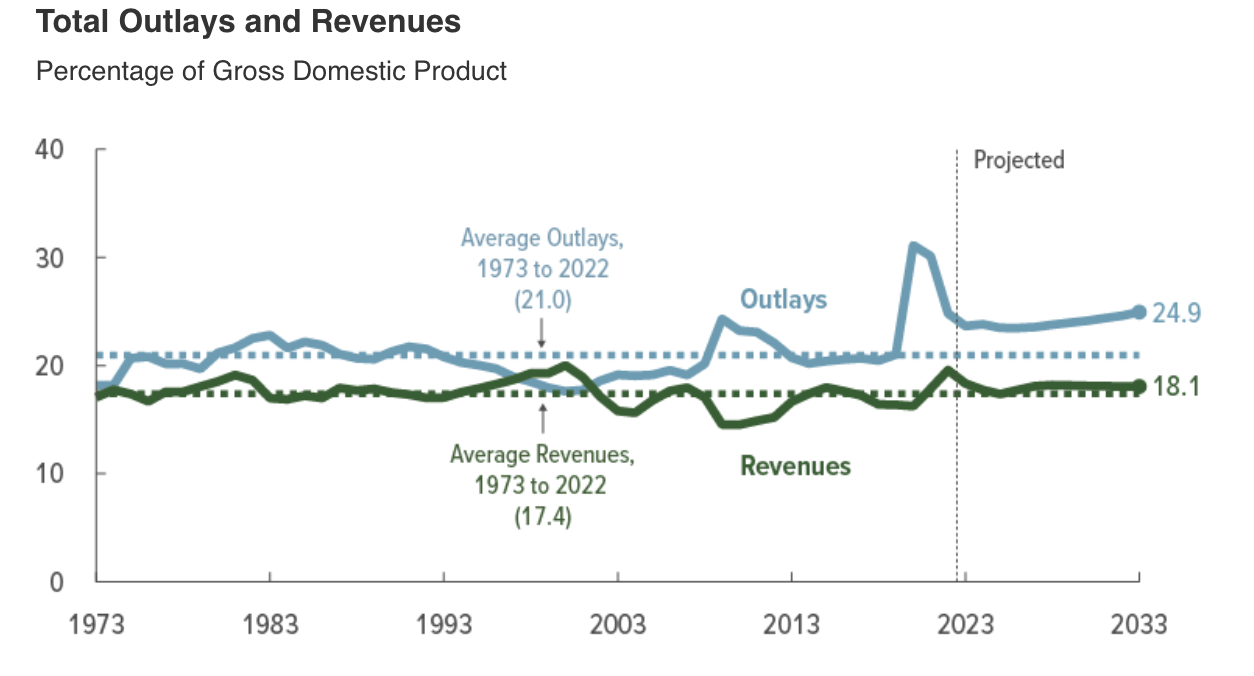
Total Outlays And Revenues (CBO)
This is fairly basic math, but federal government revenue is running about 18% of GDP, while spending is running about 24%. Note that this is just for the federal government, and states tax/spend as well. Some thoughts:
- It's actually a misconception that the federal government needs to run a completely balanced budget. Running some deficits is fine as long as GDP grows faster than the debt. Usually, this means a budget deficit of 3% is fine as long as the economy grows. 6%, however, is not fine and quickly leads to trouble.
- Federal government outlays used to be fairly stable with respect to the business cycle, as you can see from recessions from the 1970s to the early 2000s. At some point along the way, the federal government started trying to completely offset the business cycle with each recession. In 2008 this was probably fine, in early 2020 it was likely justified, but once inflation started roaring in 2021, it became clear that there were tighter constraints on the ability of the government to print money and spend it than was thought before COVID. This is important because stocks are trading at higher valuations than they have in the past, and there's a widespread belief that the Fed and Treasury will rush to bail out the Nasdaq ( QQQ ) if prices start to fall. However, with debt and inflation being where they are now, investors cannot expect much support from the Fed and Treasury.
Why Does The Debt Ceiling Matter?
The federal government spends too much money compared to the taxes it collects. This benefits the party in power in the short run, but it hurts the country in the long run. In a very cynical world, the party in power would simply print money to buy the votes they need to get reelected and repeat each election cycle. The debt ceiling creates a check on this by giving Congress some power to force spending cuts. That's the point, to review previously approved spending to make sure it's reasonable and necessary.
In 2011, Tea Party Republicans threatened to drop the hammer on the Obama administration by refusing to raise the debt limit. Obama blinked and acquiesced to roughly $900 billion in spending cuts in exchange for a debt ceiling increase. You can see the legacy of this in the outlays vs. revenue chart above. The Obama Administration ran a fairly tight ship after the debt ceiling, spending less than the post-war average while revenues recovered. The Clinton administration found itself in a similar position and actually ran surpluses. The lesson here is that while the debt ceiling increases have all been approved in the end, the existence of checks and balances in the legislative process has reared its head and repeatedly forced spending cuts in the past.
The situation now is unique for two reasons.
The first reason that today's situation is unique is that people seriously underestimate how much of Corporate America's success has been spoon-fed to it by DC. Long-time readers have likely seen this graph from a well-known Fed study before, but I'll share it again for new readers.
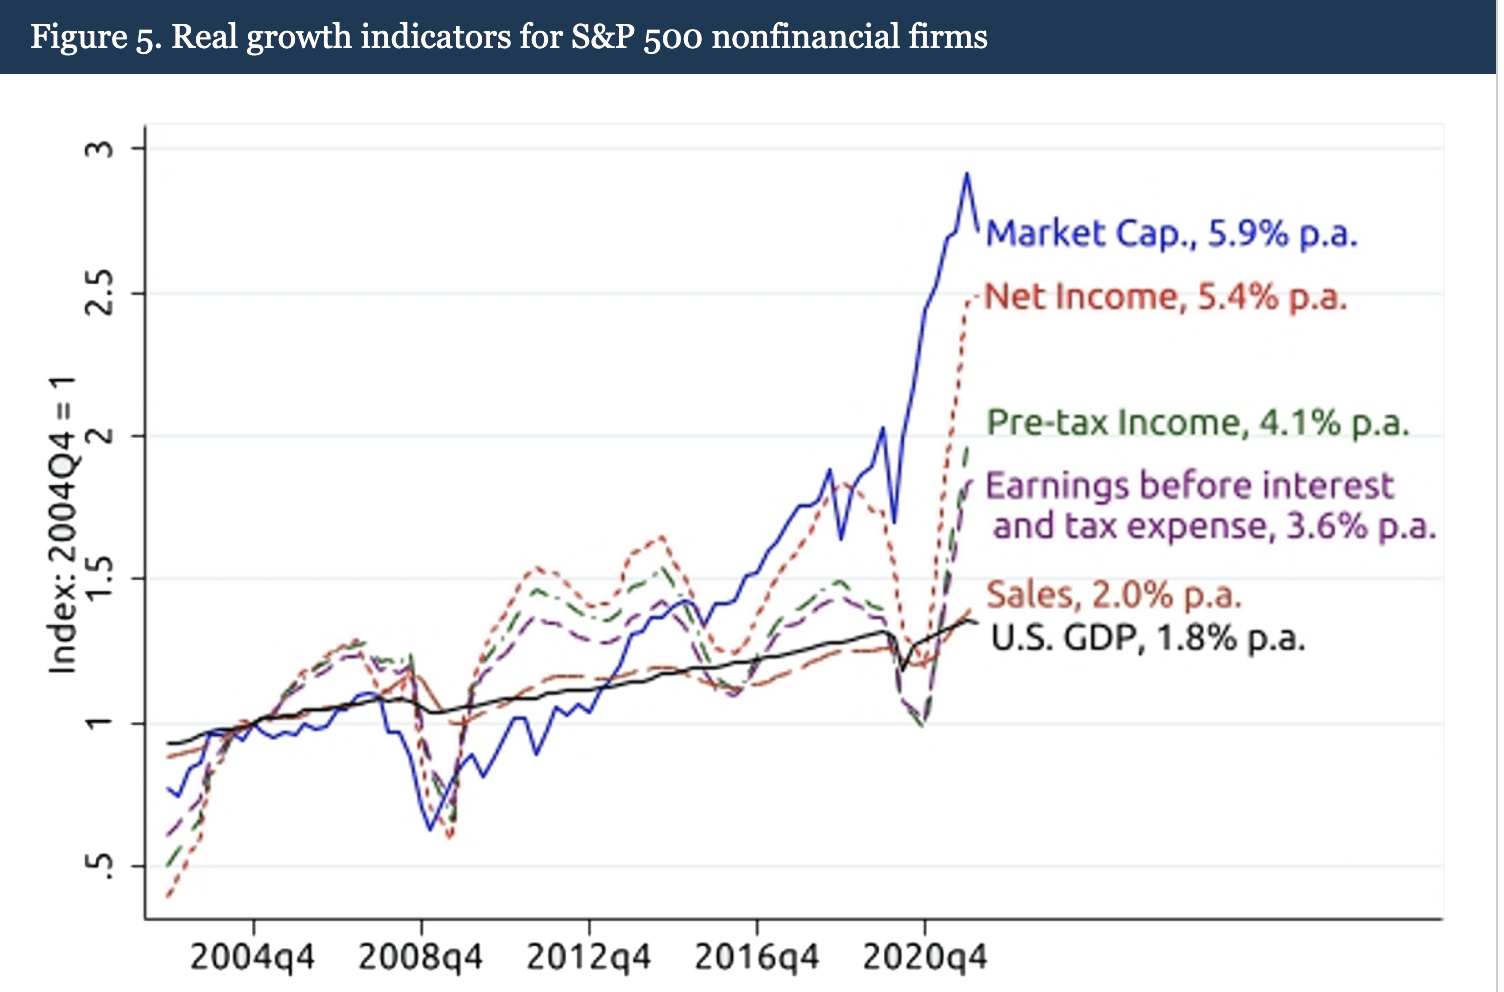
Revenue vs. Profit (Federal Reserve Board of Governors)
See here how much faster net income has grown than EBIT? That's a direct way to measure how much of corporate America's success has come from increased profitability and how much has come from tax cuts and lower rates. EBIT grew 3.6% per year, while net income grew 5.4% and valuations grew 5.9% per year. Only the EBIT growth is considered sustainable, while the rest is just a tailwind from expansionary fiscal policy. What happens when taxes get raised and interest rates go up? This shifts into reverse, implying stock returns of only 2% per year or less (or 4% before expected inflation).
The second reason is that Republicans actually have far more leverage than in the past due to much of the Biden administration's recent stimulus coming from an executive order to pause student loans. Student loans in the US equal roughly $1.8 trillion, or about 6.8% of GDP. If we assume debt service (principal/interest) is about 10% of this each year, that's about 0.68% of GDP each year that will be vacuumed back into government coffers. Betting markets have a roughly 82% chance that the $10,000 student loan forgiveness will be struck down, and the COVID national emergency ending this week likely gives the Biden admin no outs to draw to on this.
Biggest Tax Increases (FactCheck)
There's no Y-axis labeled here, but if you count student loan payments as "taxes," then striking down the student loan pause would be the third or fourth largest tax increase in post-war American history. The largest was a one-year surtax in 1968 to help pay for Vietnam.
On spending as well, the Republicans have leverage. Discretionary government spending has risen over the past few years, not only with COVID but also in the realm of military spending. Returning military spending to early 2000s levels is probably an area that both parties can compromise on. Where the US is cutting back, Europe could pick up the slack. Some modest military spending cuts are likely coming down the pike, with implications for defense stocks like Lockheed Martin ( LMT ) and General Dynamics ( GD ). With the US spending about double as a percentage of GDP as China does, there's some room to cut expenditures, invest in what works, and still guarantee national security.
There's plenty of domestic pork to cut as well, with nonsense subsidies to politically favored industries (i.e. healthcare, education) being a prime place to start. If you've never skimmed the text of a spending bill, it's an enlightening and somewhat shocking experience. To this point, the Republican House bill that passed is obviously obnoxious and extreme, but if it's meant to start negotiations with Biden, then it seems to have had its intended effect.
In all, I think we're looking at about 1.5% of GDP in combined spending cuts and revenue increases (mostly student loans, but don't rule out something like an increase in the new buyback excise tax). In contrast to past cycles, a slowing economy is likely to be met with higher rates and higher taxes.
What Does The Debt Ceiling Mean For Stocks?
When the government spends money, there's a multiplier effect on incomes. The idea is that if someone doesn't need to pay their student loans, they might spend the money at a bar instead, which creates income for the bar and bartenders, which they in turn spend. Generally, it's thought the way it nets out is that government spending $1 creates between $1 and $2 in consumer income. When it comes to corporate profits, the effect is likely higher. It works in reverse as well.
This is purely an educated guess, but cutting the budget deficit by 1.5 percent of GDP might decrease consumer incomes by 3% and corporate profits by 6%. However, doing so would also put the brakes on inflation and avoid long-term economic pain by avoiding an even bigger adjustment in the future. With this in mind, let's look at a few different scenarios for the debt ceiling and how I think stocks will react.
1. "Clean" Debt Limit Increase
I don't think this is the most likely outcome, but I think it's instructive that there's no positive outcome for stocks coming from DC. The first is a clean debt limit increase, where there are no spending cuts. Student loans will restart for most borrowers no matter what the Supreme Court does, but for the sake of this, we'll take the bookies at their word and assume the student loan cancellation is blocked.
In this case, the main two effects would be a restart in student loans and an increase in government borrowing costs.
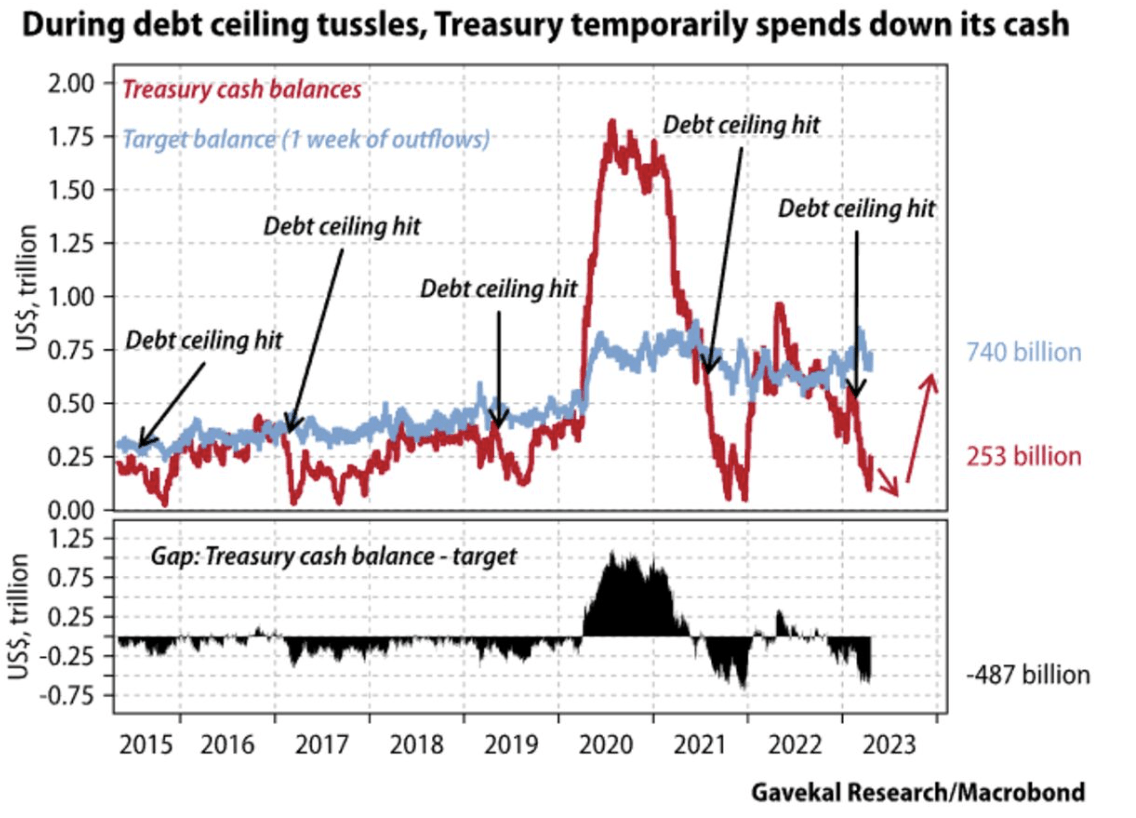
Treasury Cash Balance (Gavekal Research/Macrobond via Bloomberg)
In this case, US Treasury would have to issue about $500 billion in bonds, and the public would have to buy them. QT would in all likelihood continue, putting pressure on funding costs.
My educated guess from looking at historical Treasury yields is that this would push the 10-year yield up to 4.5%. This in turn would push multiples down for stocks, taking the S&P 500 multiple back to roughly where it was in late fall. Additionally, student loans kicking back in would put a lid on corporate profits, pulling stocks down compared to where they would otherwise be. This would be around 3600-3700 on the S&P, even if nothing else changes in the economy. Stocks would go from being up for the year to down a bit due to liquidity draining from the system.
2. Modest Spending Cuts + Debt Ceiling Increase
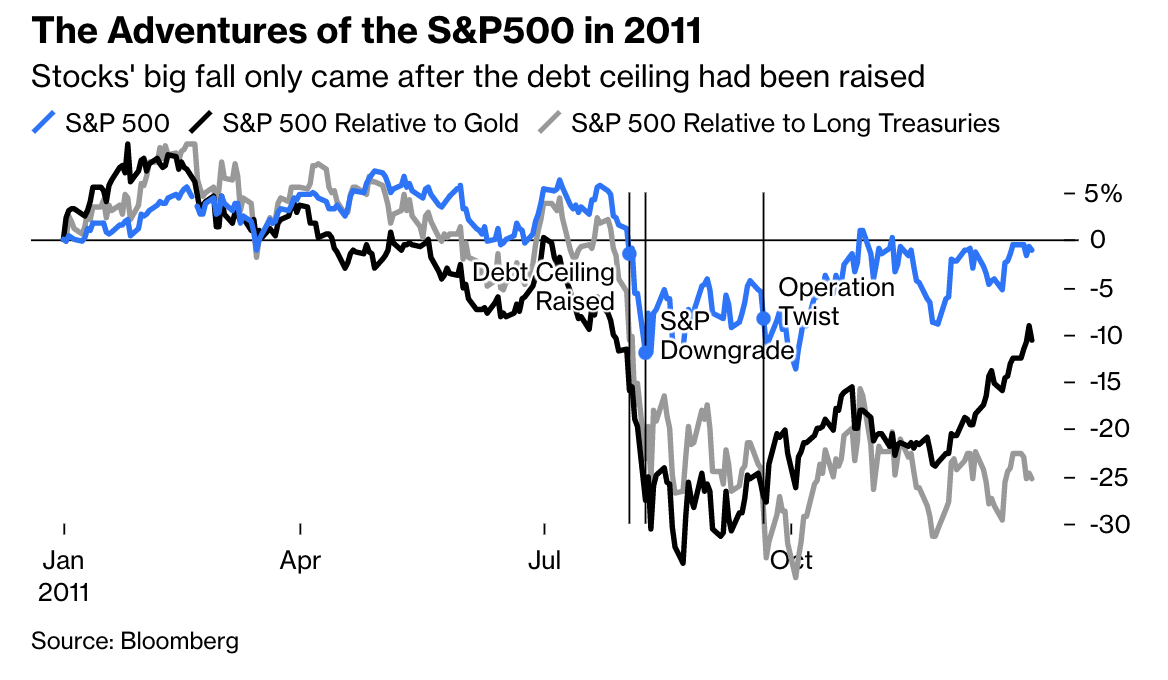
The second scenario looks a lot like the first one, with the added pressure of roughly 0.75% of GDP in spending cuts. In 2011, smaller spending cuts than this led to a roughly 15% selloff in the S&P 500 in short order. This selloff reversed when the Fed implemented " Operation Twist ," designed to offset the fiscal impact of spending cuts with some QE-like policy accommodation.
S&P 500 Performance 2011 (Bloomberg)
Things got somewhat ugly in 2011 until the Fed stepped in. It was fairly easy for the Fed to step in then because unemployment was high and core inflation was fairly low. With inflation now high and unemployment low, the Fed won't have the same willingness to step in and help.
Here, my expectation would be for a correction closer to 20%, possibly taking the market to near 3300. This would be due to earnings falling and liquidity continuing to tighten. This would also take the S&P 500 to roughly fair value, historically speaking. I believe that this scenario is most likely.
3. Default and/or Government Shutdown
The third scenario is the least likely but the most dangerous. In this scenario, no agreement is reached, and the government shuts down and/or defaults on its debt. There's no reason to panic yet, but traders are clearly worried about this scenario.
- Betting markets are pricing a roughly 15% chance of a technical default by the US Treasury.
- They're also pricing a roughly 20% chance of a government shutdown lasting more than seven days.
- Traders demanded a nearly 6% yield at the 1-month T-bill auction last week, spiking 240 bps in two weeks .
- CDS spreads on the US national debt have exploded in recent weeks. As of late April, the cost to insure €1 million in US Treasuries in Europe reached about $16,000. That's a premium of about 1.6%, implying decent odds of a default, or at least that traders were betting on it.
Something is going on here. It might end up being nothing, but there's now a non-zero chance of a government default happening in the United States this year. Doing so would be very, very bad. Likely consequences of this include a recession, a steep fall in the value of the US dollar, and a sharp rise in interest rates.
In this case (which I view as least likely), the S&P 500 is likely to fall below 3000, and possibly a lot lower. A global loss of confidence stemming from a debt crisis in the US government would permanently lower the standard of living in the US, and subject consumers to higher interest rates and/or inflation forever.
Key Takeaways
- Investors largely believe that the current debt ceiling situation is business as usual, but it actually is likely to come with a reduction in liquidity and a drop in consumer incomes. This is a feature, not a bug.
- The most likely outcome includes a rise in interest rates and modest cuts to government spending, leading to a fresh correction in the S&P 500. The best antidote to this is to hold more funds in short-term money market funds, now paying over 5%.
- It's possible for things to get far more chaotic, with either default or government shutdown being priced as having a 10%-20% possibility by betting markets. This strikes me as high, but financial markets in Europe are pricing a US default as a 1%-2% chance. I don't view these as likely, but they would crush the economy and the market. If this happens, you'd be well served by owning assets outside the United States, as well as alternatives like gold, and maybe some Bitcoin.
For further details see:
The Debt Ceiling Standoff Could Be Worse For Markets Than You Think