XLE - The Demise Of NYMEX Gas (Not To Mention Waha)
2023-03-07 17:27:13 ET
Summary
- Due to its prolific shale-gas resources, the domestic U.S. natural gas market is (somewhat) disconnected from the global natural gas market.
- Despite the significant ramp-up in U.S. LNG exports last year, domestic shale gas production has swamped demand, and the price of NYMEX has crashed over the past six months.
- While many politicians and media "experts" like to push an agenda that somehow there's a huge "energy shortage" in the U.S., factually that is simply not the case.
- Today, I'll take a look at the domestic natural gas market and opine on what investors can expect going forward and - more importantly - how to position themselves accordingly.
To the surprise of many investors, the domestic price of natural gas, as represented by the NYMEX continuous contract price (see graphic below), has dropped from $9.69/MMBtu last August, to the present $2.77/MBtu today (or down 71%). As bad as that drop sounds, it gets even worse: The Waha spot gas price (i.e., the Permian natural gas benchmark) actually went negative last October. The fact is, investors that have been following the false narrative and agenda of self-serving politicians, and media "experts" - and even some of the energy company CEOs themselves - have been led to believe that there is somehow a "terrifying" (to use CNBC's Brian Sullivan's description this morning ...) shortage of O&G. My contention, as I wrote in my recent Seeking Alpha article Investing In The Age Of Energy Abundance , is that the exact opposite is true. We live in an new-era of abundant O&G supply. The current natural gas supply/demand fundamentals in the United States obviously support my opinion. Indeed, despite dozens of coal plant closures and a significant ramp-up of LNG exports, the NYMEX nat gas price today is not much higher than it was pre-pandemic. With that as background, let's take a look at the supply/demand fundamentals for the domestic natural gas market and how investors can position themselves going forward.
MarketWatch
The big positive catalysts that drove NYMEX gas to its peak last year were, primarily, two-fold:
- Russia's invasion of Ukraine and weaponization of natural gas pipeline supplies to the EU for its support of Ukraine.
- The resulting demand pull from the EU for U.S. LNG.
And - as the previous NYMEX price chart clearly showed - that narrative certainly worked. Until it didn't. And the reasons it didn't continue are multiple - and nuanced - but are generally:
- U.S. short-cycle shale drilling for natural gas quickly increased production.
- Associated natural gas production from shale oil wells continued to increase.
- Both the U.S. and the EU had moderate winters that were warmer than normal.
Despite the false narratives being spun by many politicians, media "experts," and energy company CEOs, you may be surprised to know that the United States became the largest oil producer on the planet in 2018, became the No. 1 LNG exporter last year, and is a still growing crude-oil exporter.
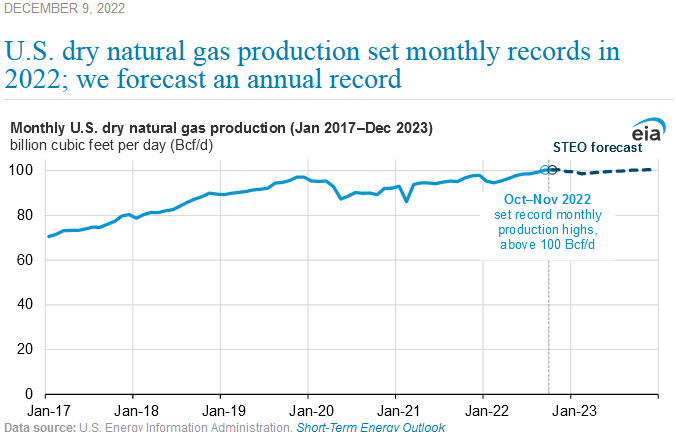
Indeed, the EIA reports that the U.S. - for the first time ever - reached an astonishing record of 100 Bcf/d of natural gas production last year:
EIA
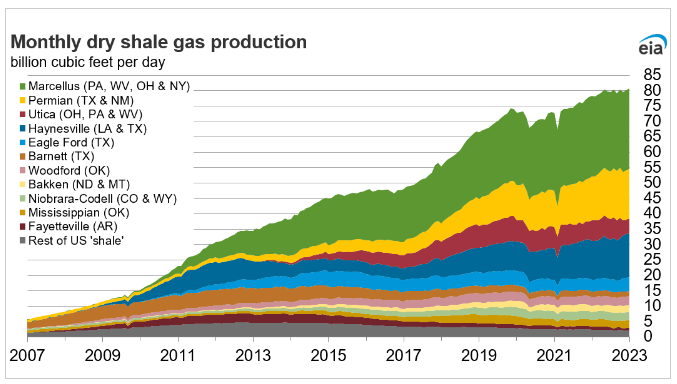
Certainly the major shale-gas basins like the Marcellus and Haynesville played a pivotal role in growing production to meet LNG export demand and make up a growing percentage of the corresponding rise in overall U.S. nat gas shale production:
EIA
As can be seen in the chart above, while the Marcellus shale is the largest component of natural gas production (by far), note also that the Permian contributes a significant amount and that the Haynesville shale - which is geographically much closer to LNG export terminals on the Gulf Coast as compared to the Marcellus - is also a fast growing source of nat gas feedstock for LNG terminals.
In the Permian, and despite the arguably very disciplined capex budgets by big Permian producers like ConocoPhillips ( COP ), EOG Resources ( EOG ), Pioneer Natural Resources ( PXD ) - and a host of others, companies like Exxon Mobil ( XOM ) and Chevron ( CVX ) have continued to significantly grow their Permian production. Indeed, Chevron is still targeting 1 million boe/d out of the play by 2025 and then plans to continue raising production to a range of between 1.2-1.4 million boe/d by 2030 and then holding it there for at least a decade.
Exxon's and Chevron's Permian growth plans are driven by the excellent returns from oil production in the play. Yet with that oil production also comes associated natural gas production. As the EIA's February 2023 Permian Drilling Report shows, Permian gas production is at record highs and has grown ~30% from an estimated ~17 MMcf/d in 2020 to ~22 MMcf/d today:
EIA
In addition, the disciplined spending by the previously referenced companies also means their average well-age is getting older... and older wells in the Eagle Ford and Permian get gassier over time. That is, the gas-to-oil-ratio, or "GOR," rises the longer a well is on production (see below). This is explained in more detail in this excellent NoviLabs article: What's Behind The Rise In U.S. Shale Gas Production?
Novi Labs
As the graphic above shows, Permian wells get significantly gassier the longer they are on production (i.e. their GOR gets higher over time).
The point here, and what I have been advising energy investors to consider, is that the false narratives being spun by politicians, media "experts," and even some energy company CEOs, that shale O&G was somehow no longer "short-cycle," but would take "years" to increase production is simply and patently false. Nothing proves it more than the quick and huge response of U.S. natural gas production to meet a step-function increase in demand from the EU for American LNG exports.
Now, in June there was a surprise reduction in LNG export capacity of ~2 Bcf/d (more details below), and combined with a warmer than normal winter, U.S. gas storage actually posted a very unusual build in January (i.e. the red circle below - in the middle of winter):
YCharts
So that's a look at the domestic natural gas supply side (i.e. abundant and short-cycle resources ...). Now let's look at demand.
LNG Exports To The Rescue?
As the chart below shows, U.S. LNG export capacity ramped up considerably from 2016 to 2020. Then the global pandemic hit (a bit of a lull ...), and then in early 2022 Putin decided - for no reason - to begin Russia's invasion of Ukraine. When the U.S. and the EU threw its support behind Ukraine - Putin weaponized natural gas deliveries to the EU by cutting off the flow of natural gas through pipelines from Russia to the EU. The result, as you know, was strong demand from the EU for natural gas - and much of that demand was satisfied by a rapid increase in LNG exports from the United States over the past year:
EIA
Indeed, U.S. LNG exports averaged 11.1 Bcf/d during the first half of 2022. In June, the Freeport LNG export facility (2 Bcf/d) was shut down due to an accident. That left more Permian gas production for the US market to absorb. Yes, 2 Bcf/d was certainly a large slug of total U.S. LNG export capacity at the time (~18%), and the back-up in Permian exit capacity caused by that reduction in LNG feedstock is what led to - as I mentioned earlier - the price of Waha gas going negative in the Permian last October.
However, it's worth noting that Freeport's 2 Bcf/d equates to only 2% of total U.S. production (~100 Bcf/d). That was obviously not enough to move the "NYMEX needle," and it continued to drop.
What could potentially move the needle going forward is additional LNG export capacity. Addition LNG capacity will start coming online in January of next year as three new plants plan to start-up: Plaquemines, Corpus Christi Stage III, and Golden Pass. In total, the EIA estimates these three plants are expected to ramp-up to an aggregate capacity of ~6 Bcf/d (see graphic above, colored bars on the top right). That obviously equates to an additional 6% of total current U.S. natural gas production, and a 40%-plus increase in total U.S. LNG export capacity.
That said, note that the EIA currently expects it to take two years to ramp up to the full 6 Bcf/d total aggregate nameplate capacity, with roughly 50% of that - or 3 Bcf/d - coming online by the end of 2024.
The bottom line: Other than the Freeport restart, there's no significant LNG export capacity increase expected this year, and only about a ~3 Bcf/d increase by year-end 2024 (i.e. about 3% of current total U.S. nat gas production).
And, as mentioned earlier, overall U.S. production continues to grow due to growing associated gas production because of targeted oil drilling in the Permian. Meantime, older shale wells continue to get gassier - and the U.S. shale industry is now old enough such that there are certainly a lot of older shale wells out there. These wells cannot be vented or flared due to increased monitoring, and operators can't cap the wells because that option is too expensive. As a result, I continue to be relatively bearish on the near and mid-term (0 to 18 months) prospects for NYMEX natural gas - and very bearish for Permian gas (Waha) over that same time frame.
For that reason, I'm much more constructive on energy companies that have greater exposure to oil and global LNG prices as compared to the Permian pure-play producers (i.e. EOG, PXD, and Occidental ( OXY ) for example). That means I favor companies like Chevron, Exxon, and ConocoPhillips.
COP not only already has excellent Australian LNG ("APLNG") and Qatar LNG assets, but in July the company signed an agreement with Sempra ( SRE ) to potentially and significantly increase its global LNG business via a 30% equity stake in Sempra's Port Arthur Liquefaction Holdings with an LNG offtake equivalent to ~5 million tonnes per annum ("Mtpa"). The agreement also has COP, a top-5 natural gas marketer in the U.S., supplying the natural gas for the 5 Mtpa offtake its 30% stake equates to. According to the agreement, COP also has additional gas supply potential for the Port Arthur LNG facility. The 30% equity stake and supply agreement is a great way for COP to monetize its Eagle Ford and Permian gas production and achieve higher overall margins on that production.
Risks - The Weather
Globally, natural gas supply/demand fundamentals are still greatly impacted by the winter weather demand. However, in the United States - and due to global warming, increasing LNG export capacity, and the increasing use of natural gas for electrical power generation (i.e. air conditioning demand in hot summers) - the differences in seasonal demand are not nearly as variable as in the past when winter demand was very high and summer demand was relatively low.
The result is that the EIA's most recent Weekly Natural Gas Storage Report shows that we are at the very top of the five-year moving average for natural gas in storage for this time of year: 451 Bcf higher than last year at this time, 342 Bcf above the five-year average of 1.77 Tcf (see the blue-line on the far right):
EIA
Just to be clear - in case you're not familiar with U.S. natural gas storage numbers - that's a huge supply of natural gas for this time of year. That's especially the case in the face of still increasing natural gas production. That said, of course the weather can certainly change. If we have an abnormally early and cold start to next winter, my opinion could change. However, I'm not expecting that scenario - in fact, I expect just the opposite. If past years are any indication, I'm expecting a very hot and long summer and another relatively mild - and warmer - fall and winter.
Summary and Conclusion
Despite the false narratives being spun by self-serving politicians, media "experts," and even some energy company CEOs themselves, the U.S. is the #1 petroleum producer in the world, the #1 LNG exporter in the world, and a still growing crude oil exporter. In the U.S. today, there's a very high level natural gas in storage, total production of a rather astonishing 100 Bcf/d, and the productive capacity to very easily grow that production much (much) higher.
Despite an expected increase of 3 Bcf/d of LNG export capacity by year-end 2024, in my opinion - it won't be enough to move the needle much given current U.S. production and the associated gas production due to those operators drilling for oil - primarily in the Permian. For that reason, I continue to favor the large U.S. companies that have significant exposure to Brent oil prices as well as global LNG prices that are typically linked to Brent. These are Exxon, Chevron, and ConocoPhillips.
The following graphic compares the total three-year returns of these three companies as compared to the broad market averages - the S&P 500 and Nasdaq-100 - as represented by the Vanguard S&P500 ETF ( VOO ) and Nasdaq-100 Trust ( QQQ ), respectively:
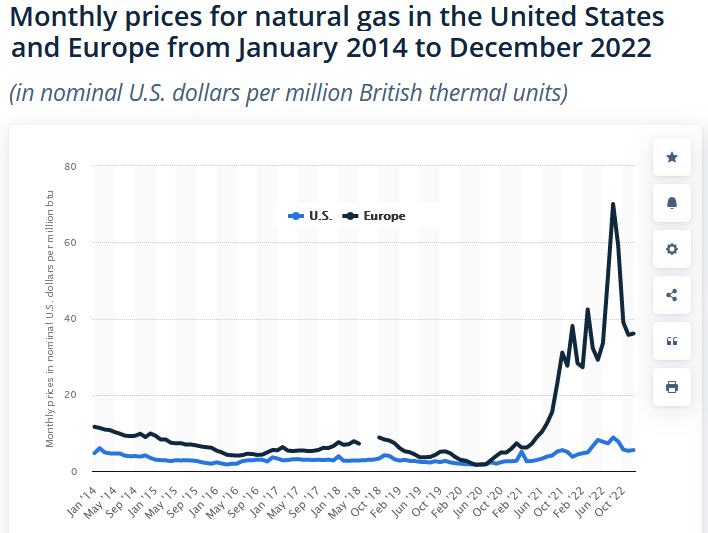
Lastly, the relatively low price of domestic natural gas (currently ~5x lower than in the EU, see graphic below) is also a boon to domestic refiners and chemicals companies. A company like Phillips 66 ( PSX ), which has refining operations in the U.S., as well as chemicals operations on the Gulf Coast as a result of its 50-50 CPChem JV with partner Chevron, might be appealing for investors that have no direct exposure to refining and/or chemicals. PSX currently trades with a forward P/E of only 7.5x, pays a $4.20/share annual dividend, and yields 4%.
Statista
For further details see:
The Demise Of NYMEX Gas (Not To Mention Waha)