BDXB - The Dividend Aristocrats Ranked By Quality Scores
Summary
- The annual rebalancing and subsequent changes to the S&P 500 Dividend Aristocrats Index have produced a new list of 67 dividend growth stocks called the Dividend Aristocrats.
- I rank the Dividend Aristocrats using Quality Snapshots, an elegant and effective system for assessing the quality of dividend growth stocks.
- As in prior editions of this article, I identify the top opportunities for income, growth, and total return investors.
- I provide a downloadable spreadsheet with fundamental and added value data of all the Dividend Aristocrats.
Created by the author
Last month, I ranked the Dividend Kings using quality scores obtained from a version of DVK Quality Snapshots that employs six quality indicators, each worth 5 points, for a maximum quality score of 30 points.
I use the same system in this article to rank the stocks in the S&P 500 Dividend Aristocrats Index. These are S&P 500 companies that have paid higher dividends every year for at least 25 consecutive years.
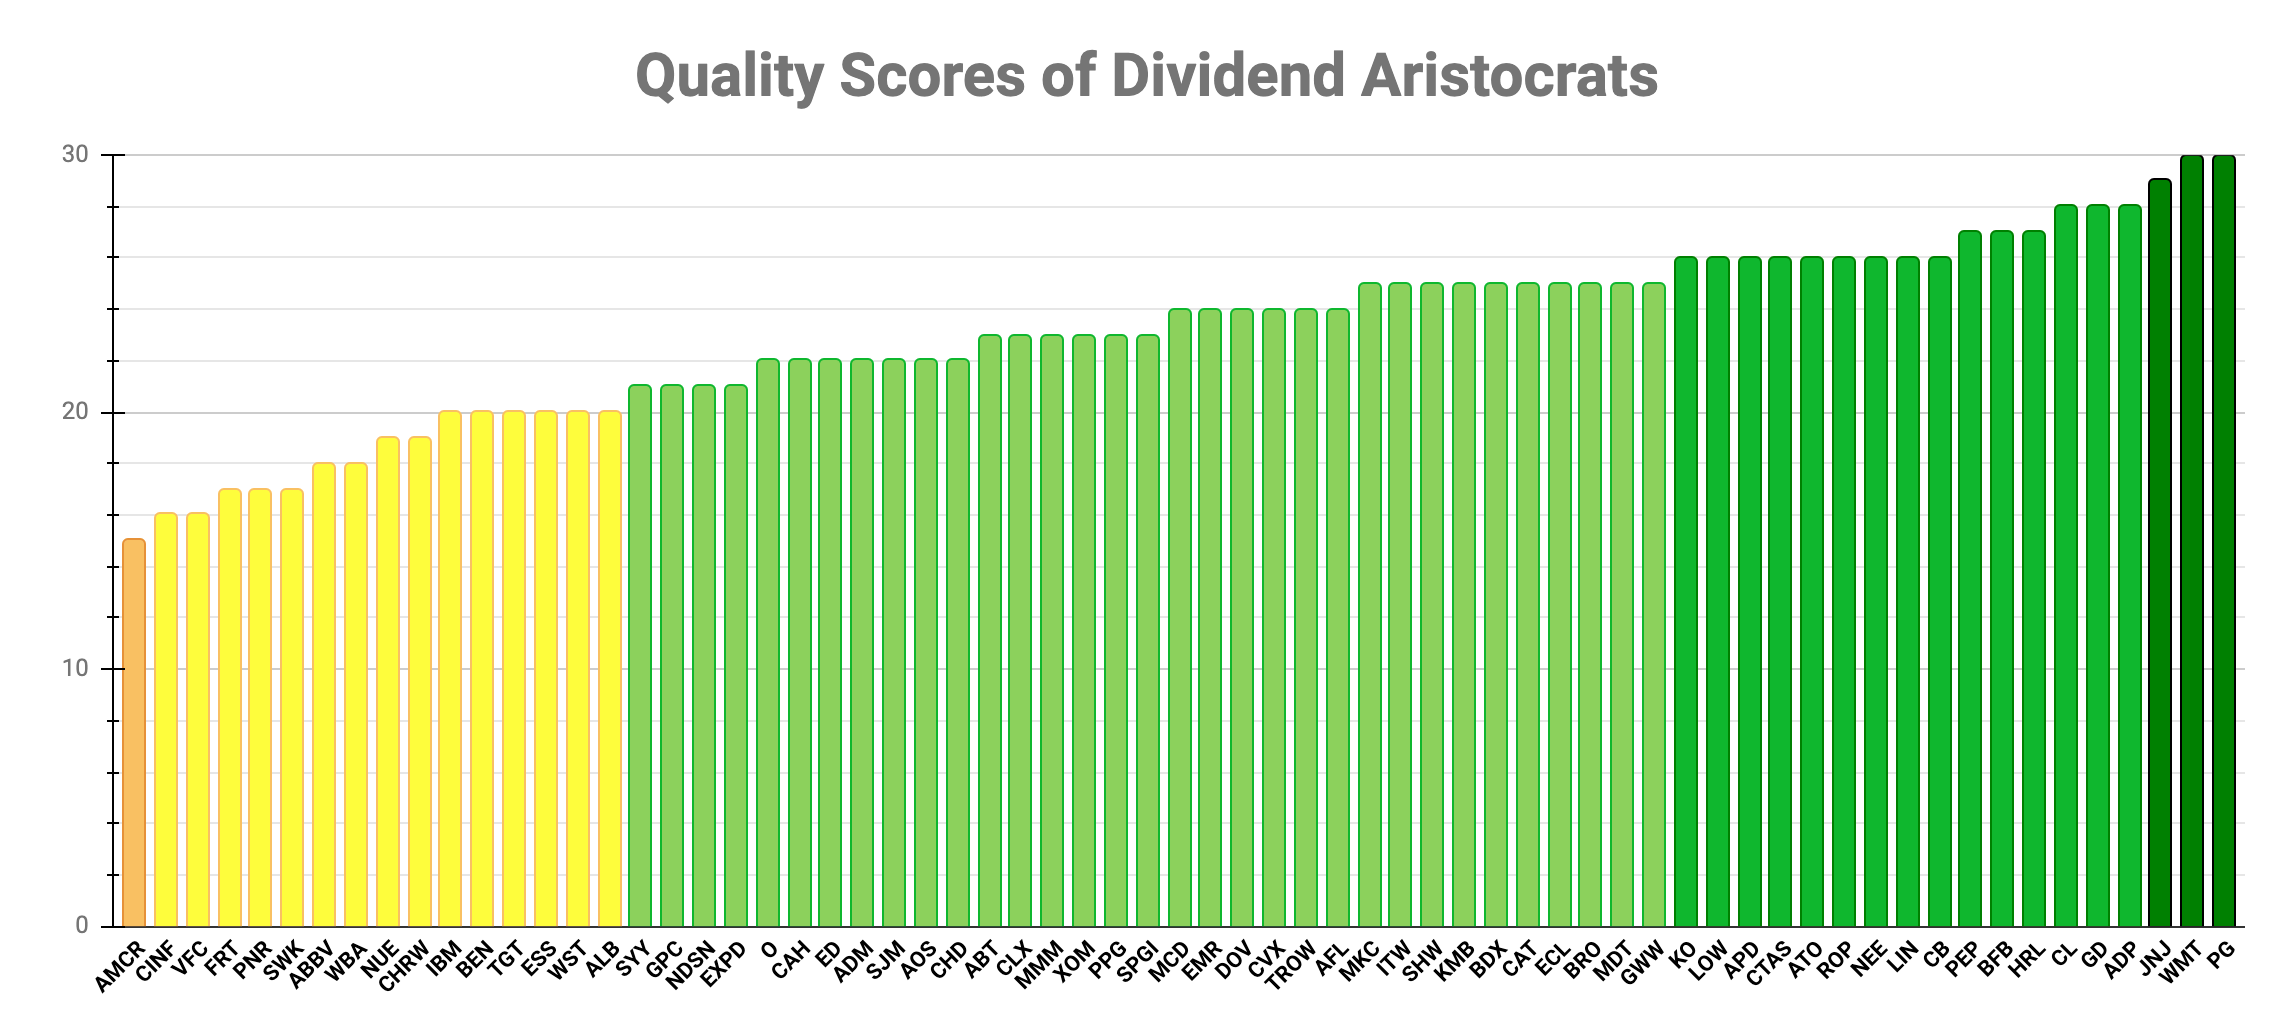
Based on their quality scores, I rate stocks as Exceptional (29-30), Excellent (26-28), Fine (21-25), Decent (16-20), Poor (11-15), and Inferior (0-10). Investment Grade ratings have quality scores in the range of 16-30, while Speculative Grade ratings have quality scores below 16 points.
I provide key metrics, quality indicators, risk-adjusted Buy Below prices, and a downloadable spreadsheet with fundamental and added value data of all the Dividend Aristocrats. Additionally, I select Dividend Aristocrats with safe dividends and superior growth and income outlooks for your consideration.
The last time I covered the Dividend Aristocrats, there were 64 constituents. On January 24, 2023, the S&P Dow Jones Indices announced the annual rebalancing results for the S&P 500 Dividend Aristocrats Index, adding three companies:
So now there are 67 Dividend Aristocrats.
Please note this article updates prior editions. While the scoring system is different, the general layout of this article is quite similar and, inevitably, uses similar descriptions and explanations.
About the Dividend Aristocrats
The S&P 500 Dividend Aristocrats Index is a list of companies in the S&P 500 that have paid higher dividends every year for at least 25 consecutive years. Only regular cash dividends count.
To be included in the list, constituents must meet several criteria:
- Universe : Must be a member of the S&P 500.
- Selection : Must have increased dividends every year for at least 25 consecutive years.
- Market Cap : Must have a float-adjusted market cap of at least $3 billion on the rebalancing date.
- Liquidity : Must have an average daily value traded of at least $5 million for the trailing three months on the rebalancing date.
- Diversification :
- Stock : At each rebalancing, there must be at least 40 members.
- Sector : No GICS sector can exceed 30% of the index weight.
If a company suspends or cuts its dividend or is removed from the S&P 500 index, the company is also removed from the list of Dividend Aristocrats.
Special rules apply for spin-offs, as well as mergers and acquisitions.
Quality Assessment
The version of Quality Snapshots I use in this article employs six quality indicators and assigns 0-5 points to each quality indicator, for a maximum of 30 points. Here are the changes I made to the original Quality Snapshots system as proposed by David Van Knapp:
[1] Value Line's Price Stability replaces Value Line's Safety Rank
Price Stability is based on a ranking of the standard deviation (a measure of volatility) of weekly percent changes in the price of a company's stock over the last five years. It is reported on a scale of 100 (highest) to 5 (lowest) in increments of 5. I assigned scores for Price Stability to somewhat match the distribution of scores of the other quality indicators.
[2] Value Line's Financial Strength is scored differently
A scores 4 points instead of 3 points, and B++ moves up to fill the 3 points slot. I decided to make this change after comparing the distribution of scores for Financial Strength to the other quality indicators.
[3] Added a new quality indicator, Portfolio Insight's Dividend Quality Grade
I considered the distribution of Dividend Quality Grades of Dividend Radar stocks to assign grades to different point slots.
With six quality indicators and up to five points available per indicator, the maximum quality score is 30. Here's how I rate stocks and differentiate between Investment and Speculative grades:
How I Rank Stocks
To rank stocks, I sort them by quality score and break ties by considering up to three factors in turn:
- Simply Safe Dividends Dividend Safety Scores
- S&P Global Credit Ratings
- Forward Dividend Yield.
When two stocks with the same quality score have the same Dividend Safety Score , I compare their Credit Ratings , ranking the one with the better Credit Rating higher. I rarely need to break ties with the Forward Dividend Yield.
Key Metrics and Valuation
The following sections present all 67 Dividend Aristocrats ranked by quality score.
Each table below presents key metrics of interest to dividend growth investors, along with quality indicators and my Buy Below price:
|
Color-coding
|
I use a survey approach to estimate fair value, referencing fair value estimates and price targets from several online sources, including Portfolio Insight, Morningstar, and Finbox. Additionally, I estimate fair value using the 5-year average dividend yield of each stock using data from Portfolio Insight. With several estimates and targets available, I ignore the outliers (the lowest and highest values) and use the average of the median and mean of the remaining values as my fair value estimate.
My risk-adjusted Buy Below prices allow premium valuations for the highest-quality stocks but require discounted valuations for lower-quality stocks:
Dividend Aristocrats rated Exceptional
The first table contains the highest-quality Dividend Aristocrats with quality scores of 29-30.
Author Spreadsheet (Data sources: Portfolio Insight, Simply Safe Dividends, S&P Global, Value Line, and Morningstar)
| Rank |
| Company (Ticker) |
| Sector |
| Supersector |
| 1 |
| Procter & Gamble ( PG ) |
| Consumer Staples |
| Defensive |
| 2 |
| Walmart ( WMT ) |
| Consumer Staples |
| Defensive |
| 3 |
| Johnson & Johnson ( JNJ ) |
| Health Care |
| Defensive |
Last time , JNJ was ranked #1, while PG and WMT were ranked #2 and #4, respectively.
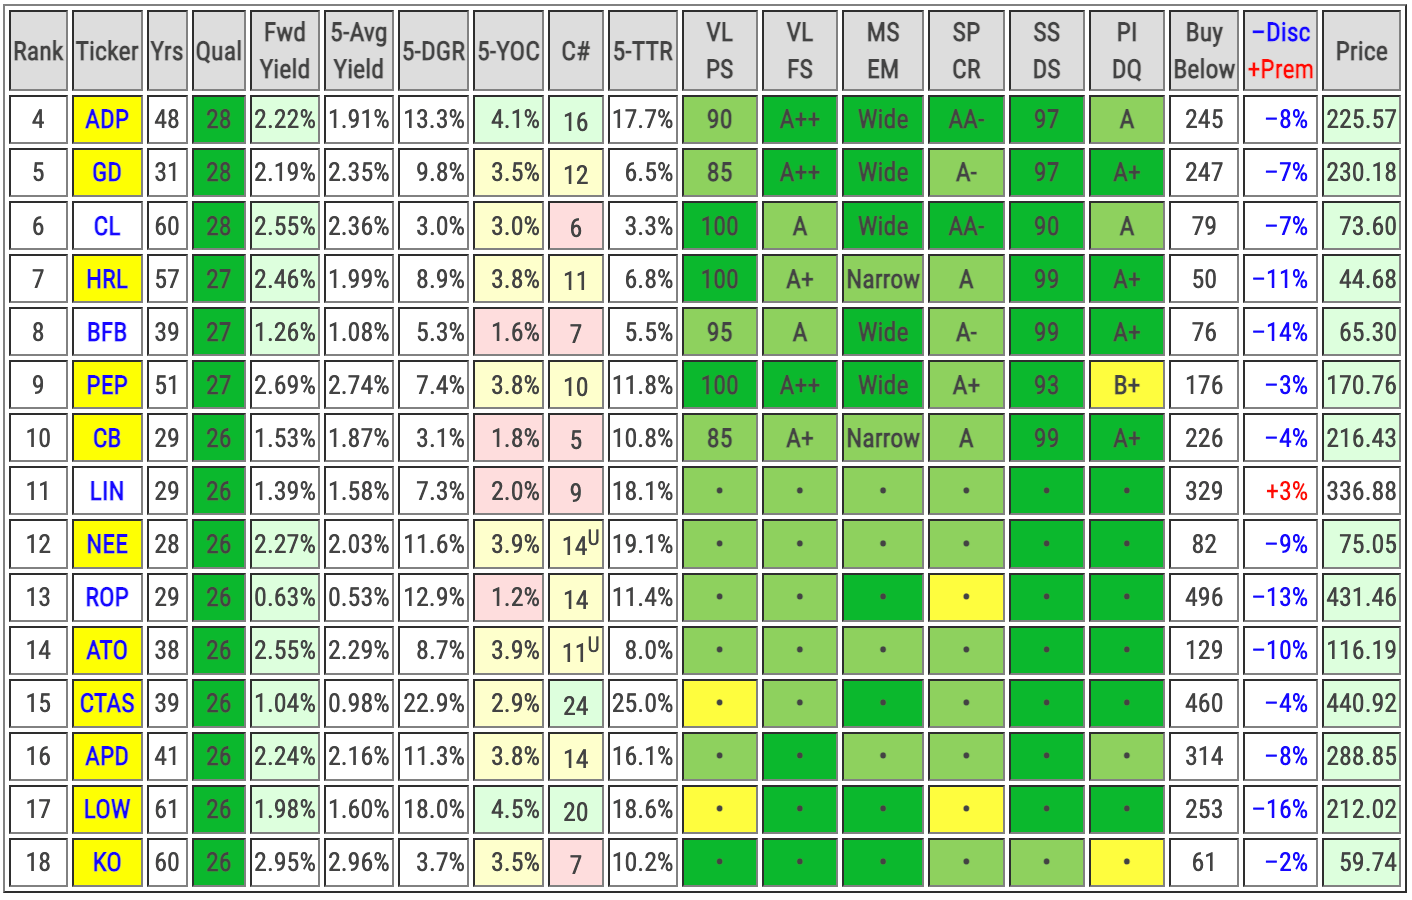
Dividend Aristocrats rated Excellent
The following table contains high-quality Dividend Aristocrats with quality scores of 26-28.
Please note that I only show the grades/indices/ratings/scores of the ten top-ranked Dividend Aristocrats in this article.
Author Spreadsheet (Data sources: Portfolio Insight, Simply Safe Dividends, S&P Global, Value Line, and Morningstar)
| Rank |
| Company (Ticker) |
| Sector |
| Supersector |
| 4 |
| Automatic Data Processing ( ADP ) |
| Information Technology |
| Sensitive |
| 5 |
| General Dynamics ( GD ) |
| Industrials |
| Sensitive |
| 6 |
| Colgate-Palmolive ( CL ) |
| Consumer Staples |
| Defensive |
| 7 |
| Hormel Foods ( HRL ) |
| Consumer Staples |
| Defensive |
| 8 |
| Brown-Forman ( BFB ) |
| Consumer Staples |
| Defensive |
| 9 |
| PepsiCo ( PEP ) |
| Consumer Staples |
| Defensive |
| 10 |
| Chubb ( CB ) |
| Financials |
| Cyclical |
| 11 |
| Linde plc ( LIN ) |
| Materials |
| Cyclical |
| 12 |
| NextEra Energy ( NEE ) |
| Utilities |
| Defensive |
| 13 |
| Roper Technologies ( ROP ) |
| Information Technology |
| Sensitive |
| 14 |
| Atmos Energy ( ATO ) |
| Utilities |
| Defensive |
| 15 |
| Cintas ( CTAS ) |
| Industrials |
| Sensitive |
| 16 |
| Air Products and Chemicals ( APD ) |
| Materials |
| Cyclical |
| 17 |
| Lowe's ( LOW ) |
| Consumer Discretionary |
| Cyclical |
| 18 |
| Coca-Cola ( KO ) |
| Consumer Staples |
| Defensive |
Last time, ADP was rated Exceptional , but the stock dropped to the Excellent rating because I'm now using Price Stability and Dividend Quality Score as new quality indicators.
GD, CL, and PEP stayed in the top ten and are joined by HRL, BFB, and CB (stocks that ranked lower last time). Other stocks promoted to Excellent are LIN, NEE, ROP, ATO, CTAS, and LOW.
The biggest jumps in rankings are LIN (24 spots) and CTAS (15 spots).
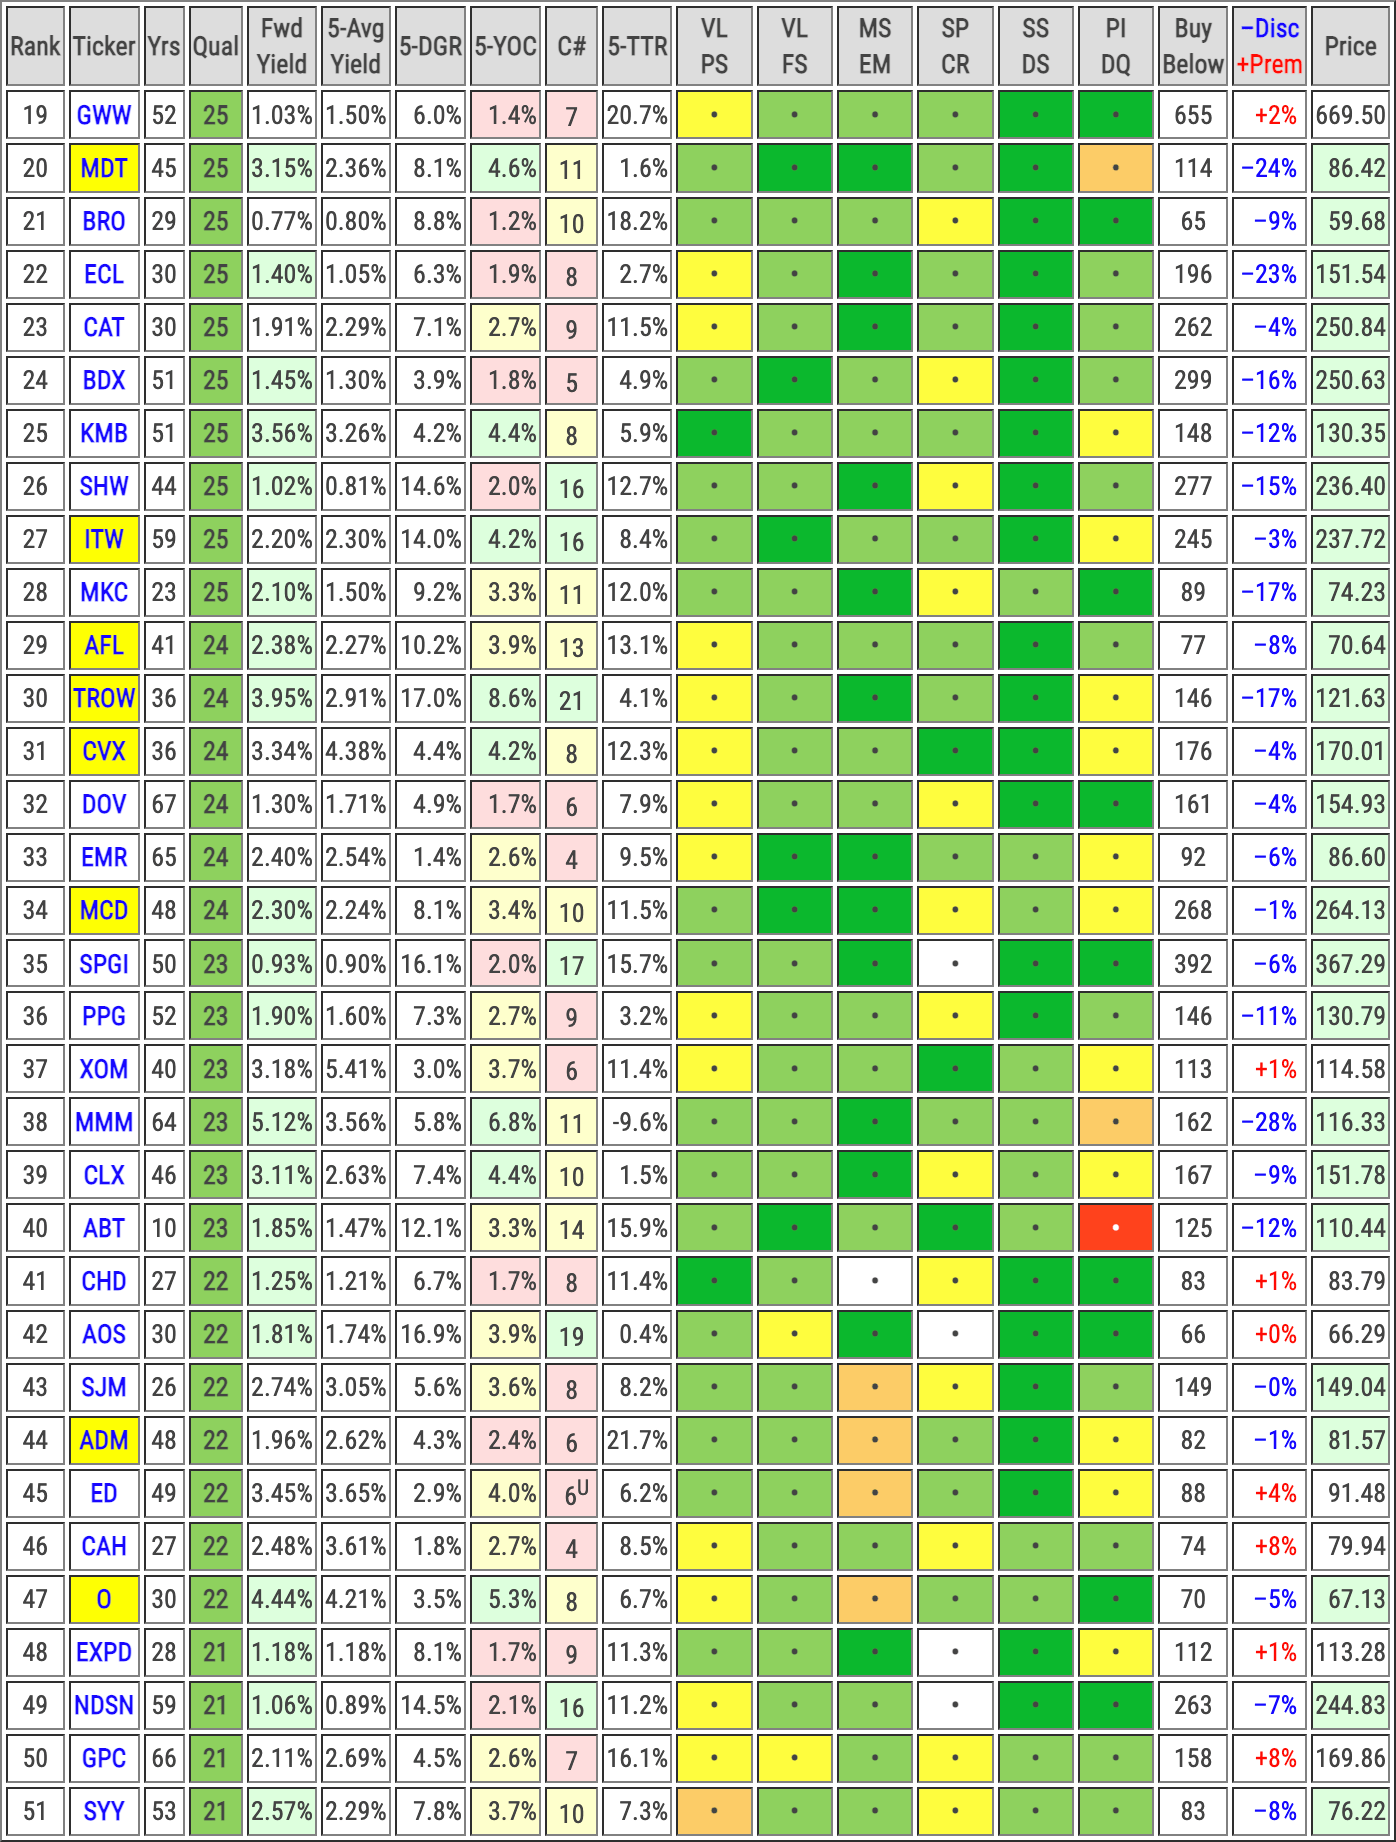
Dividend Aristocrats rated Fine
The following table contains quality stocks with quality scores of 21-25.
Author Spreadsheet (Data sources: Portfolio Insight, Simply Safe Dividends, S&P Global, Value Line, and Morningstar)
| Rank |
| Company (Ticker) |
| Sector |
| Supersector |
| 19 |
| W.W. Grainger ( GWW ) |
| Industrials |
| Sensitive |
| 20 |
| Medtronic plc ( MDT ) |
| Health Care |
| Defensive |
| 21 |
| Brown & Brown ( BRO ) |
| Financials |
| Cyclical |
| 22 |
| Ecolab ( ECL ) |
| Materials |
| Cyclical |
| 23 |
| Caterpillar ( CAT ) |
| Industrials |
| Sensitive |
| 24 |
| Becton, Dickinson ( BDX ) |
| Health Care |
| Defensive |
| 25 |
| Kimberly-Clark ( KMB ) |
| Consumer Staples |
| Defensive |
| 26 |
| Sherwin-Williams ( SHW ) |
| Materials |
| Cyclical |
| 27 |
| Illinois Tool Works ( ITW ) |
| Industrials |
| Sensitive |
| 28 |
| McCormick ( MKC ) |
| Consumer Staples |
| Defensive |
| 29 |
| Aflac ( AFL ) |
| Financials |
| Cyclical |
| 30 |
| T. Rowe Price ( TROW ) |
| Financials |
| Cyclical |
| 31 |
| Chevron ( CVX ) |
| Energy |
| Sensitive |
| 32 |
| Dover ( DOV ) |
| Industrials |
| Sensitive |
| 33 |
| Emerson Electric ( EMR ) |
| Industrials |
| Sensitive |
| 34 |
| McDonald's ( MCD ) |
| Consumer Discretionary |
| Cyclical |
| 35 |
| S&P Global ( SPGI ) |
| Financials |
| Cyclical |
| 36 |
| PPG Industries ( PPG ) |
| Materials |
| Cyclical |
| 37 |
| Exxon Mobil ( XOM ) |
| Energy |
| Sensitive |
| 38 |
| 3M ( MMM ) |
| Industrials |
| Sensitive |
| 39 |
| Clorox ( CLX ) |
| Consumer Staples |
| Defensive |
| 40 |
| Abbott Laboratories ( ABT ) |
| Health Care |
| Defensive |
| 41 |
| Church & Dwight ( CHD ) |
| Consumer Staples |
| Defensive |
| 42 |
| A. O. Smith ( AOS ) |
| Industrials |
| Sensitive |
| 43 |
| J. M. Smucker ( SJM ) |
| Consumer Staples |
| Defensive |
| 44 |
| Archer-Daniels-Midland ( ADM ) |
| Consumer Staples |
| Defensive |
| 45 |
| Consolidated Edison ( ED ) |
| Utilities |
| Defensive |
| 46 |
| Cardinal Health ( CAH ) |
| Health Care |
| Defensive |
| 47 |
| Realty Income ( O ) |
| Real Estate |
| Cyclical |
| 48 |
| Expeditors International of Washington ( EXPD ) |
| Industrials |
| Sensitive |
| 49 |
| Nordson ( NDSN ) |
| Industrials |
| Sensitive |
| 50 |
| Genuine Parts ( GPC ) |
| Consumer Discretionary |
| Cyclical |
| 51 |
| Sysco ( SYY ) |
| Consumer Staples |
| Defensive |
MDT, ECL, ITW, EMR, MMM, and ABT were rated Excellent last time, and their drop to the Fine rating is primarily due to the scoring changes of Quality Snapshots .
The most significant drops in rankings are ABT (25 spots), MMM (22 spots), and EMR (20 spots).
Stocks promoted from Decent to Fine are AFL, SPGI, CAH, O, SYY, AOS, and GPC.
The biggest jumps in rankings are AOS (16 spots), AFL (15 spots), and SPGI (15 spots).
Dividend Aristocrats rated Decent
The following table contains lower-quality stocks with quality scores of 16-20.
Author Spreadsheet (Data sources: Portfolio Insight, Simply Safe Dividends, S&P Global, Value Line, and Morningstar)
| Rank |
| Company (Ticker) |
| Sector |
| Supersector |
| 52 |
| Albemarle ( ALB ) |
| Materials |
| Cyclical |
| 53 |
| West Pharmaceutical Services ( WST ) |
| Health Care |
| Defensive |
| 54 |
| Essex Property ( ESS ) |
| Real Estate |
| Cyclical |
| 55 |
| Target ( TGT ) |
| Consumer Discretionary |
| Cyclical |
| 56 |
| Franklin Resources ( BEN ) |
| Financials |
| Cyclical |
| 57 |
| International Business Machines ( IBM ) |
| Information Technology |
| Sensitive |
| 58 |
| C.H. Robinson Worldwide ( CHRW ) |
| Industrials |
| Sensitive |
| 59 |
| Nucor ( NUE ) |
| Materials |
| Cyclical |
| 60 |
| Walgreens Boots Alliance ( WBA ) |
| Consumer Staples |
| Defensive |
| 61 |
| AbbVie ( ABBV ) |
| Health Care |
| Defensive |
| 62 |
| Stanley Black & Decker ( SWK ) |
| Industrials |
| Sensitive |
| 63 |
| Pentair plc ( PNR ) |
| Industrials |
| Sensitive |
| 64 |
| Federal Realty Investment ( FRT ) |
| Real Estate |
| Cyclical |
| 65 |
| V.F. ( VFC ) |
| Consumer Discretionary |
| Cyclical |
| 66 |
| Cincinnati Financial ( CINF ) |
| Financials |
| Cyclical |
WST and SWK were demoted from Fine to Decent , dropping 17 and 20 spots, respectively.
FRT and CINF were promoted from Poor to Decent , with FRT retaining its #64 rank and CINF dropping three spots to #66. The reason is there is only one Dividend Aristocrat rated Poor this time.
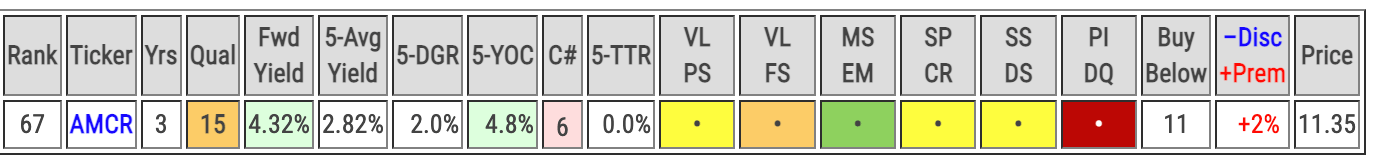
Dividend Aristocrats rated Poor
The last table contains the lowest-quality Dividend Aristocrats (only one this time) and stocks I consider speculative-grade stocks.
Author Spreadsheet (Data sources: Portfolio Insight, Simply Safe Dividends, S&P Global, Value Line, and Morningstar)
| Rank |
| Company (Ticker) |
| Sector |
| Supersector |
| 67 |
| Amcor plc ( AMCR ) |
| Materials |
| Cyclical |
AMCR was ranked above CINF and FRT last time but has a failing Dividend Quality Grade .
The following is a visual representation of the quality scores of the Dividend Aristocrats.
Created by the author (Data sources: Portfolio Insight, Simply Safe Dividends, S&P Global, Value Line, and Morningstar)
Dividend Aristocrats: Top Opportunities
Let's now use some screens to isolate Dividend Aristocrats with compelling metrics and favorable valuations.
By compelling metrics , I mean stocks with superior growth and income outlooks and stocks offering safe dividends. Stocks with strong recent performance may have the momentum to propel future performance.
As for favorable valuations , I mean stocks trading below my risk-adjusted Buy Below prices and stocks with forward dividend yields that exceed their 5-year average dividend yields. In the tables above, these are the stocks with green cells in the Fwd Yield and Price columns.
Let's consider the top candidates in each compelling metrics category while ensuring they also are discounted (trading below my risk-adjusted Buy Below prices).
Best Total Return Prospects
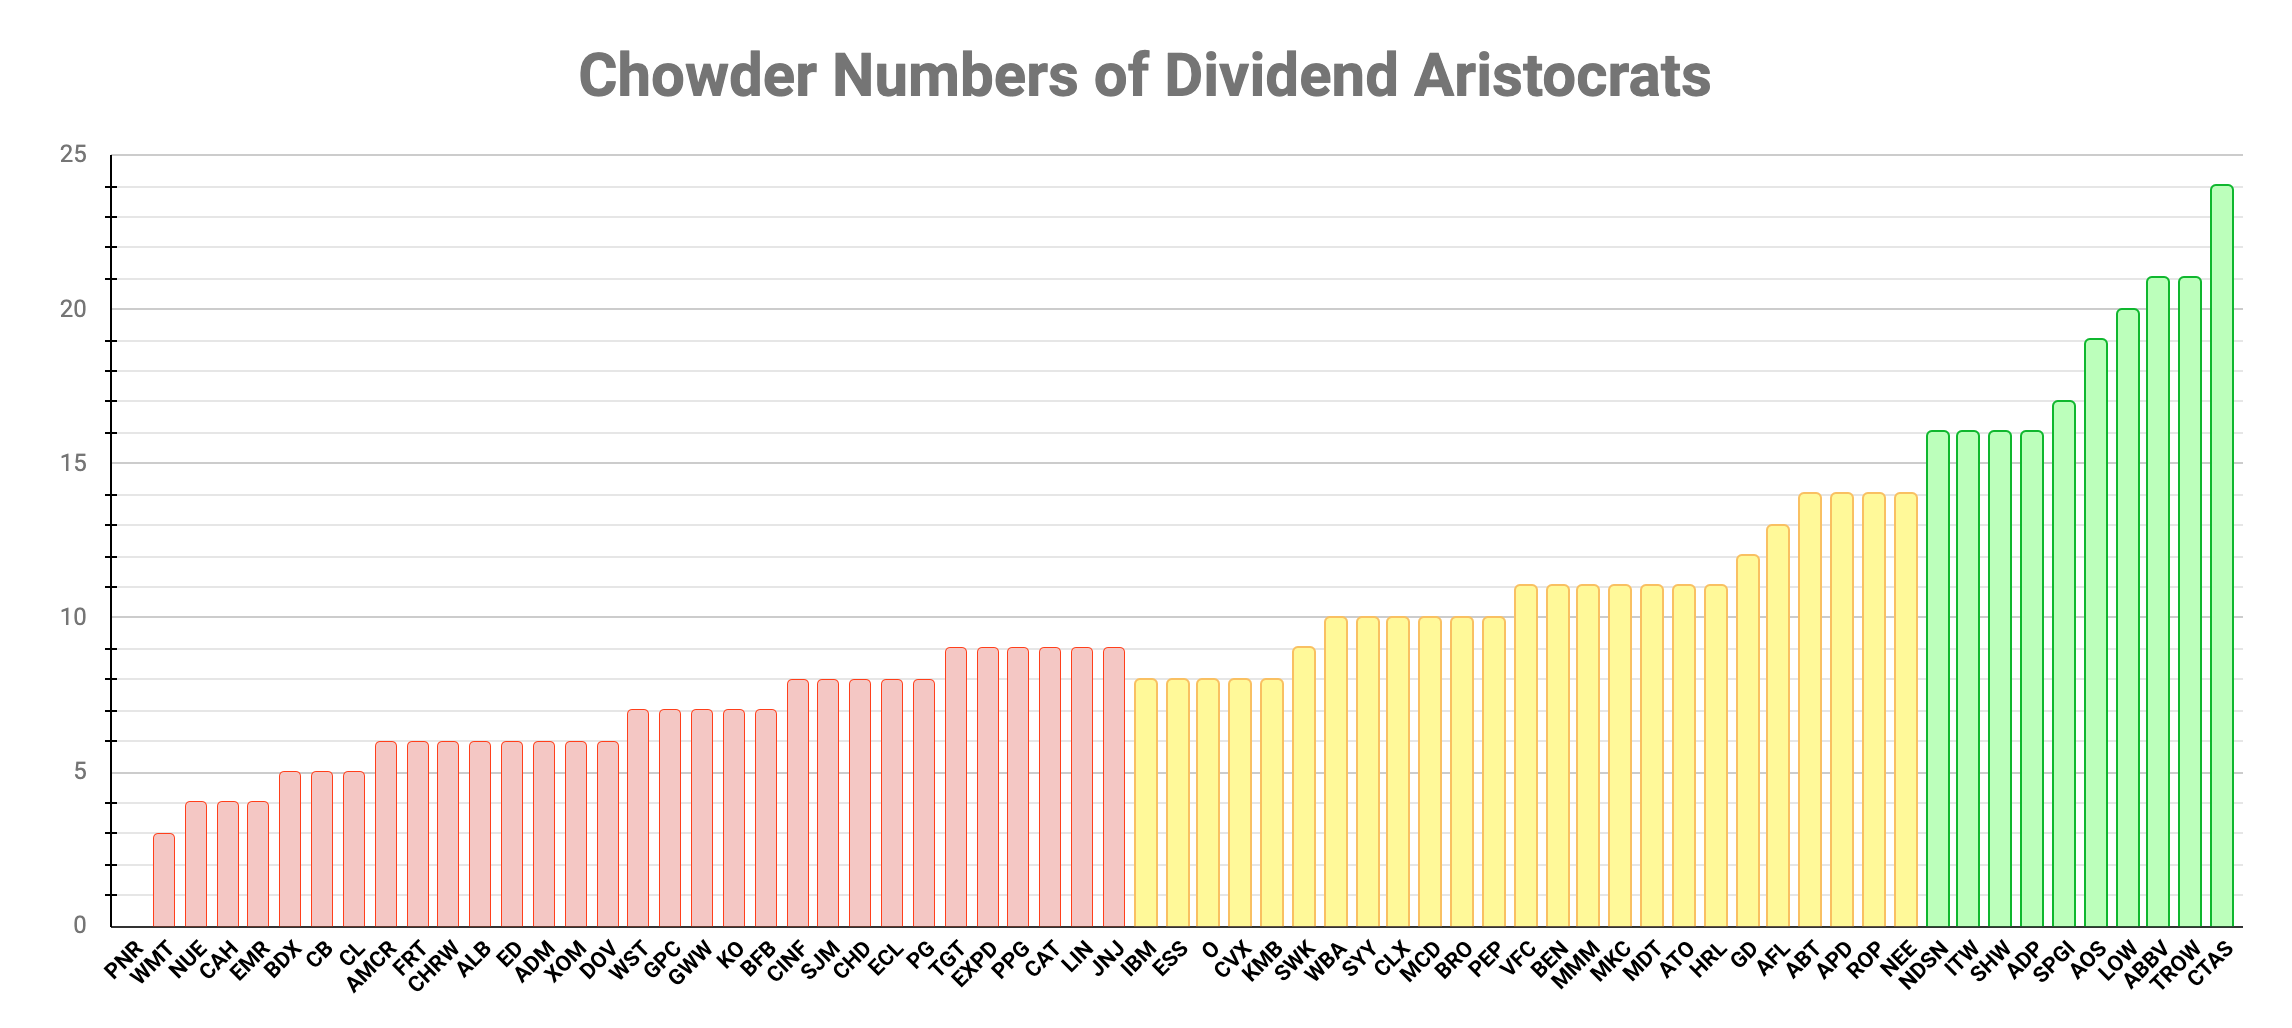
The Chowder Number is a popular metric for screening dividend growth stocks. It sums a stock's forward yield and 5-year DGR and measures the likelihood that it will deliver annualized total returns of at least 8%, according to the Chowder Rule .
Here are the Aristocrats sorted by their Chowder Numbers [C#]:
Created by the author (Data Source: Portfolio Insight )
Let's consider the top discounted Dividend Aristocrats by C# :
Author Spreadsheet (Data sources: Portfolio Insight, Simply Safe Dividends, S&P Global, Value Line, and Morningstar)
Cintas ( CTAS ) tops the list with a C# of 24.
High Chowder Numbers invariably are due to high 5-year dividend growth rates. When using the Chowder Number to predict total returns, it is essential to remember that future dividend increases may be more modest. For this reason, I also look at a stock's earnings growth rate and payout ratio to get a sense of how likely it is that a stock will continue to have generous dividend increases.
For example, here is an infographic showing the quality range fundamentals of CTAS relative to stocks in the Industrial sector, courtesy of Portfolio Insight. Quality ranges are calculated for all fundamental data and are used to derive Portfolio Insight's Dividend Quality Grade .
Portfolio Insight
Values in light blue cells are within the quality range of top-performing stocks in the Industrials sector, whereas values in dark blue cells outperform the respective quality ranges. Gray cells indicate underperformance .
CTAS measures very well against top-performing stocks in the Industrials sector, with a few exceptions. Notably, the stock's earnings growth rate is in the double-digit percentage range, and its payout ratio is low for most companies. (As an aside, CTAS changed the frequency of its dividend payments to a quarterly schedule, which explains the negative dividend growth rate in Q4-2021).
While CTAS is a great candidate for investors looking for strong total returns, it is one of the lower-yielding Dividend Aristocrats. Lowe's ( LOW ) and Automatic Data Processing ( ADP ) are higher-yielding alternatives, and LOW also offers excellent value, trading 16% below my buy-below price.
Best Income Prospects
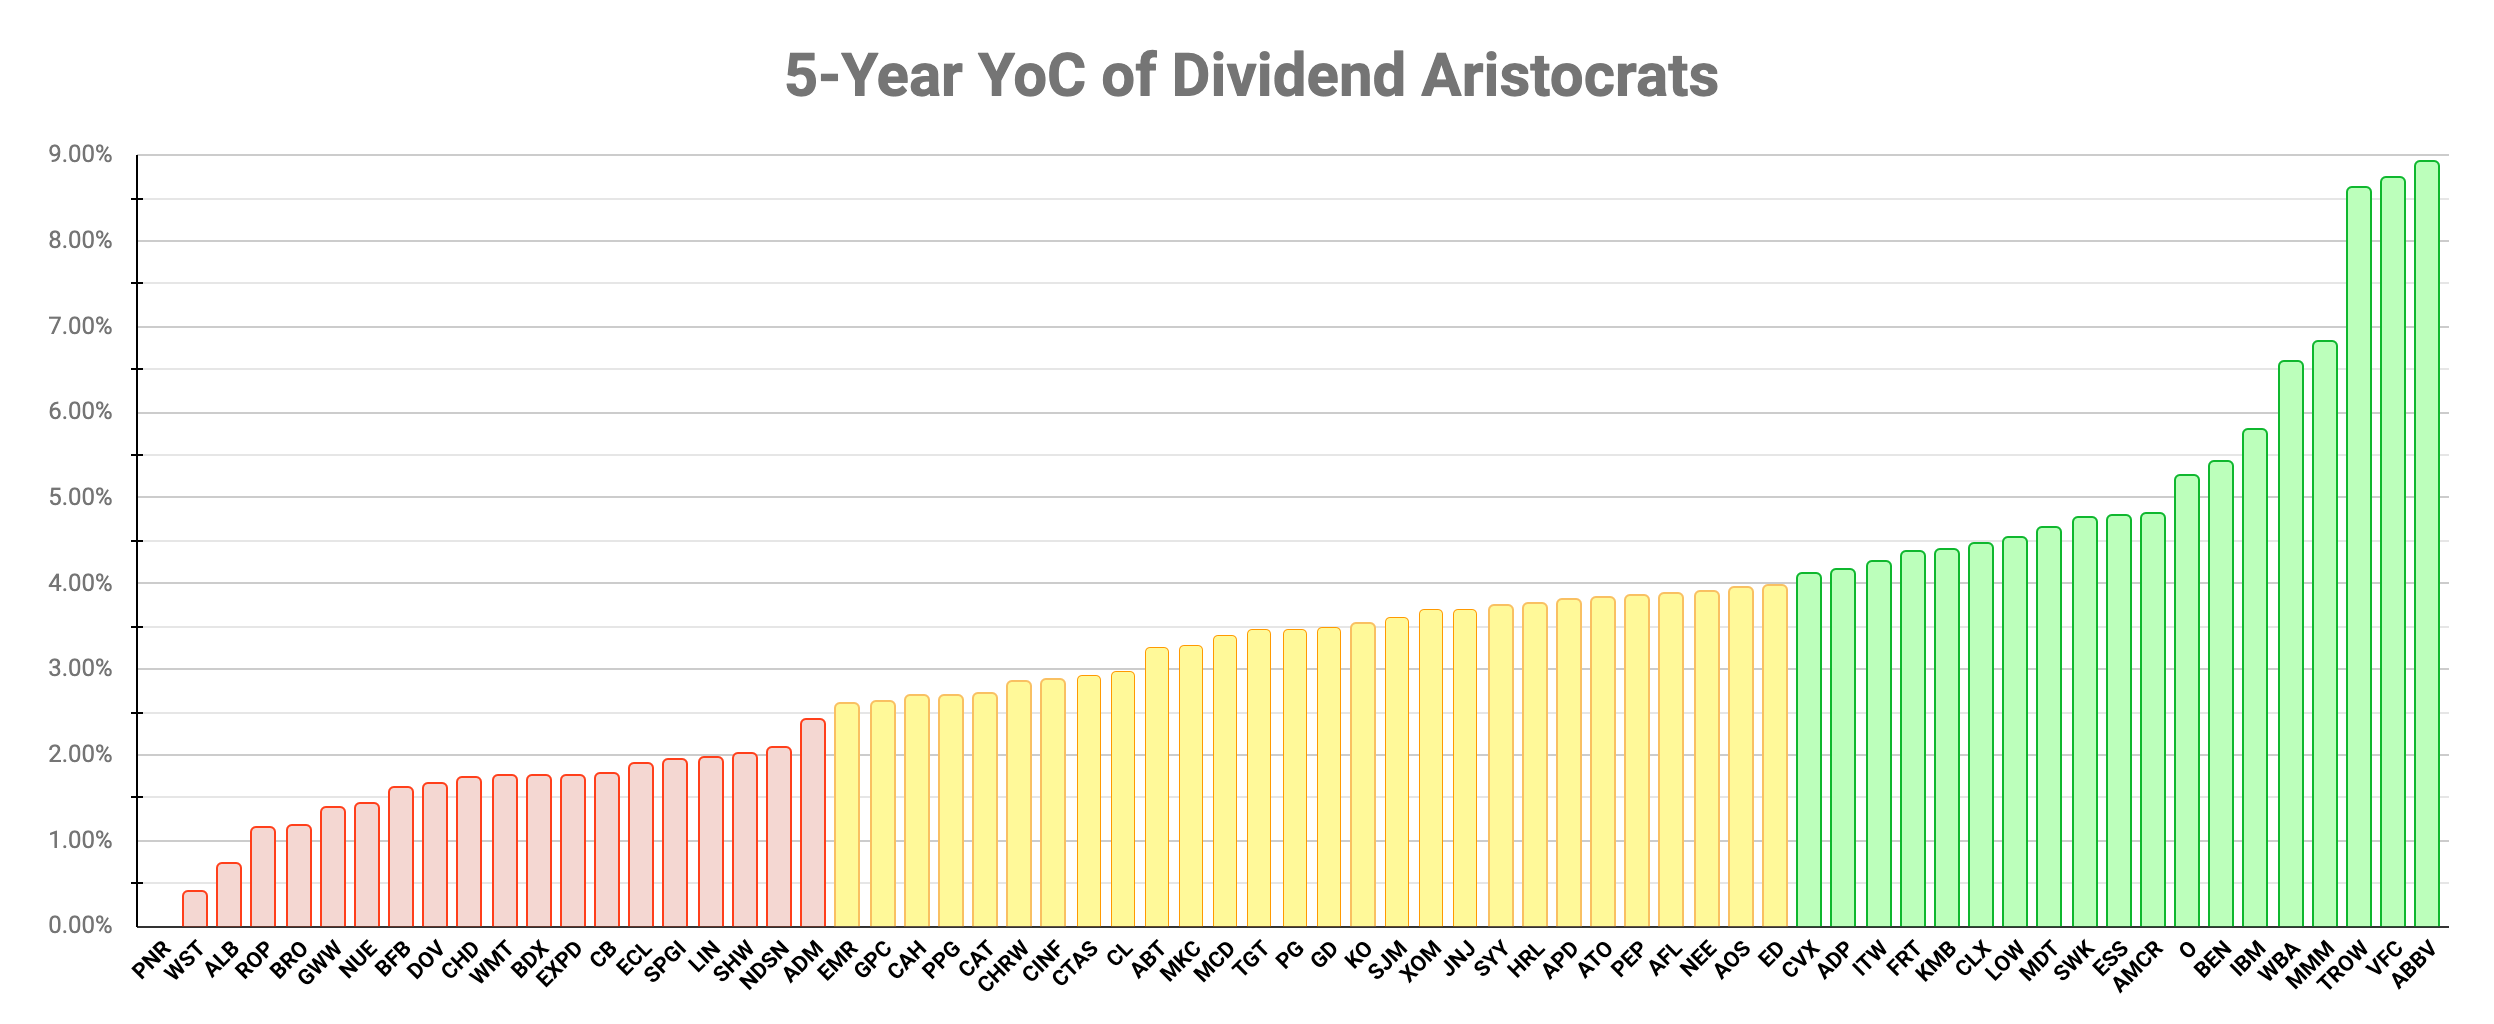
The 5-year Yield on Cost [YOC] is an income-oriented metric indicating your YOC after you buy a stock and hold it for five years, assuming the same 5-year DGR is maintained. I look for a 5-year YOC of at least 4.0%.
To calculate the 5-year yield on cost is easy:
5-YOC = Fwd Yield × (1 + 5-DGR ) 5
This metric is another way of combining a stock's forward yield and 5-year DGR, so the same caveat applies: remember that future dividend increases may be more modest.
Here are the Dividend Aristocrats sorted by the 5-year yield on cost metric:
Created by the author (Data Source: Portfolio Insight)
Let's consider the top discounted Dividend Aristocrats by 5-YOC :
Author Spreadsheet (Data sources: Portfolio Insight, Simply Safe Dividends, S&P Global, Value Line, and Morningstar)
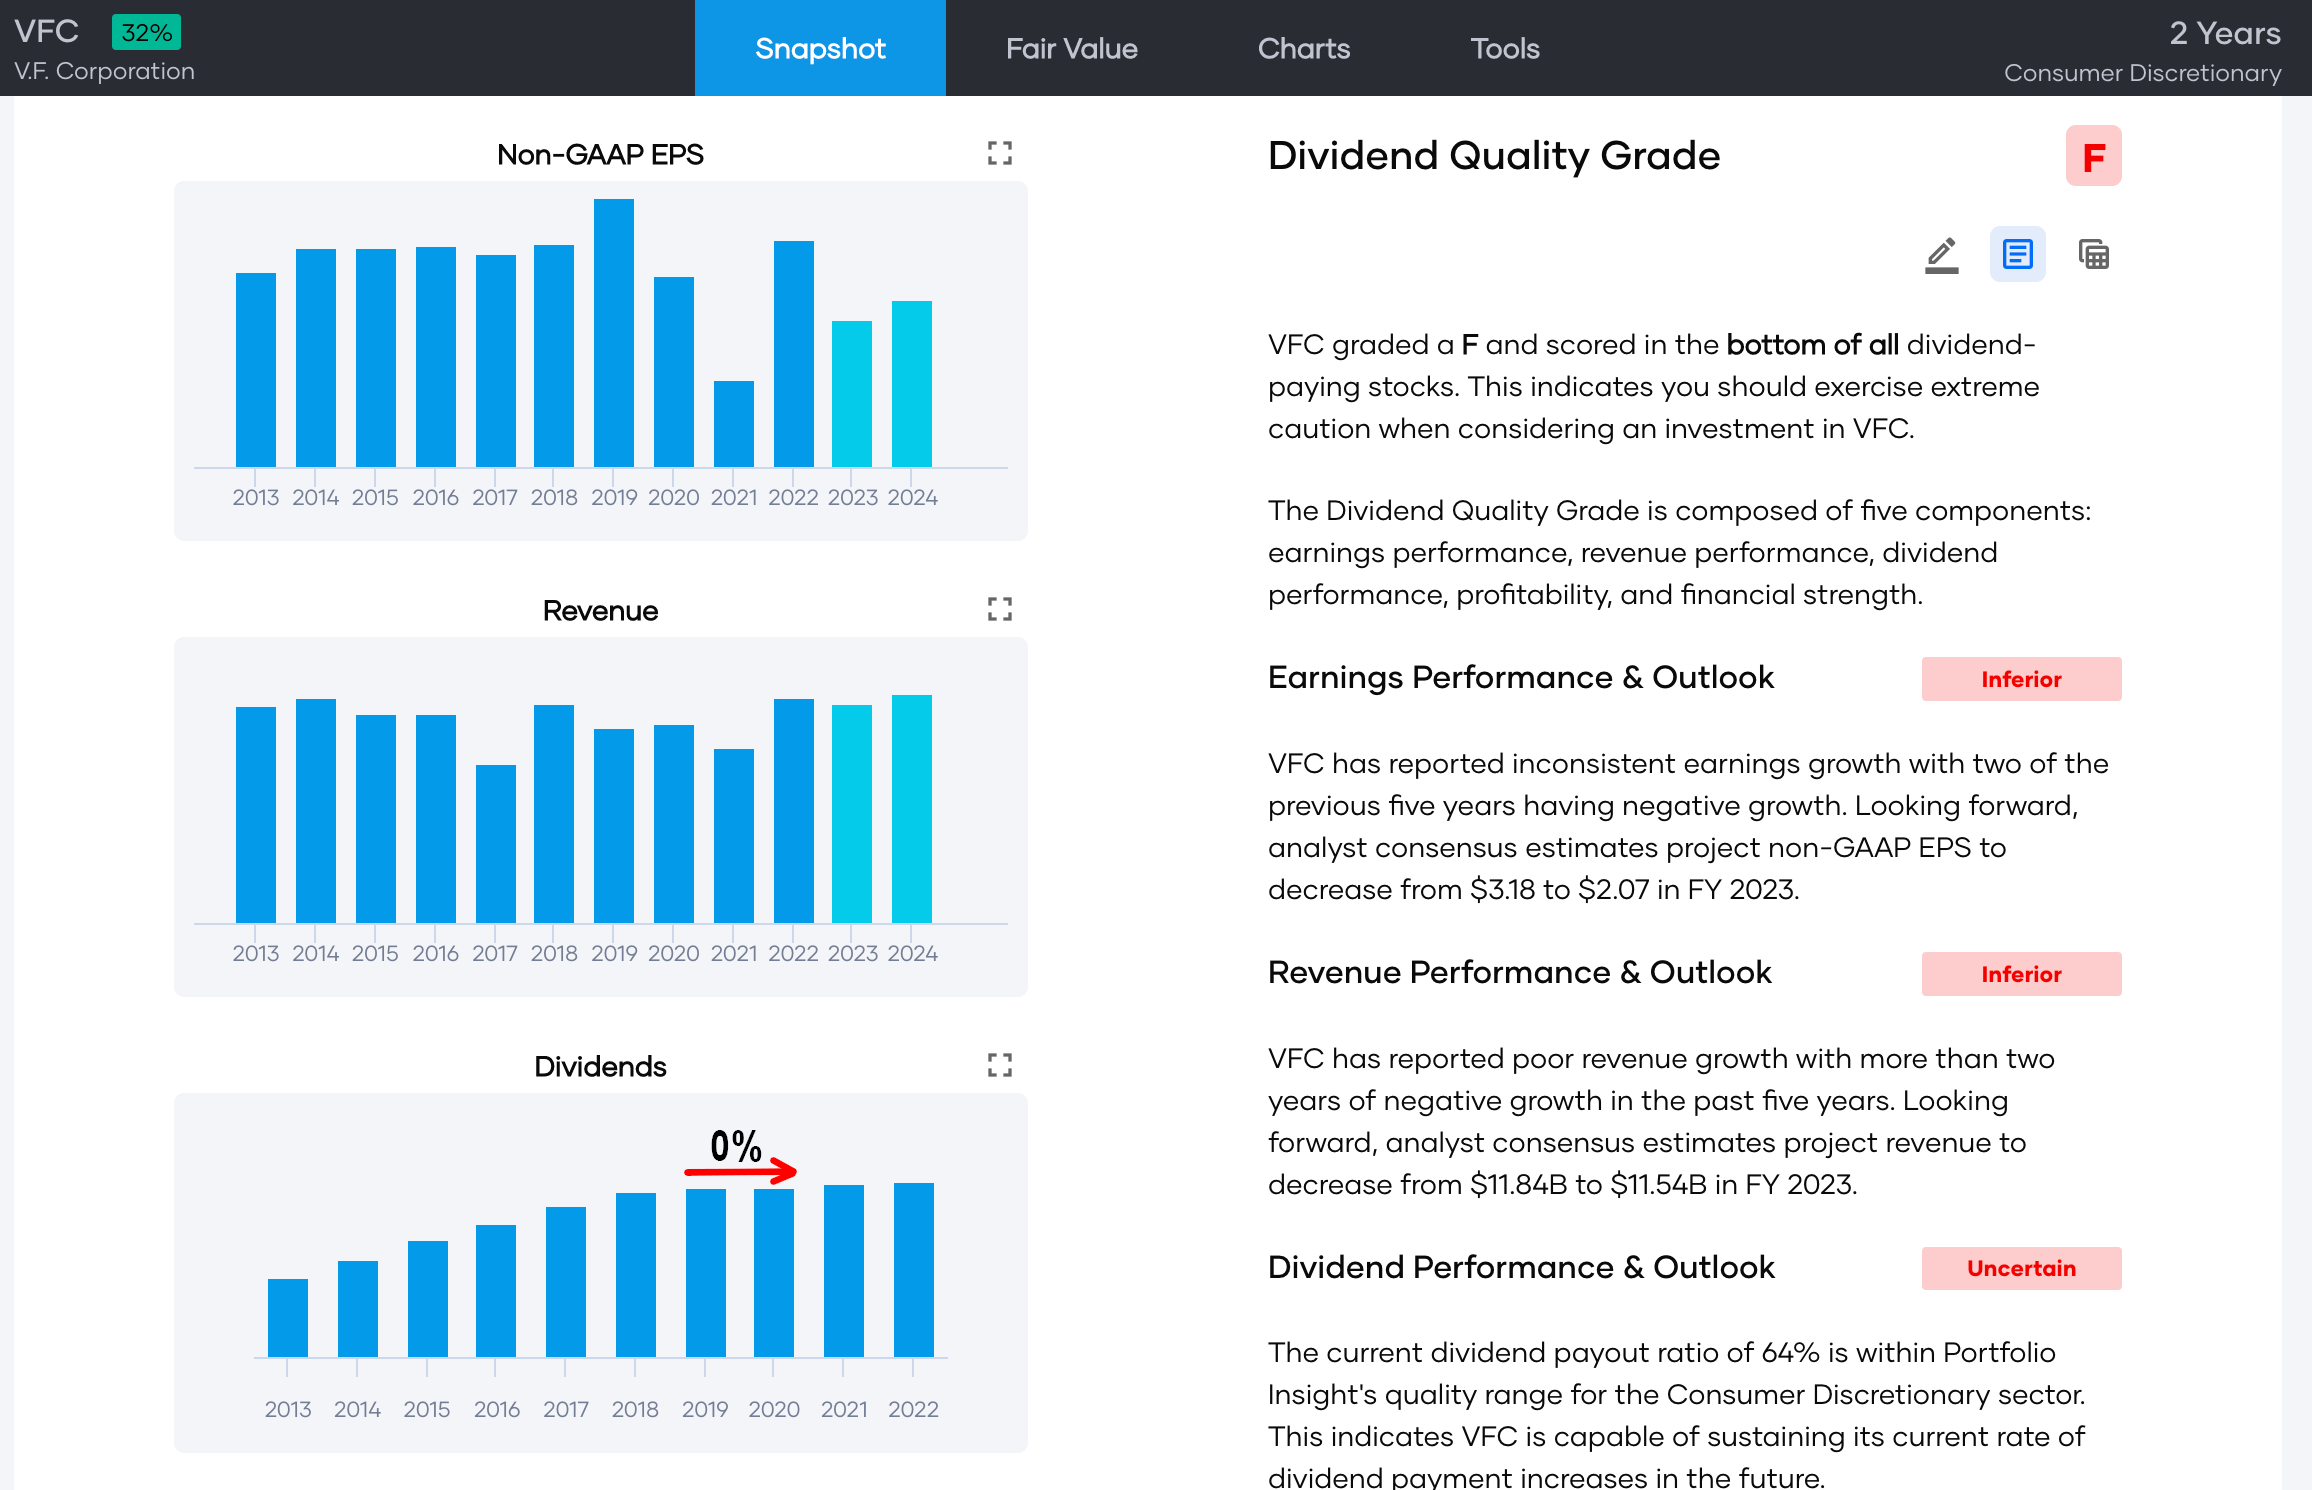
V.F. Corporation ( VFC ) tops the list with a 5-YOC of 8.7%. However, on 7 February 2023 ( after the annual rebalancing of the S&P 500 Dividend Aristocrats Index), VFC announced a dividend cut of 41% . VFC's membership as a Dividend Aristocrat likely will be revoked soon.
Note Portfolio Insight's failing Dividend Quality Grade for VFC, based on a dividend freeze in 2020, and inferior earnings and revenue performances and outlooks:
T. Rowe Price ( TROW) is next on the list with a 5-YOC of 8.6%, mainly thanks to a high forward yield and a high 5-year DGR. But it is unlikely that TROW will maintain a DGR of 17% for five years. In fact, TROW just announced a token dividend increase of 1.7% , far below past increases:
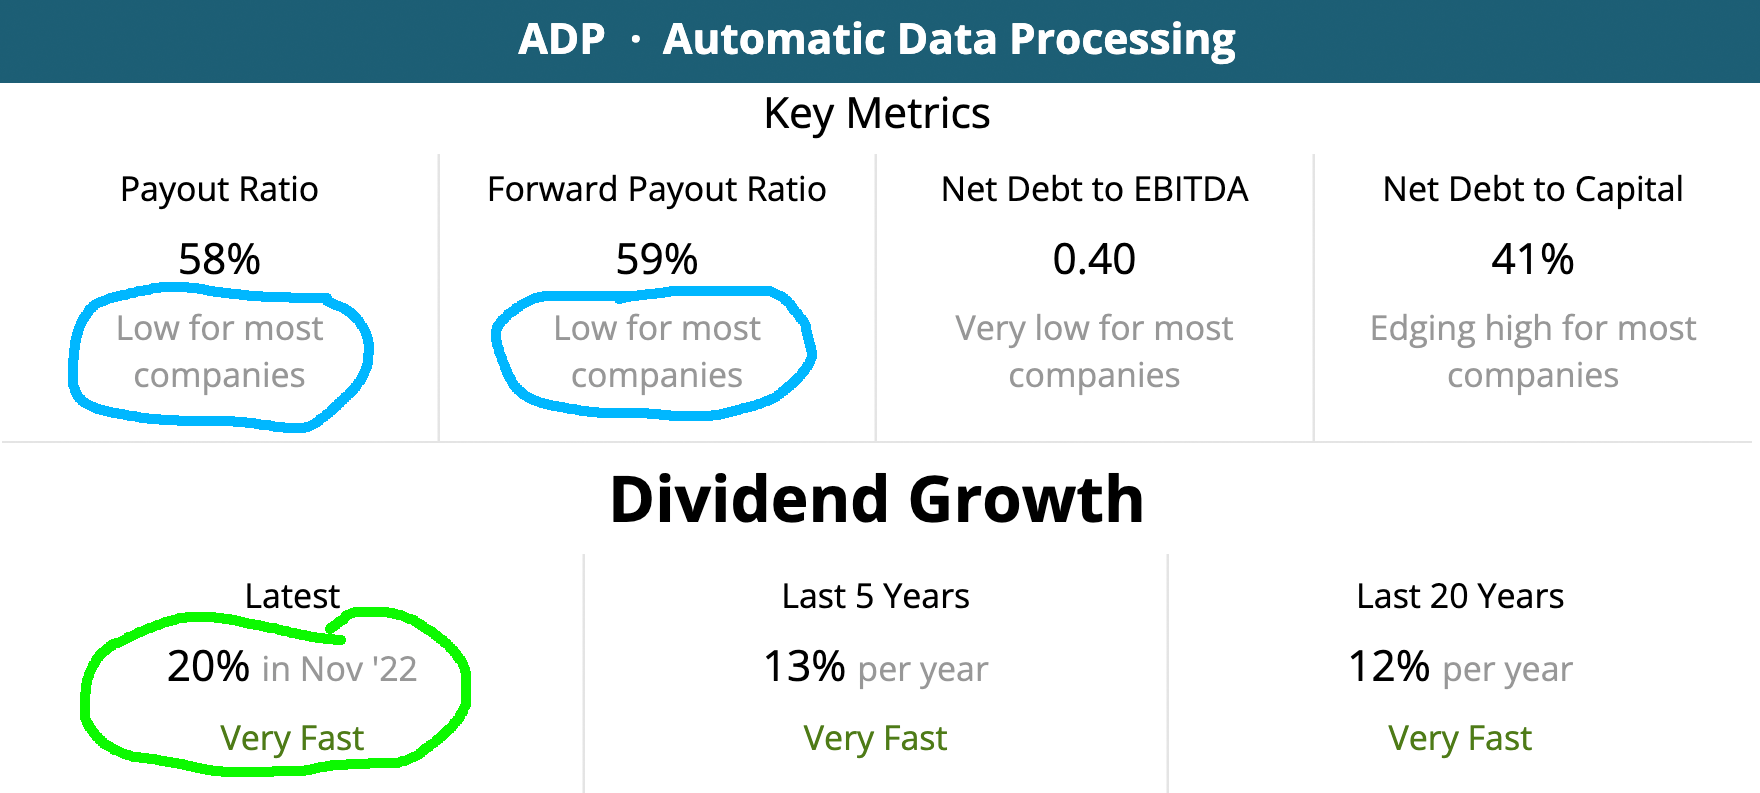
Further down the list, LOW and ADP again catch my eye, with LOW perhaps the preferred choice due to its much lower payout ratio:
Simply Safe Dividends Simply Safe Dividends
Safest Stocks
I strongly favor DG stocks deemed Very Safe by Simply Safe Dividends. Nobody likes seeing a dividend cut or suspension soon after investing in a DG stock, so targeting the safest candidates is a good strategy.
Using the Dividend Quality Grade adds another dimension. In assigning the grade, Portfolio Insight considers all dividend-paying stocks and determines the likelihood of a dividend increase in the following 12-month period. Backtesting the system, they found the Dividend Quality Grade accurately predicted a failure to continue dividend increases in more than 98% of cases.
The following discounted stocks have Very Safe Dividend Safety Scores and A+ Dividend Quality Grades :
Author Spreadsheet (Data sources: Portfolio Insight, Simply Safe Dividends, S&P Global, Value Line, and Morningstar)
Procter & Gamble ( PG ) tops the list and is one of only three Dividend Aristocrats rated Exceptional .
It replaced JNJ as the #1 ranked stock in Dividend Radar . The stock's forward dividend yield exceeds its 5-year average dividend yield by about 8%, confirming that PG is undervalued.
CTAS and LOW make a repeat appearance, and it is good to see stocks with great total return and income prospects that also offer very safe dividends!
I want to highlight two Utilities sector stocks here that missed the cut with earlier screens, NextEra Energy ( NEE ) and Atmos Energy ( ATO ). The stocks compare well, with ATO offering a higher yield and NEE a higher dividend growth rate. NEE is ranked slightly higher and has outperformed ATO over the past five years. Both stocks are trading about 10% below my Buy Below price.
Following are non-GAAP EPS and dividend growth charts of NEE and ATO, with stock price overlays:
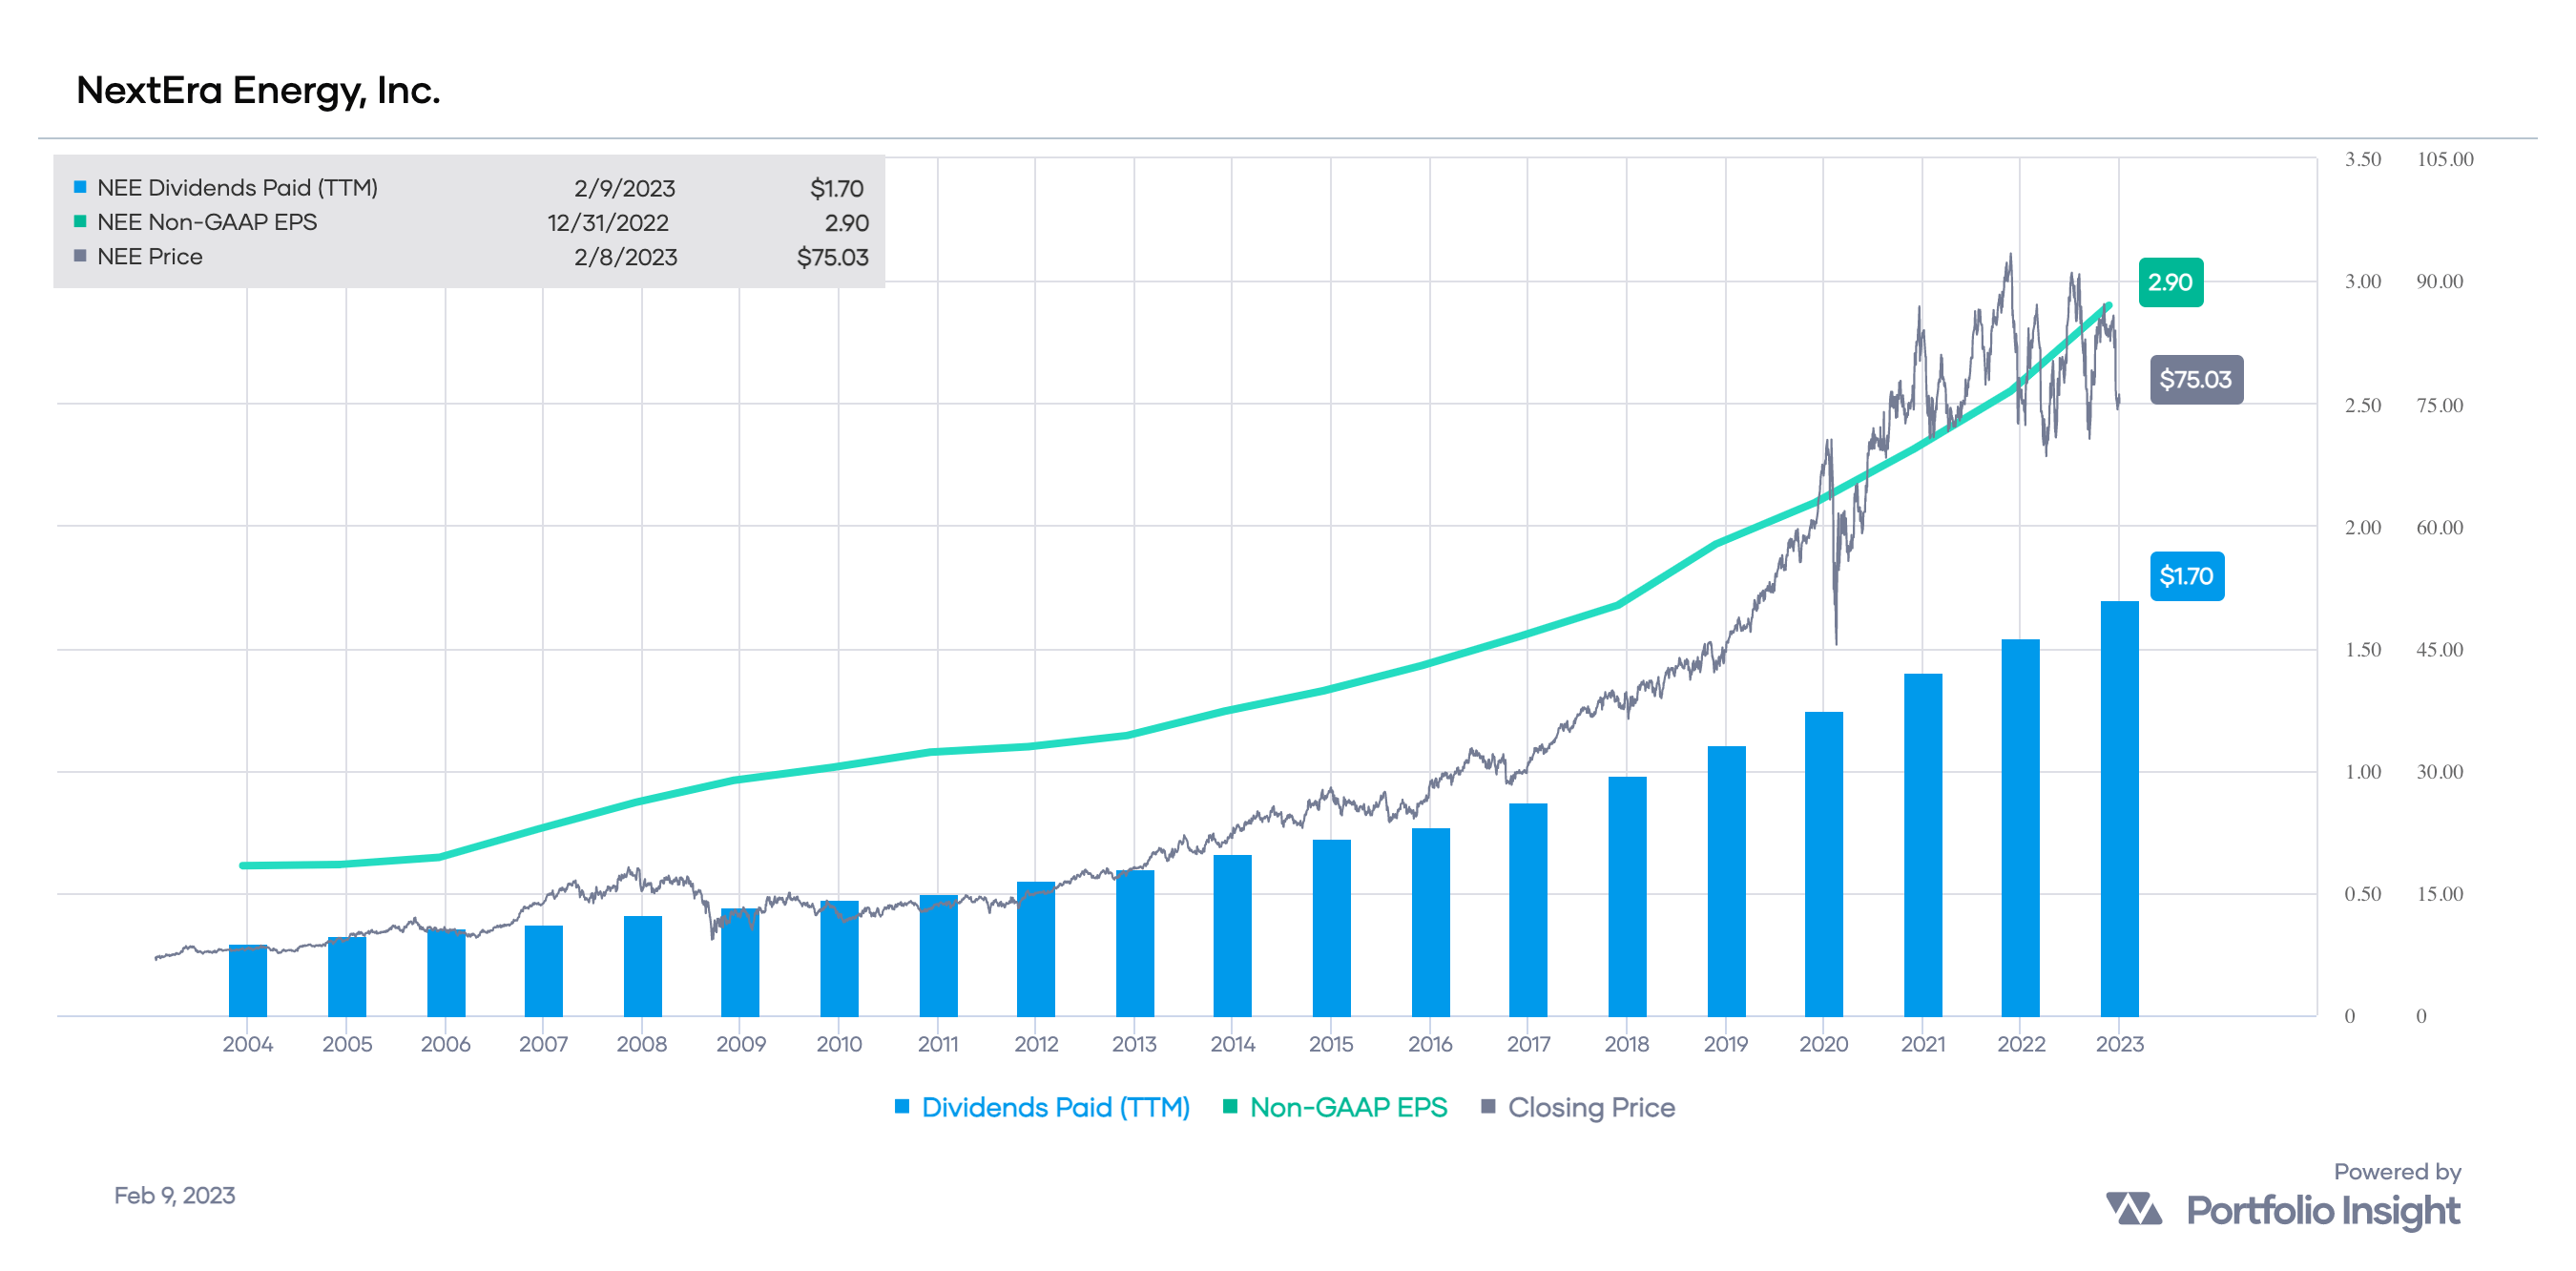
NEE's non-GAAP EPS payout ratio is 59%, compared with ATO's at 53%. These are low for Utilities sector stocks, confirming that NEE and ATO have very safe dividends.
Highest Total Trailing Returns
While it remains true that past performance is no guarantee of future results , I like to consider the 5-year TTR of candidates. There's something to be said for momentum, especially for stable, blue-chip dividend growth companies.
Here are the Dividend Aristocrats sorted by the 5-year trailing total returns:
Created by the author (Data Source: Portfolio Insight)
Let's look at the top discounted Dividend Aristocrats by 5-TTR , namely those with 5-year TTRs of at least 10%:
Author Spreadsheet (Data sources: Portfolio Insight, Simply Safe Dividends, S&P Global, Value Line, and Morningstar)
CTAS tops the list, which is not a big surprise given that CTAS has the highest 5-year DGR of all the Dividend Aristocrats.
What is surprising is that no stock yielding more than 3% makes the list. The only Dividend Aristocrats yielding more than 3% and with 5-year TTRs greater than 10%are Chevron ( CVX ) and Exxon Mobil ( XOM ), which trade at premium valuations.
Let's compare the performance of CTAS to that of the S&P 500, as represented by SPDR S&P 500 Trust ETF (SPY):
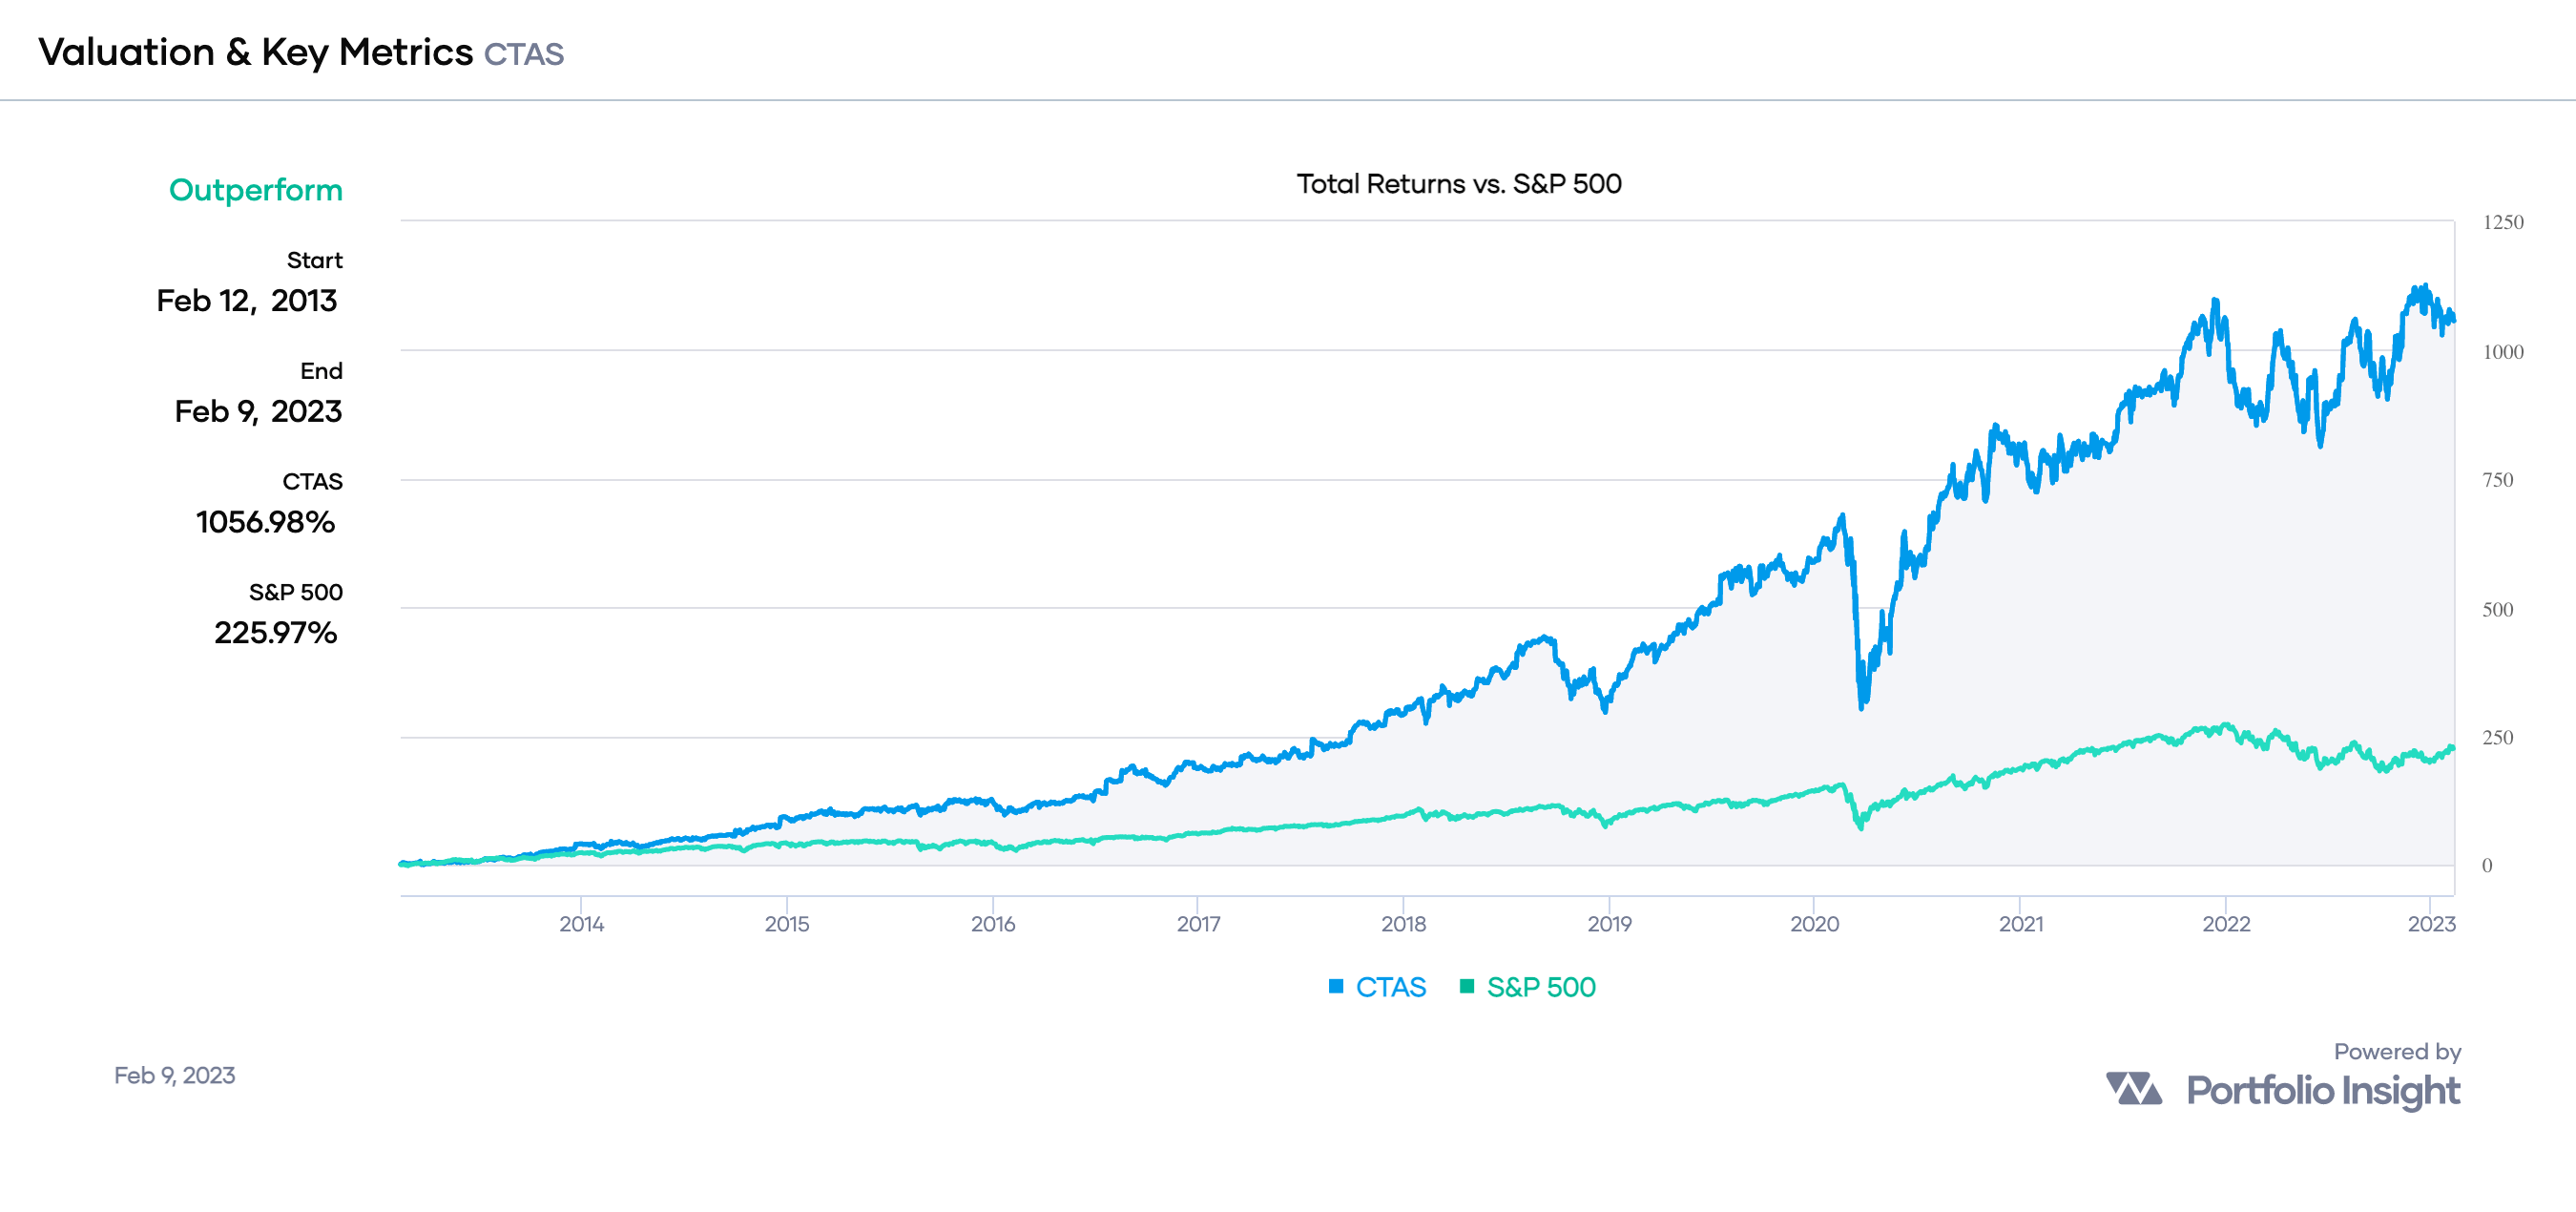
Over the past decade, CTAS has delivered total returns of 1,057% versus 226% by SPY, a margin of 4.68-to-1! That's a significant outperformance!
I should note that NEE , LOW , and ADP , all mentioned previously, also made the list of top performers over the past five years.
Stocks Discounted Most
When a stock is discounted, early investors will benefit when the market finally recognizes the stock's actual value. So it is worthwhile to consider the highest discounts among the Dividend Aristocrats.
Here are the Dividend Kings sorted by their discount to my risk-adjusted Buy Below price:
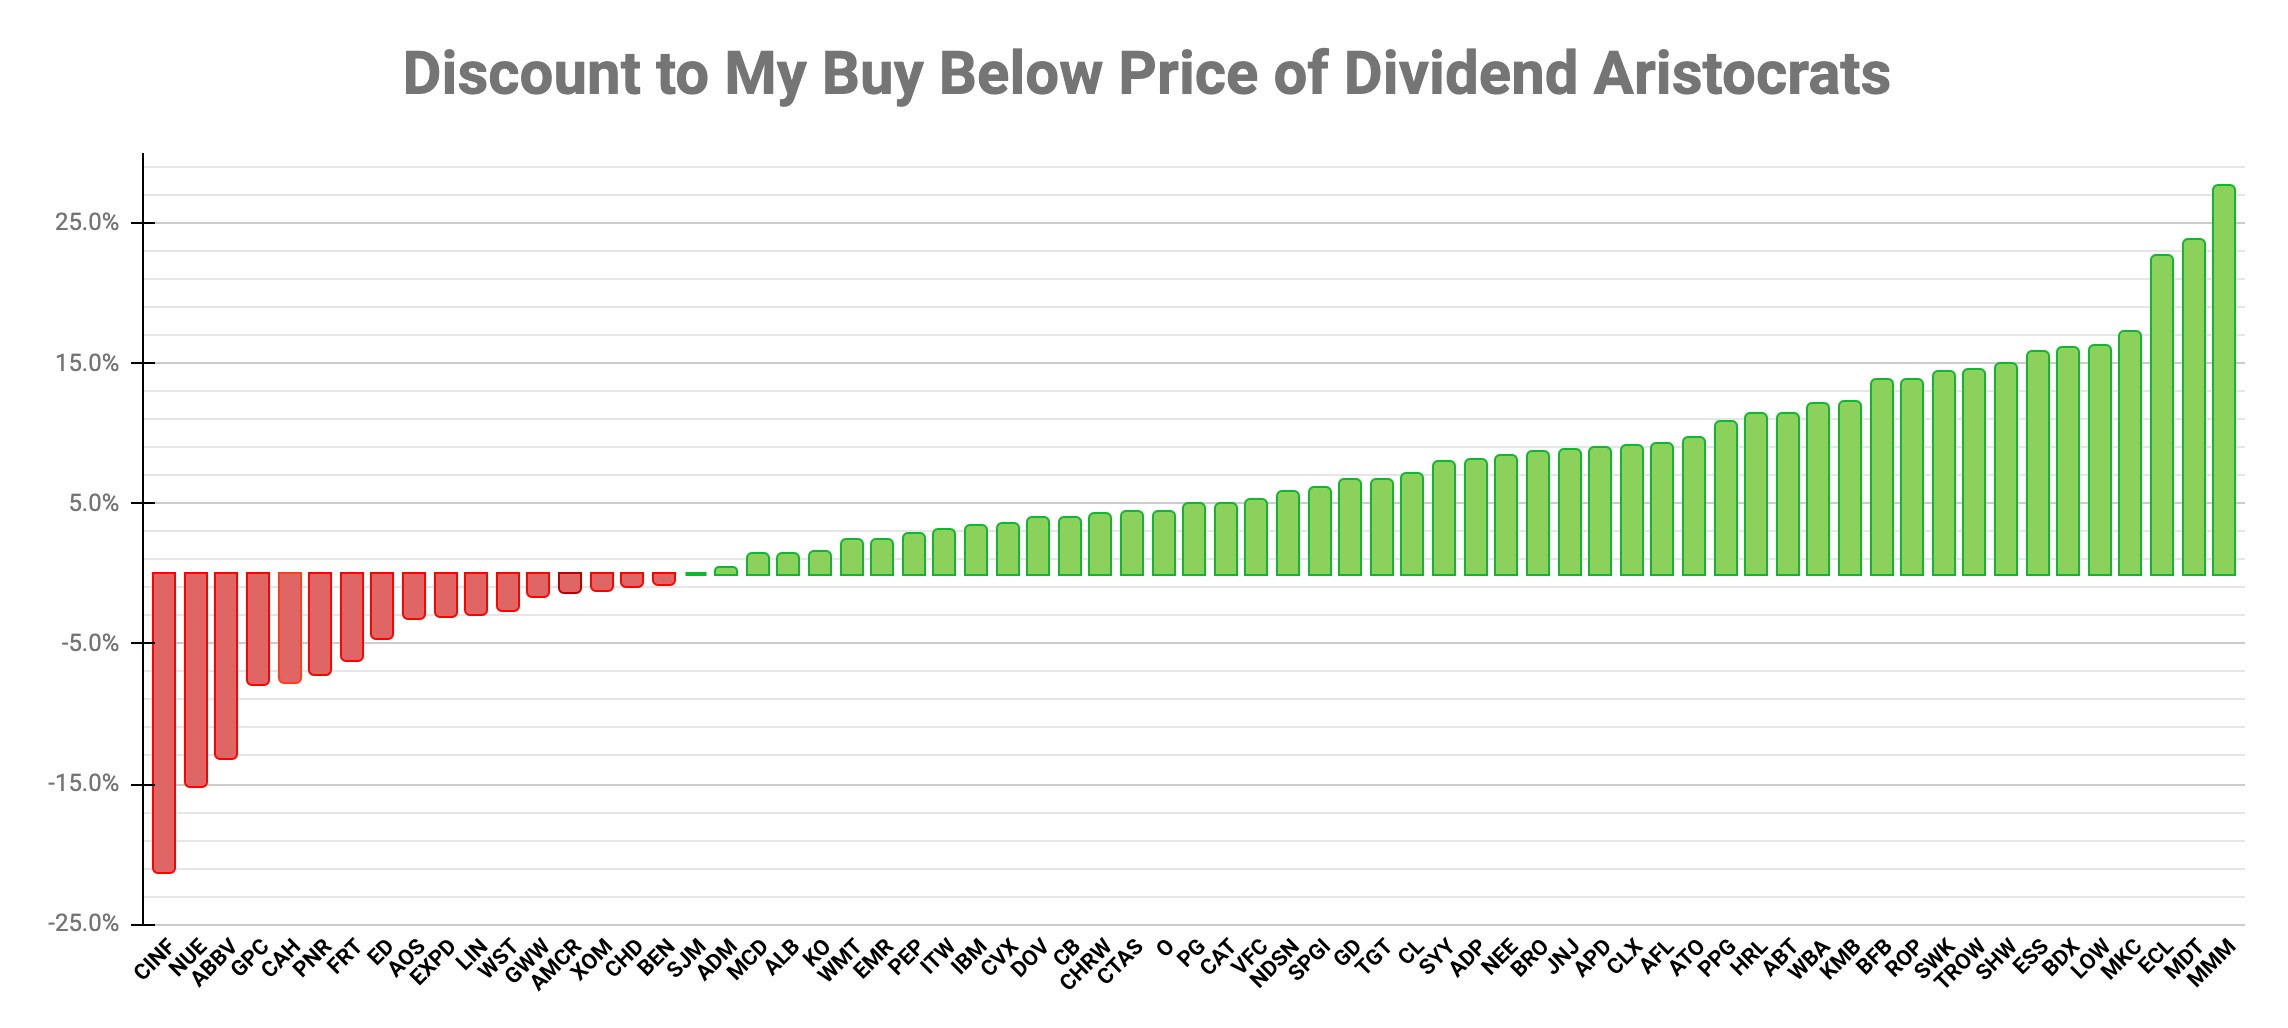
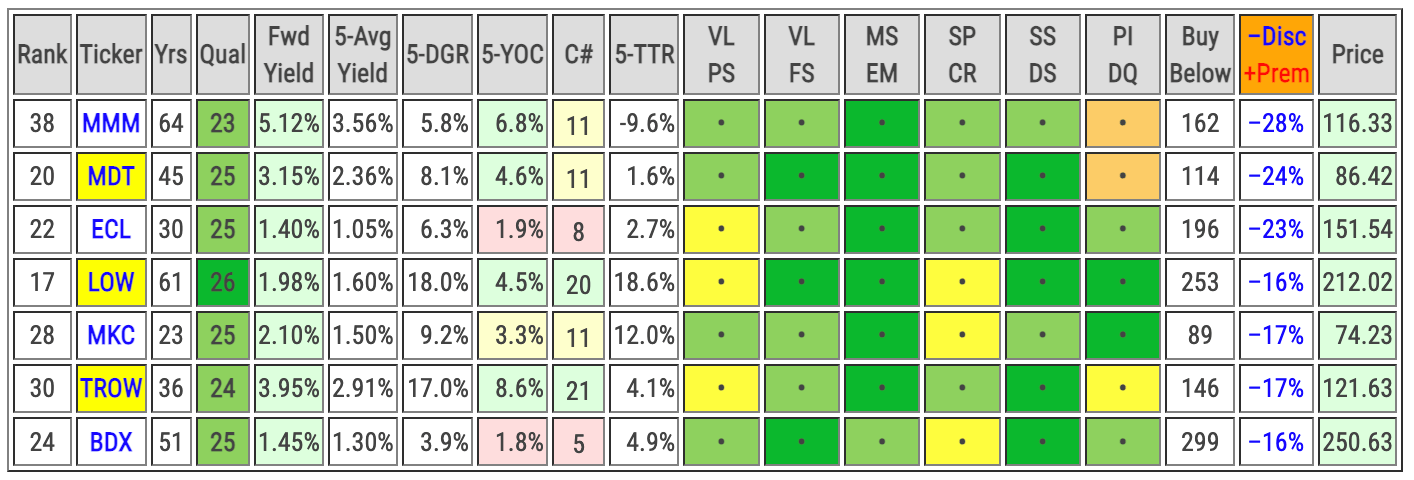
Let's consider the top seven Dividend Aristocrats by discount to my Buy Below price:
Author Spreadsheet (Data sources: Portfolio Insight, Simply Safe Dividends, S&P Global, Value Line, and Morningstar)
Stocks available at deep discounts need particular scrutiny as there may be good reasons for their under-valuations. This is particularly true for stocks with poor historical performance, such as 3M ( MMM ) with its negative 5-year TTR and even Medtronic ( MDT ) and Ecolab ( ECL ) with their low 5-year TTRs.
Of the discounted stocks, I think LOW presents the best opportunity.
In the following valuation chart, LOW's share price is well under the Undervalue Price (green line) in both charts. Furthermore, LOW's forward yield of 1.98% exceeds the 5-year average dividend yield by 24%, indicating that LOW is trading at a discount relative to its dividend yield history.
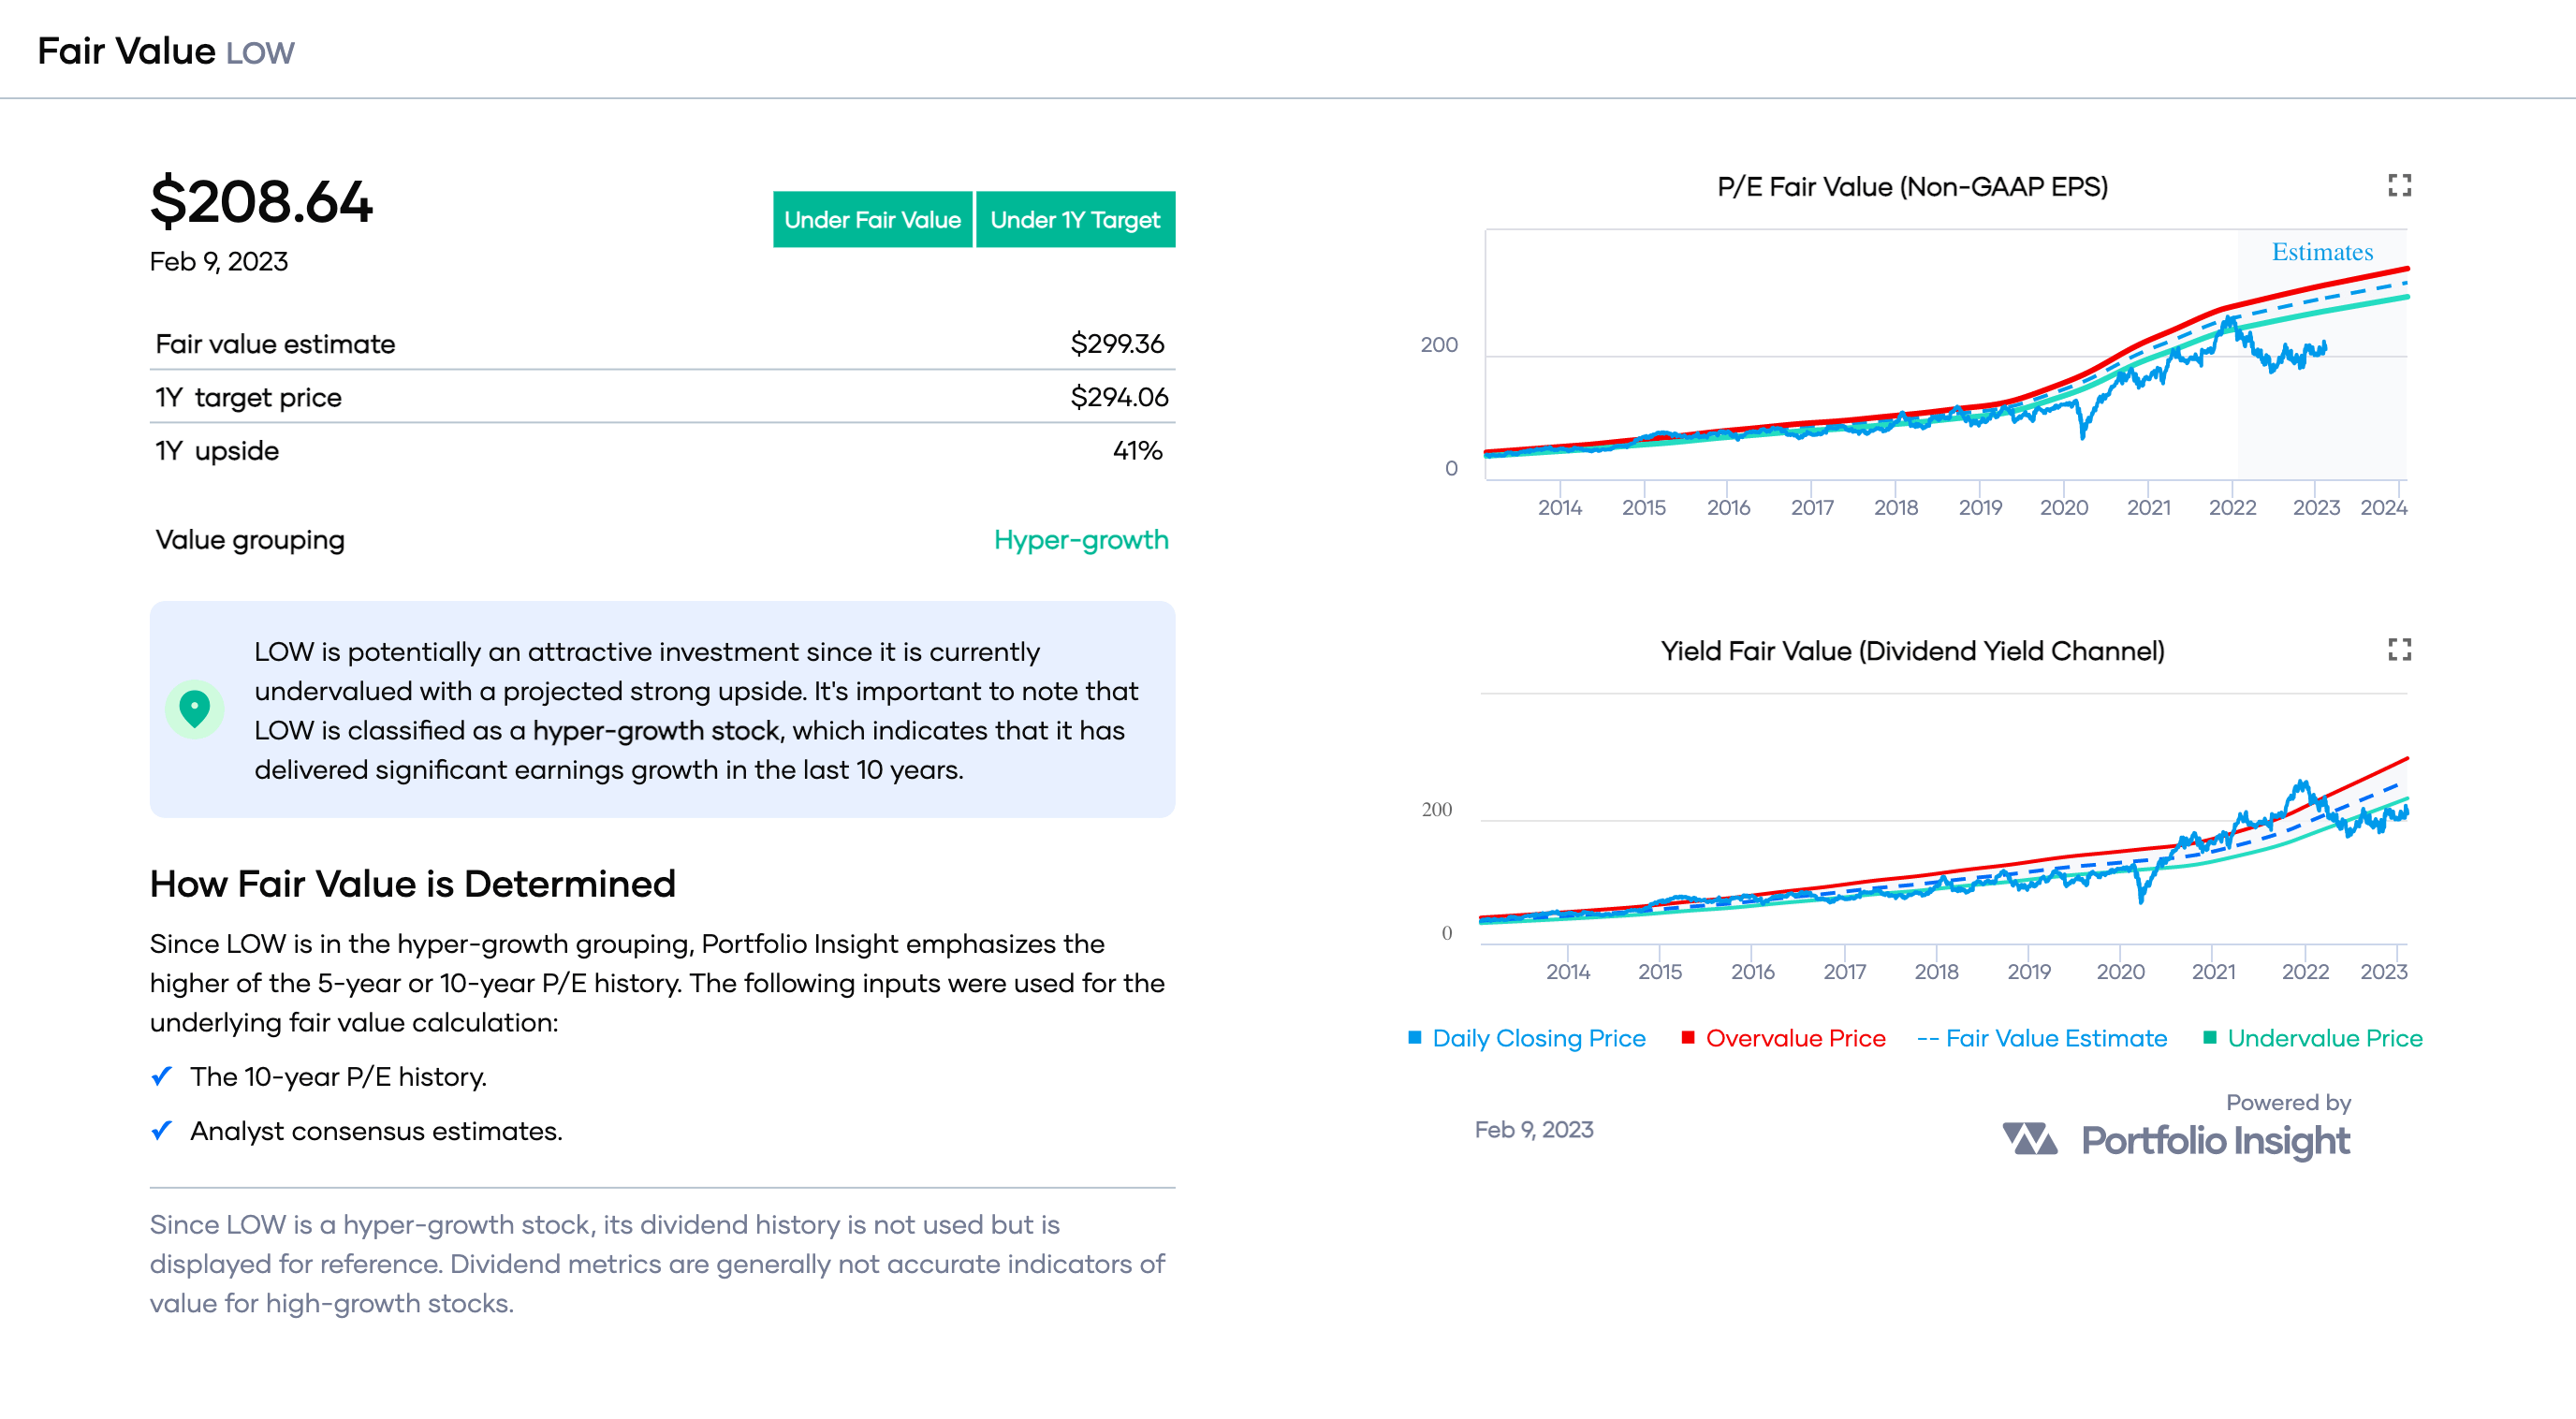
Concluding Remarks
In this article, I used the scoring system of Quality Snapshots to rank the 67 Dividend Aristocrats. The version of Quality Snapshots I used employs six quality indicators worth 5 points, each for a maximum quality score of 30 points.
Of the 67 Dividend Aristocrats covered in this article:
- All but one have Investment Grade ratings based on their quality scores of 16-30,
- 50 stocks are trading below my risk-adjusted Buy Below prices, and
- 51 stocks have quality scores in the 21-30 range, truly high-quality stocks!
I've highlighted a few discounted stocks offering compelling metrics. By compelling metrics , I mean stocks with superior growth and income outlooks and stocks with safe dividends.
Here are some candidates to consider depending on your investment style:
- For total return: CTAS , LOW , and ADP
- For income: TROW , LOW , and ADP
- For safety: PG , CTAS , LOW , NEE , and ATO
- For growth: CTAS , NEE , LOW , and ADP
- For value: LOW
I hope this article provided readers with some good candidates to consider! As always, I encourage you to do your due diligence before investing.
I'm providing a downloadable spreadsheet of the Dividend Aristocrats. The spreadsheet includes the data presented in this article and data available to Portfolio Insight subscribers. I hope readers will find this snapshot of fundamental and added value metrics helpful in analyzing the Dividend Aristocrats.
Note that I cannot grant permission for you to edit the spreadsheet, as it is a read-only file that every Seeking Alpha reader can access!
But you can create a copy of the spreadsheet to edit: Click on this link to the Dividend Aristocrats spreadsheet . To copy the spreadsheet, sign in with a Google account and select File | Make a Copy to save your copy of the spreadsheet on your computer.
Thanks for reading, and happy investing!
For further details see:
The Dividend Aristocrats Ranked By Quality Scores