PEP - The Dividend Pyramid: Potentially Beat The Market With This 12-Stock Portfolio
Summary
- We start with a discussion of diversification theories based on the findings of a scientific article called "The Dividend Puzzle".
- While inexperienced investors should stick to ETFs, there's a clear case to be made for the behavioral approach, which is based on a mix of different dividend strategies.
- Based on these theories, I present a 12-stock dividend portfolio capable of beating the market with subdued volatility, a good dividend yield, and satisfying dividend growth.
Introduction
I was extremely excited to start writing this article after a very interesting paper attracted my attention the other day. Especially after I somewhat neglected the dividend crowd among my readers in the past few weeks, I'm happy to write another dividend-focused article. In this case, we'll discuss a number of things:
- What's diversification, and why does it matter?
- What's the perfect diversification, and how to achieve it?
- My unorthodox method to diversify my portfolio, which I think is market-beating and superior if investors stick to a few rules.
The last bullet point is backed by a 12-stock model portfolio, which is built on a model that investors can use to achieve long-term outperformance, dividend income, and protection against bear markets.
In other words, at the end of this article, I've hopefully given you some theories to use in your own portfolio management and some investment ideas to incorporate into your research process.
So, without further ado, let's get to it!
Diversification & The Pyramid
Diversification is important. Everyone knows that. Even investors who just started with little to no knowledge know that buying a small number of stocks comes with elevated risks.
It's one of the reasons why ETFs are so popular. With a single buy order, investors can buy a huge basket of stocks.
However, a lot of investors decide to go with single stocks. That's fine as long as investors have the knowledge to construct a portfolio that serves their needs. After all, when buying single stocks, investors need to outperform the market or benchmark that fits their strategy. Or, to put it differently, the risk/reward needs to be better.
That's where diversification comes in.
The other day, I was working my way through a pile of scientific papers I always wanted to read. One of them was written by Meir Statman in 2004 called The Diversification Puzzle .
Statman, who is a professor of finance at Santa Clara University, is focused on behavioral finance, a topic I'm quite fond of.
Although his article was written in 2004, there's a lot of valuable information we can still use in 2023. For example, he finds that the optimal level of diversification in equity portfolios, according to mean-variance portfolio theory, is over 300 stocks, but the average investor holds only three or four stocks.
While I believe that the average investor in 2023 holds more than four stocks, I cannot disagree with his assessment that investors are terrible at diversification - at least when it comes to starting investors.
I've often said that I get the feeling that people in the Seeking Alpha comment sections know what they are doing. There tends to be a rather high level of knowledge among readers. However, investors I encounter outside of this website are often in much worse shape. The other day, I saw that one investor had invested almost his entire portfolio in four stocks with an average yield of 16%. All of them are likely to give him negative total returns over the next ten years. Also, his investments were highly correlated.
In 2021, I saw that many bought just a handful of tech stocks. In 2022, these portfolios got killed.
The Mean-Variance Portfolio
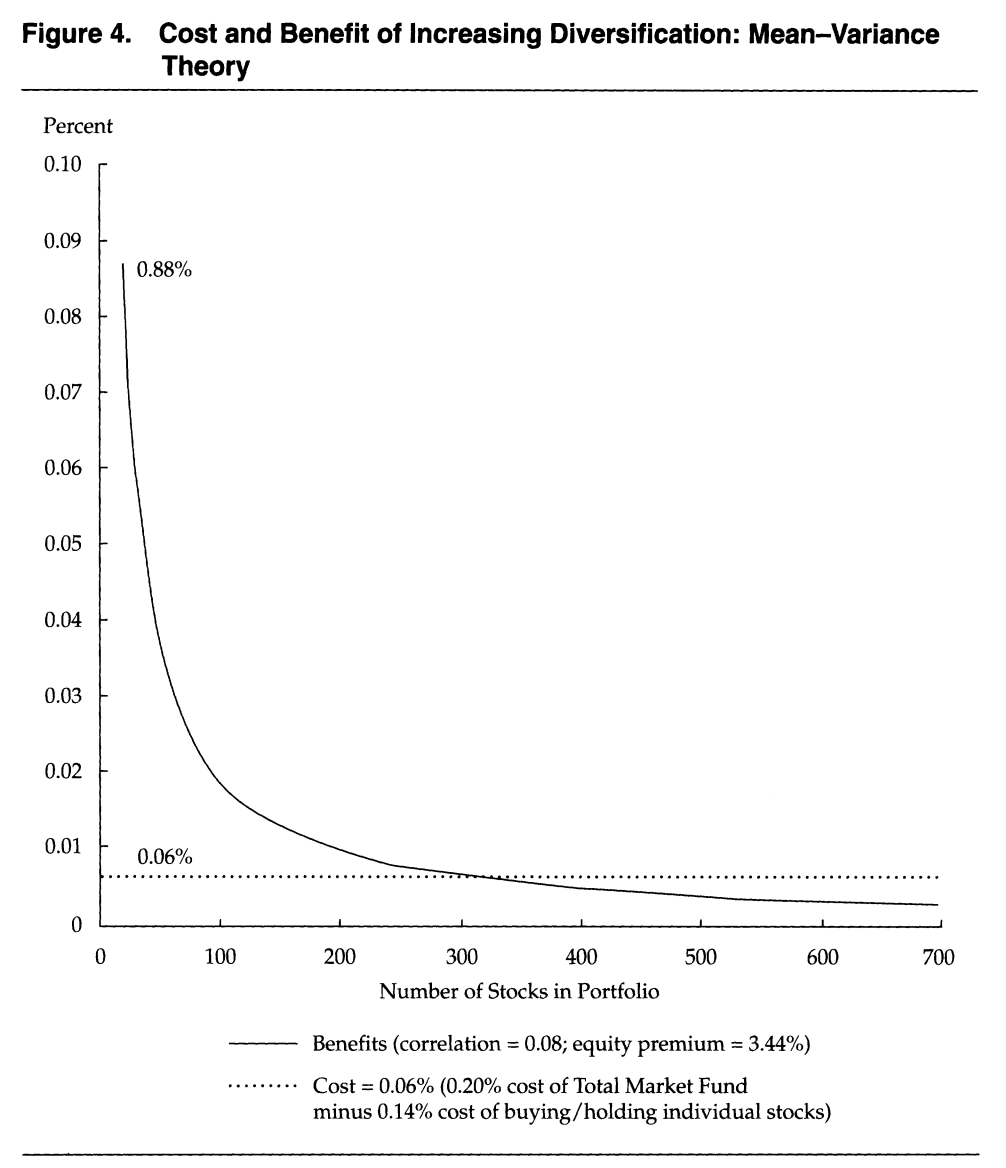
Back in 2004, Mr. Statman found that the best diversification was a basket of 300 individual stocks.
According to the professor, the optimal level of diversification is 300 stocks, as seen in the figure above, with an equity risk premium of 3.44% and a correlation of 0.08 between any two stocks. Beyond 300 stocks, the risk reduction benefit is only 0.06%, equal to the net cost of replacing a 300-stock portfolio with the total market fund.
This kind of diversification can only be achieved by buying ETFs. For example, the S&P 500 ETF ( SPY ), or the Vanguard Total Stock Market ETF ( VTI ), which I discussed in this article . Nobody should own 300 single stocks. I would even make the case that nobody should own more than 40 single stocks. It's just too much work to monitor these investments.
In other words, Mr. Statman is essentially stating that investors need to be extremely passive. In the case of most investors, I agree with him.
The Behavioral Portfolio
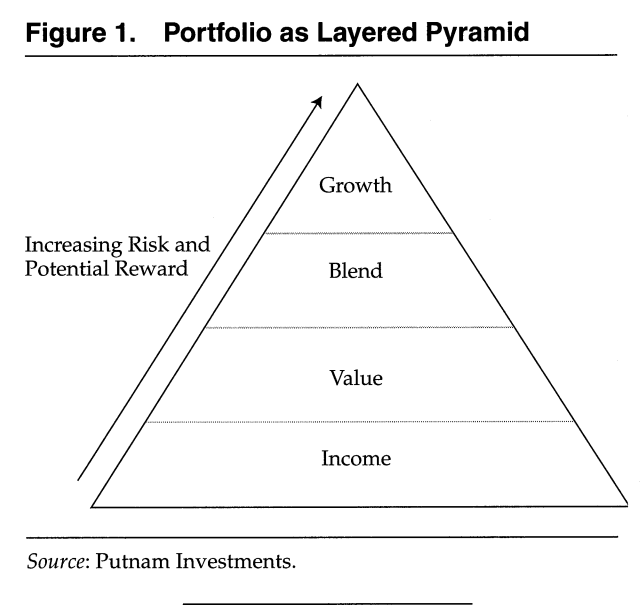
According to Mr. Statman, the diversification puzzle can be explained through behavioral portfolio theory, which proposes that investors create their portfolios in a hierarchical structure. The base layers of the portfolio prioritize guarding against potential losses, while the top layers emphasize the potential for profits.
The graph below shows what this pyramid looks like. The bottom consists of downside protection and stocks that provide high income. At the top, investors invest in stocks expected to generate high gains.
Essentially, risk aversion gives way to risk seeking at the higher layer, as investors aim for big gains. As Statman explains, this behavior is driven by investors' aspirations rather than their attitudes toward risk. Some investors fill the uppermost layer with a few undiversified stocks, while others fill it with lottery tickets.
This sounds very familiar to me. When I started investing (way before I started writing articles), I quickly lost discipline and aggressively bought the stocks that I believed would make me rich. That didn't work out too well.
Mean-Variance Vs. Behavioral
In other words, we're dealing with a comparison between the mean-variance portfolio (highly diversified) and the behavioral portfolio (the pyramid).
The table below shows the major differences.
| Mean-Variance |
| Behavioral (Pyramid) |
| It considers risk reduction as a benefit of diversification, and the optimal number of stocks in a portfolio is at least 300. |
| It does not always view risk reduction as a benefit of diversification, and the optimal number of individual stocks is the number that balances the chance for an uplift into riches against the chance of a descent into poverty. |
| Undiversified investors often overestimate the expected returns of their portfolios and underestimate the risks, and they may be described as "mathematically challenged. |
- The rules of optimal diversification in behavioral portfolio theory are similar to the rules of suitability that govern brokers and financial advisors.
- Investors, financial advisors, and companies sponsoring 401((K)) plans must draw a line between upside potential and downside protection to avoid plunging investors into poverty.
All things said, there's a clear case for the mean-variance approach and a clear case against the behavioral approach, as retail investors cannot handle it.
As you saw in the title, I still went with the behavioral method. Not only is this how I do things all the time, but I also built a portfolio using this exact method for the purpose of writing this article.
Now, let me introduce you to that portfolio.
The Market-Beating 12-Stock Pyramid
The worst thing about the pyramid approach is that in finance when people say pyramid, it's more often than not associated with a bad thing (pyramid schemes).
However, when done right, the behavioral pyramid approach is extremely cool. I would even make the case that it's a good model for investors who know what they are doing.
Essentially, I have applied this method since the day I started to get serious about my long-term portfolio, which contains 90% of my net worth.
Moreover, behavioral portfolios are pretty safe if you know what you're doing. Polkovnichenko found that a behavioral portfolio could be well-diversified with as little as seven stocks. You can read this in Statman's article as well.
Needless to say, when going for seven stocks, investors need to buy stocks in different sectors. Any overlap needs to be avoided.
However, as I wouldn't build a portfolio based on just seven stocks, I am giving you a 12-stock portfolio.
Portfolio Breakdown
This is the portfolio (equal weight):
| Company |
| Industry |
| Div. Yield |
| 5Y Div. CAGR |
| DANAHER CORPORATION ( DHR ) |
| Healthcare Equipment & Supplies |
| 0.4% |
| 12.3% |
| THERMO FISHER SCIENTIFIC INC. ( TMO ) |
| Healthcare Equipment & Supplies |
| 0.3% |
| 14.9% |
| OLD DOMINION FREIGHT LINE, INC. ( ODFL ) |
| Freight & Logistics Services |
| 0.5% |
| 35.3% |
| INTUIT INC. ( INTU ) |
| Financial Technology (Fintech) & Infrastructure |
| 0.8% |
| 14.9% |
| UNION PACIFIC CORPORATION ( UNP ) |
| Freight & Logistics Services |
| 2.5% |
| 14.8% |
| JOHNSON & JOHNSON ( JNJ ) |
| Pharmaceuticals |
| 3.0% |
| 6.1% |
| PEPSICO, INC. ( PEP ) |
| Beverages |
| 2.7% |
| 7.4% |
| EXTRA SPACE STORAGE INC. ( EXR ) |
| Residential & Commercial REIT |
| 3.9% |
| 14.0% |
| LOCKHEED MARTIN CORPORATION ( LMT ) |
| Aerospace & Defense |
| 2.5% |
| 8.7% |
| ENBRIDGE INC. ( ENB ) |
| Oil & Gas Related Equipment and Services |
| 7.0% |
| 6.4% |
| VERIZON COMMUNICATIONS INC. ( VZ ) |
| Telecommunications Services |
| 6.7% |
| 2.1% |
| ALTRIA GROUP, INC ( MO ) |
| Food & Tobacco |
| 8.1% |
| 7.7% |
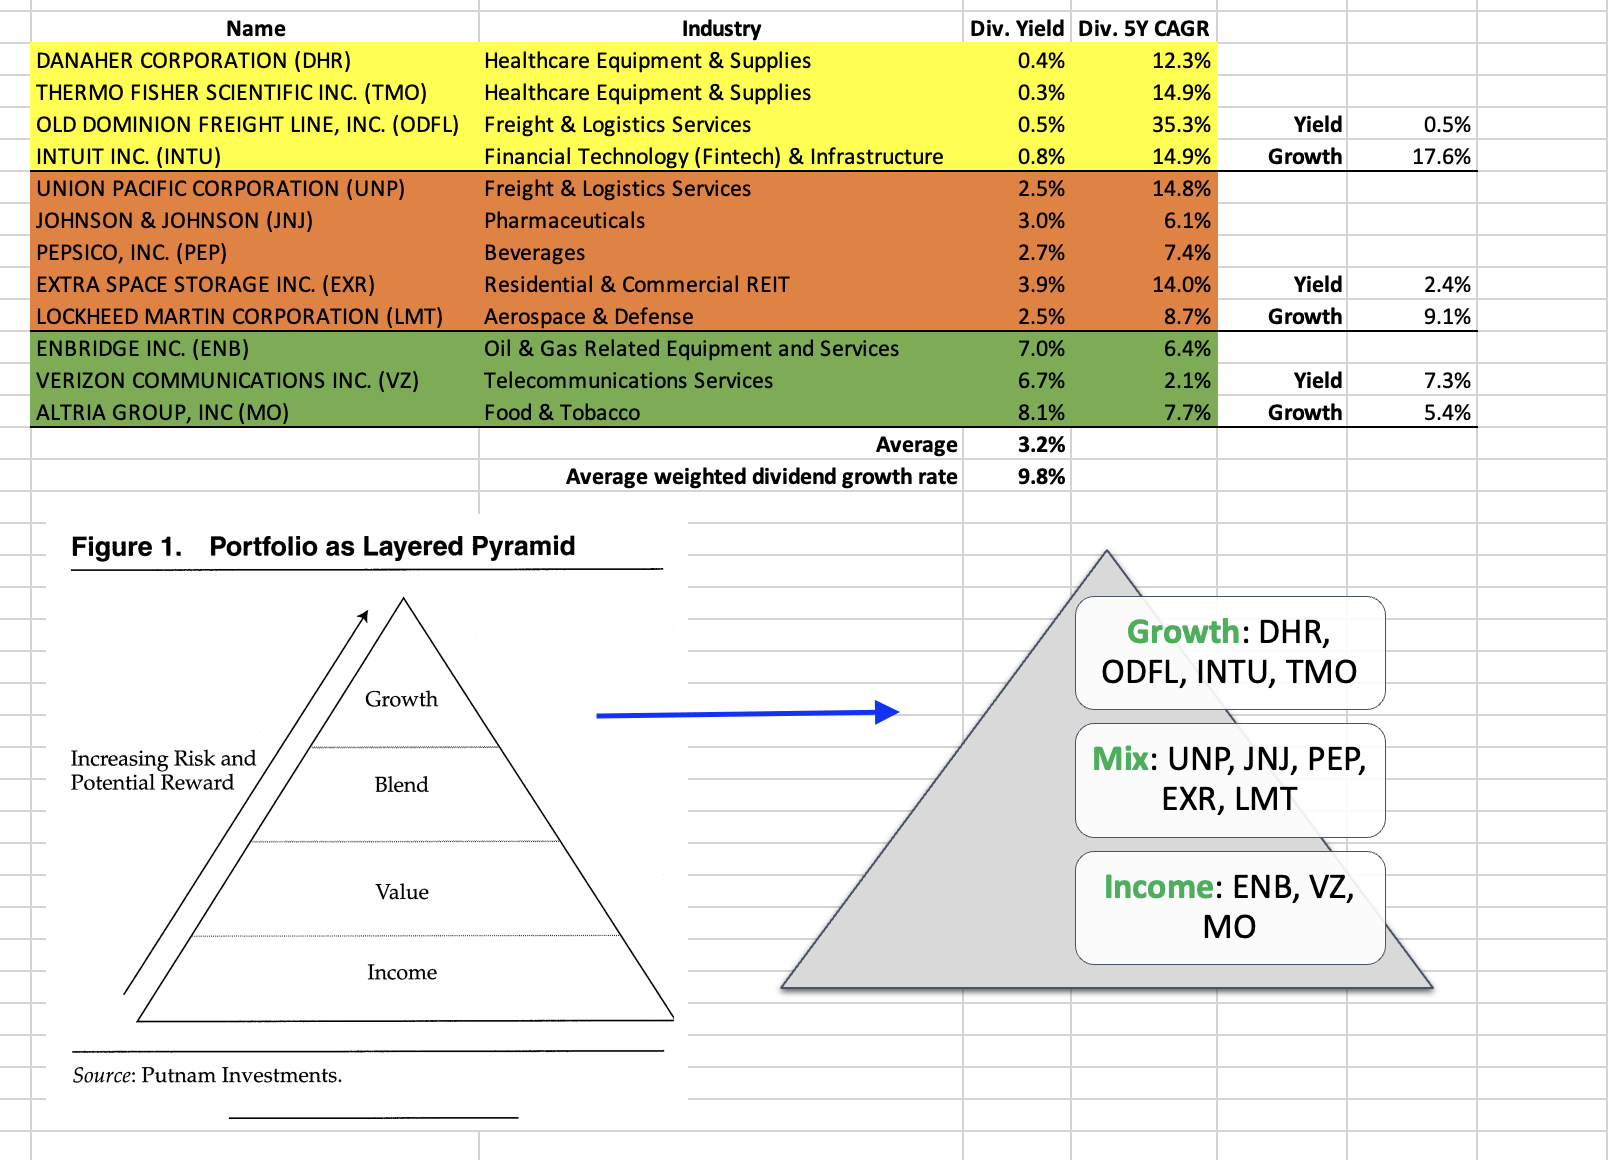
To visualize the portfolio pyramid, I made a screenshot of my Excel file, which contains more valuable information we need for this discussion.
As we can see below, I decided to go with a pyramid with three categories instead of four. The idea is rather simple. I went with one category of high-yielding stocks, one category of low-yielding stocks with high dividend growth, and a group that comes with decent yields and decent dividend growth.
Whereas behavioral science suggests that people buy income stocks for safety and growth stocks to gamble on high returns, I incorporated safety in every stage of this pyramid.
After all, high growth does not mean high risk - if you do it right. Every stock in this pyramid pays a dividend, even if the yields on fast-growing stocks are low. Theoretically, this is a sign of strength, as being able to consistently hike the dividend shows resilience. Dividend growth stocks tend to have below-average volatility and above-average returns. In other words, when picking the right stocks, one does not increase the risks at the top of the pyramid.
Nuveen
This changes the moment investors replace growth with investments in risky assets like crypto, money-losing companies, or other investments that come with high risks. Even if the returns may be high in some cases, the long-term risk/reward is often terrible, which supports the case Meir Statman made.
With that said, this portfolio has three categories: growth, mix, and income.
- The portfolio has an average yield of 3.2%.
- The 5Y average weighted annual compounding dividend growth rate is 9.8%
Please note that I am using a weighted dividend growth rate. Using an average growth rate does not work. Please keep that in mind. After all, if a low-yielding stock doubles its dividend, the impact on the portfolio is still limited. The total impact of a tiny hike from a high-yielding stock can be higher.
That said, this portfolio is close to being classified as high-yield, as the Schwab High-Yield ETF ( SCHD ) is yielding 3.5%. Moreover, when combining this with high and steady dividend growth, we're dealing with a portfolio that comes with more benefits than just capital gains - but more on that later.
The portfolio consists of three layers.
- Growth . In this category, I placed four stocks. Two of them are competitors (Danaher and Thermo Fisher). Intuit is focused on small businesses, while Old Dominion Freight Lines is rapidly growing in the less-than-truckload business. I own Danaher in my dividend growth portfolio. All other stocks are on my watchlist. The average yield in this category is just 0.5%. The average weighted dividend growth rate is 17.6% .
- Mix . This is my favorite category. In my dividend growth portfolio, most stocks would fall in this category. This category comes with an average yield of 2.4% and average annual dividend growth of 9.1% . In this model portfolio, I included my favorite railroad Union Pacific, one of the most reliable and steadily growing consumer staples, PepsiCo, fast-growing self-storage REIT Extra Space Storage, reliable defense giant Lockheed Martin, and pharma giant Johnson & Johnson. I own all stocks except for JNJ.
- Income . This category is tricky - at least to me. I am allergic to companies with high yields but close to zero growth. Or even worse, some companies with high yields end up delivering long-term negative total returns. There are a lot of REITs and other companies out there that turn out to be tremendous value traps. I believe that investors need to focus on total returns and only go overweight high-yield once they need the cash flow to retire. That said, I own some high-yield stocks and believe that there are some good stocks on the market that provide above-average yields. In this model portfolio, I went with three stocks. One energy company, one defensive telecom stock, and cigarette producer Altria. These stocks provide the model portfolio with an average yield of 7.3% and 5.3% weighted average annual dividend growth, which is more than decent for an average yield this high. Please note that Enbridge is a Canadian company, which may have tax implications.
With that said, the performance of this strategy is phenomenal.
Portfolio Performance
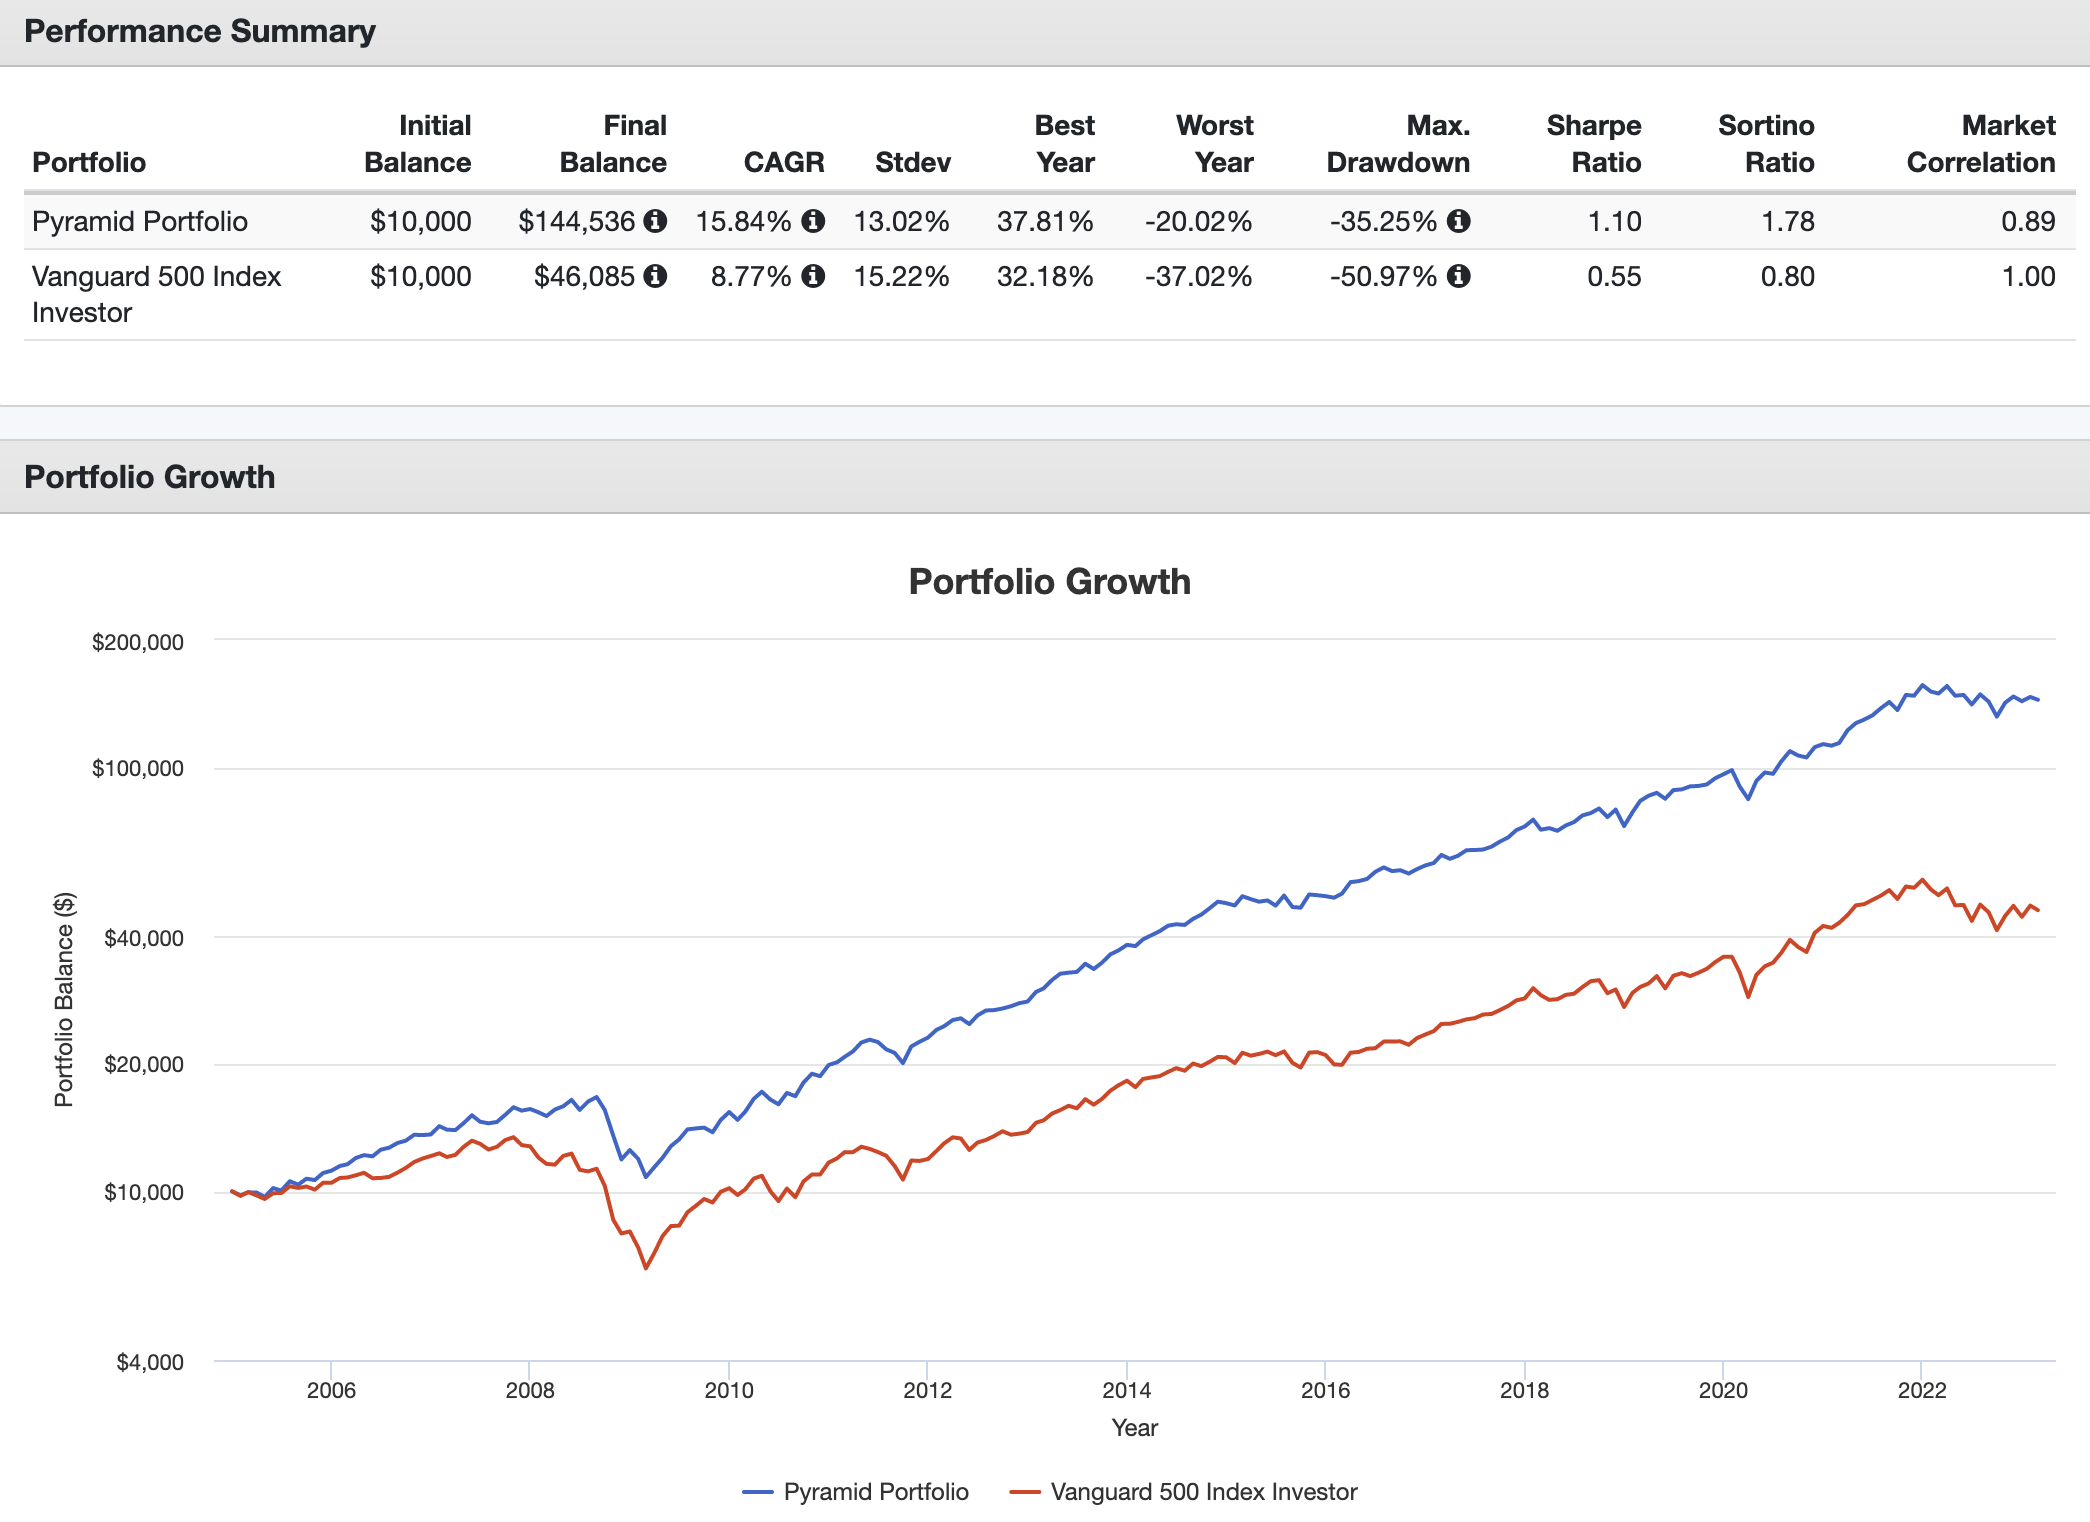
Between January 2005 and February 2023, this portfolio has returned 15.8% per year, turning an initial $10,000 investment into $144,536. This beat the 8.77% annual CAGR of the S&P 500, which isn't a bad return either. However, the additional return provided investors with almost $100 thousand in profits.
Moreover, the portfolio standard deviation is 220 basis points below the market's standard deviation, which is a terrific result. Hence, the Sharpe Ratio is 1.10. The worst year was -20%. The worst drawdown was -35%. Both of these numbers beat the market by a wide margin.
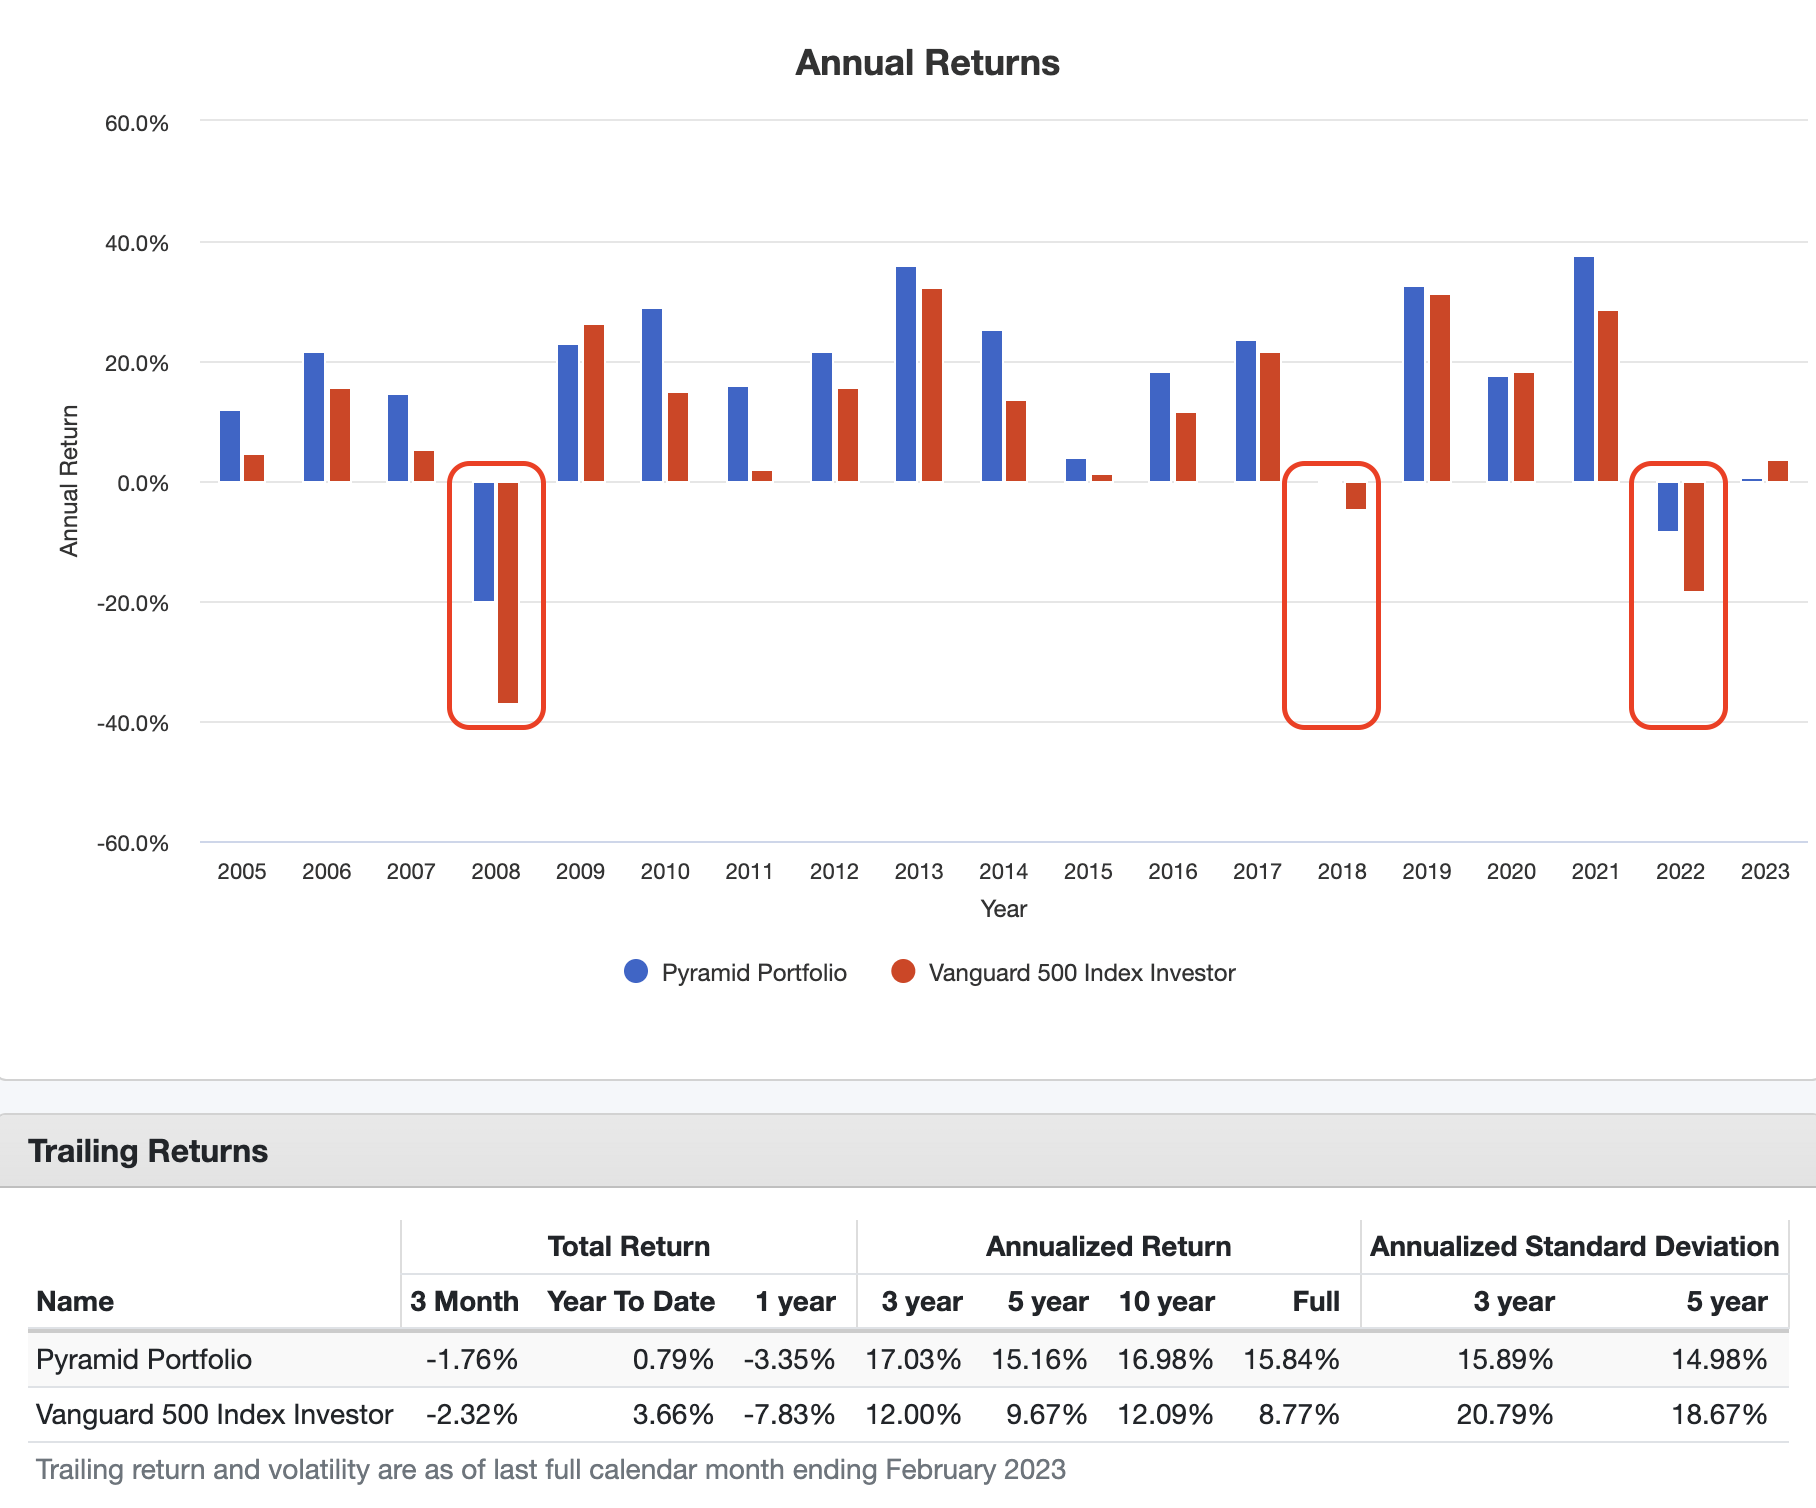
Even better, the portfolio has outperformed the market in every down year since 2005. Also, outperformance has remained consistent, as the lower part of the overview below shows. On a three, five, and ten-year basis, the portfolio has beaten the market. Over the past three years, it even had a standard deviation that was close to 500 basis points below the market's standard deviation.
This may be the best model portfolio I have discussed on Seeking Alpha so far.
Even better, if one had invested $10K in 2005, one would have received close to $4,500 in dividends last year. That's a 45% yield on cost.
Takeaway
In this article, we did two things. First of all, we discussed investment strategies based on two major theories. While there is a good case to be made to buy a huge basket of stocks via an ETF, I believe there's tremendous value in the behavioral approach. This theory can be explained using a pyramid. Essentially, this pyramid explains why investors should not go with this theory. However, when done properly, investors can use the pyramid method to build resilient portfolios that come with safety, income, and growth. Even better, the right mix of stocks comes with outperforming returns and subdued volatility.
The portfolio presented in this article is based on behavioral theory. It includes some of my favorite stocks that, I believe, offer tremendous value for investors. Regardless of whether you're an income-seeking investor or a growth-oriented investor.
This portfolio has a decent yield and high dividend growth. I would buy this portfolio in a heartbeat if I didn't already have a portfolio.
Don't get me wrong, I'm not trying to get inexperienced investors to buy single stocks. If anything, this research proves two things:
- Inexperienced investors are prone to behavioral shortcomings. These people should stick to ETFs. There's is nothing wrong with that. ETFs are terrific tools for wealth accumulation.
- Experienced investors can use a layered approach to incorporate multiple themes, resulting in impressive portfolios that can beat the market with subdued risk.
Going forward, we'll discuss more strategies and theories, and interesting investment ideas for dividend investors.
So, stay tuned for that, and let me know of any ideas or suggestions you may have!
For further details see:
The Dividend Pyramid: Potentially Beat The Market With This 12-Stock Portfolio