XOP - The Energy Sector Is Powering Up - Part 2
2023-04-04 23:57:43 ET
Summary
- This article completes the article published last Friday that forecast higher prices for both crude oil and the energy sector.
- In this article, we investigate which of the 25 largest energy sector ETFs is best correlated to the price of oil and therefore best to use if oil prices rise.
- This situation brings up a broader subject: how to forecast industries dependent primarily upon the price of some underlying resource or commodity.
This article completes the article published last Friday that forecast higher prices for both crude oil and the energy sector. We recommend that you read the first article but will briefly summarize the main reasons behind the forecast here. This is necessary to fully understand why we did a five-year correlation study between the price of crude oil with the price of the major energy ETFs, which we’ll show a little later.
Why we think crude oil and energy stocks are headed higher
Experience has shown that the "timing" of an investment is better achieved looking at investor activity and investor expectations than analyzing specific economic data. To that point, high levels of short selling by money managers in the oil futures market usually occur just before crude oil prices move higher. The arrow to the far right indicates that money managers currently have the highest short selling level since 2019.
Crude Oil Prices and the % Money Managers are Short Oil Futures (Michael McDonald)
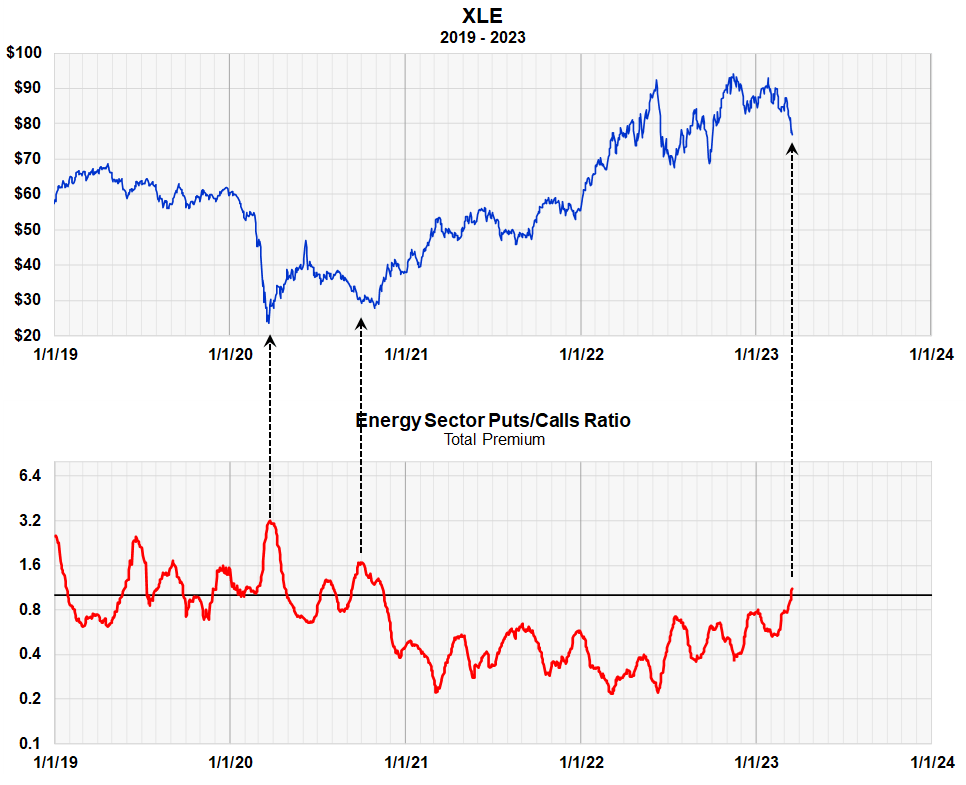
The second factor: In the stock market, the ratio of “puts to calls” in the entire energy sector shows more money is now going into “puts” than “calls” in the 160 stocks in the sector. This hasn’t occurred since late 2020 and, while there are exceptions, it usually occurs just before energy stocks move higher.
Puts and Calls Ratio of all 160 stocks in the energy sector ( Michael McDonald)
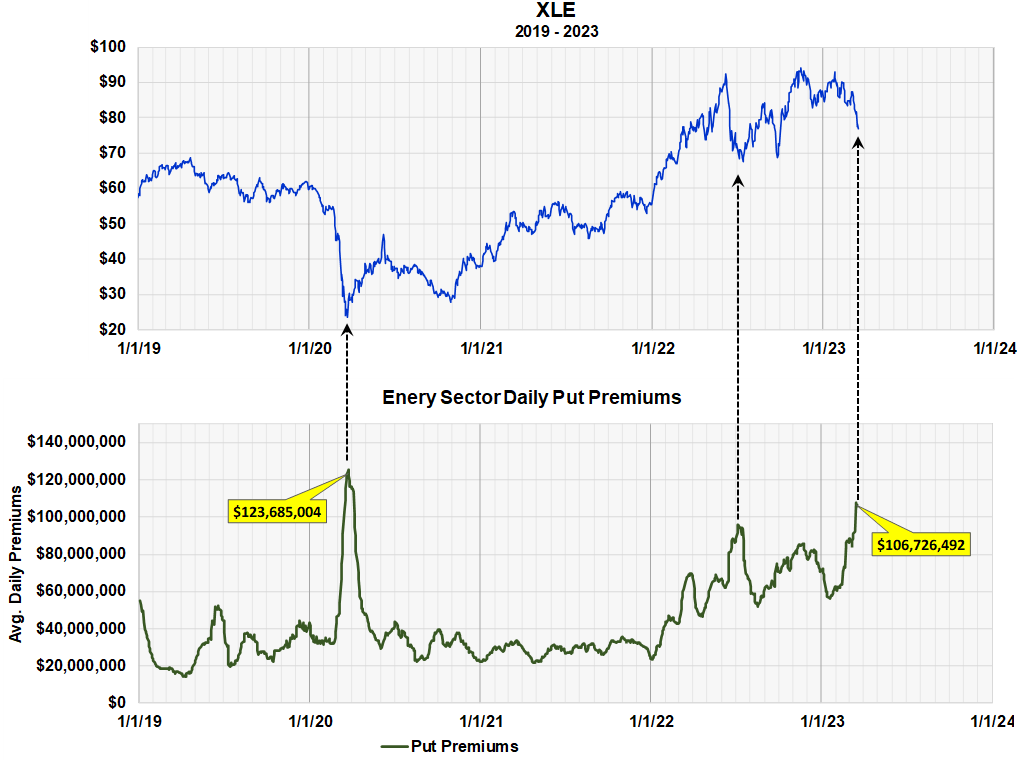
The third chart provides added confirmation. It shows the actual amount of money going into “puts” in the 160 energy sector stocks each day. In our opinion, this metric is more convincing than the puts and calls ratio.
Average daily amount of money buying puts in the energy sector (Michael McDonald)
We've highlighted with black arrows three surges in put buying that occurred in the last four years and each occurred at a significant price low in the energy sector as represented by XLE.
These were the reasons we gave for a rise in crude oil prices and a corresponding increase in energy stocks.
If crude oil moves higher, which ETFs are the most certain to move with it?
This is the question we addressed in the first article and which we want to expand on it here.
In Friday's article we only looked at the two ETFs - XLE and XOP. We ran long term correlation studies that went back to 2006 on these two ETFs, which showed that XLE was better correlated to crude oil prices than XOP. But we didn't fully explore this concept. When we did we discovered something important.
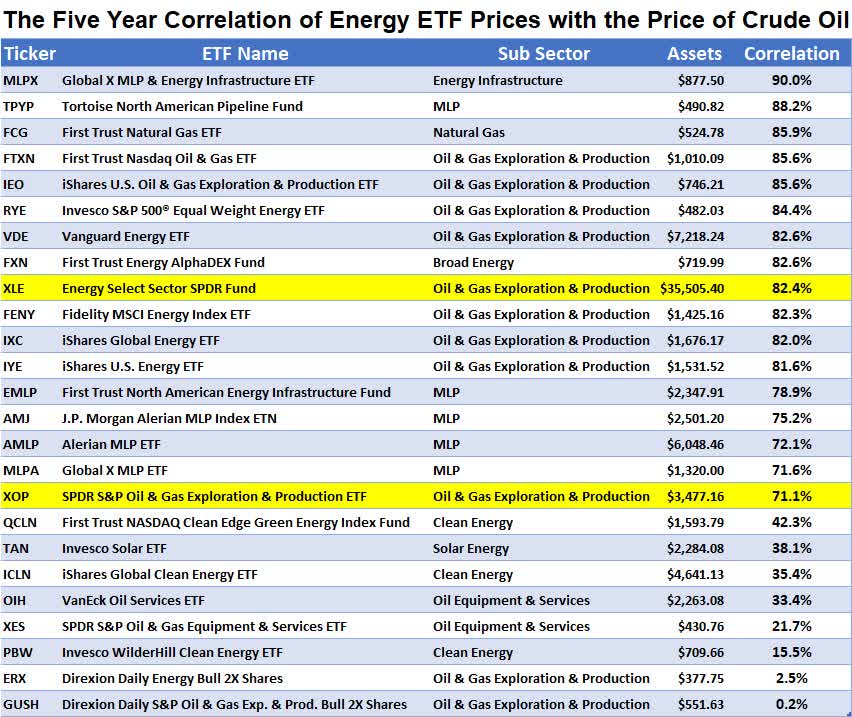
We did a second study. Instead of just two ETFs, we checked to see which of the 25 largest energy ETFs are best correlated to fluctuations in the price of oil. But this study was a five-year study, which was the period of time that encompassed all 25 ETFs.
This table shows the results of that study. The table ranks the ETFs by their correlation factor found in the last column. It also includes total assets in each ETF.
Crude Oil price correlation with largest energy ETFs (Michael McDonald)
Most of the correlation factors are high and range from 70% to 90%. This is what the correlation factor means.
A correlation coefficient, commonly referred to as a correlation factor, calculates how closely two variables are related to one another. When two variables have a correlation factor of 90%, there is a very strong positive association between them, suggesting that if one variable rises, the other usually tends to rise as well.
The range of a correlation coefficient is from -1 to 1. A strong negative association with a value of -1 means that if one variable rises, the other tends to fall. The two variables are unrelated to one another if they have a value of 0, which denotes no relationship. A score of 1 denotes a complete positive association, which means that as one variable rises, the other rises exactly proportionately as well.
Since our forecast of higher energy stocks was based primarily on an expected rise in the price of oil, and no other business considerations, one wants the best investment with a proven correlation to the underlying price of oil. We'd feel comfortable investing in any ETF with a correlation factor above 80%.
In this table we noticed that the five-year study of XLE and XOP reversed what we found in the long-term study back to 2006. We think this difference points out something important. Since ETFs change over time, if you do a long term study you're not comparing the same portfolio with what existed 10 or 15 years. This tells us that portfolio changes over time makes long term ETF correlation studies useless and that one should concentrate on shorter term studies like our five-year study.
Companies that are dependent upon the price of some underlying resource or commodity
This situation with oil brings up a broader subject: the subject of industries dependent upon the price of some underlying resource or commodity. It could be oil prices and oil stocks, gold or copper prices and mining stocks, etc.
Businesses that have this dependency are different than most businesses. Forecasting here is based primarily on forecasting the price of the underlying commodity. It could work in a negative way. It might be that a business is negatively correlated where higher prices in the commodity is bad for a business.
You'll see more on this subject in future articles.
For further details see:
The Energy Sector Is Powering Up - Part 2