VTI - The Fed's Housing Conundrum
2023-06-08 11:37:09 ET
Summary
- Housing affordability has declined to record lows since the pandemic, with Fed rate hikes impacting sales and prices.
- CPI for shelter is on track to meet the Fed's target by next spring, and rent prices are not re-accelerating.
- The Fed should aim for housing affordability to ensure it doesn't face spiraling rents and house prices or higher interest rates.
Introduction
Since the onset of the pandemic, housing affordability declined to record lows not seen since the peak of the housing bubble almost two decades ago. Fed interest rate hikes put the brakes on housing sales, and brought prices down by a small percentage. This has continued to put a lid on both house prices and apartment rent increases. But Fed rate hikes have also cratered new home listings, effectively putting a floor on prices as well.
The Fed is thus in a conundrum. While shelter inflation is likely to decline sharply over the next 9 or so months, the Fed needs to look beyond the next few months and target alleviating the housing shortage by increasing affordability.
A Quick update of my housing mantra
For the past decade or more, I have consistently written that:
Interest rates lead sales.
Sales lead prices.
Prices lead inventory.
Here's an updated look at these stages of the housing market.
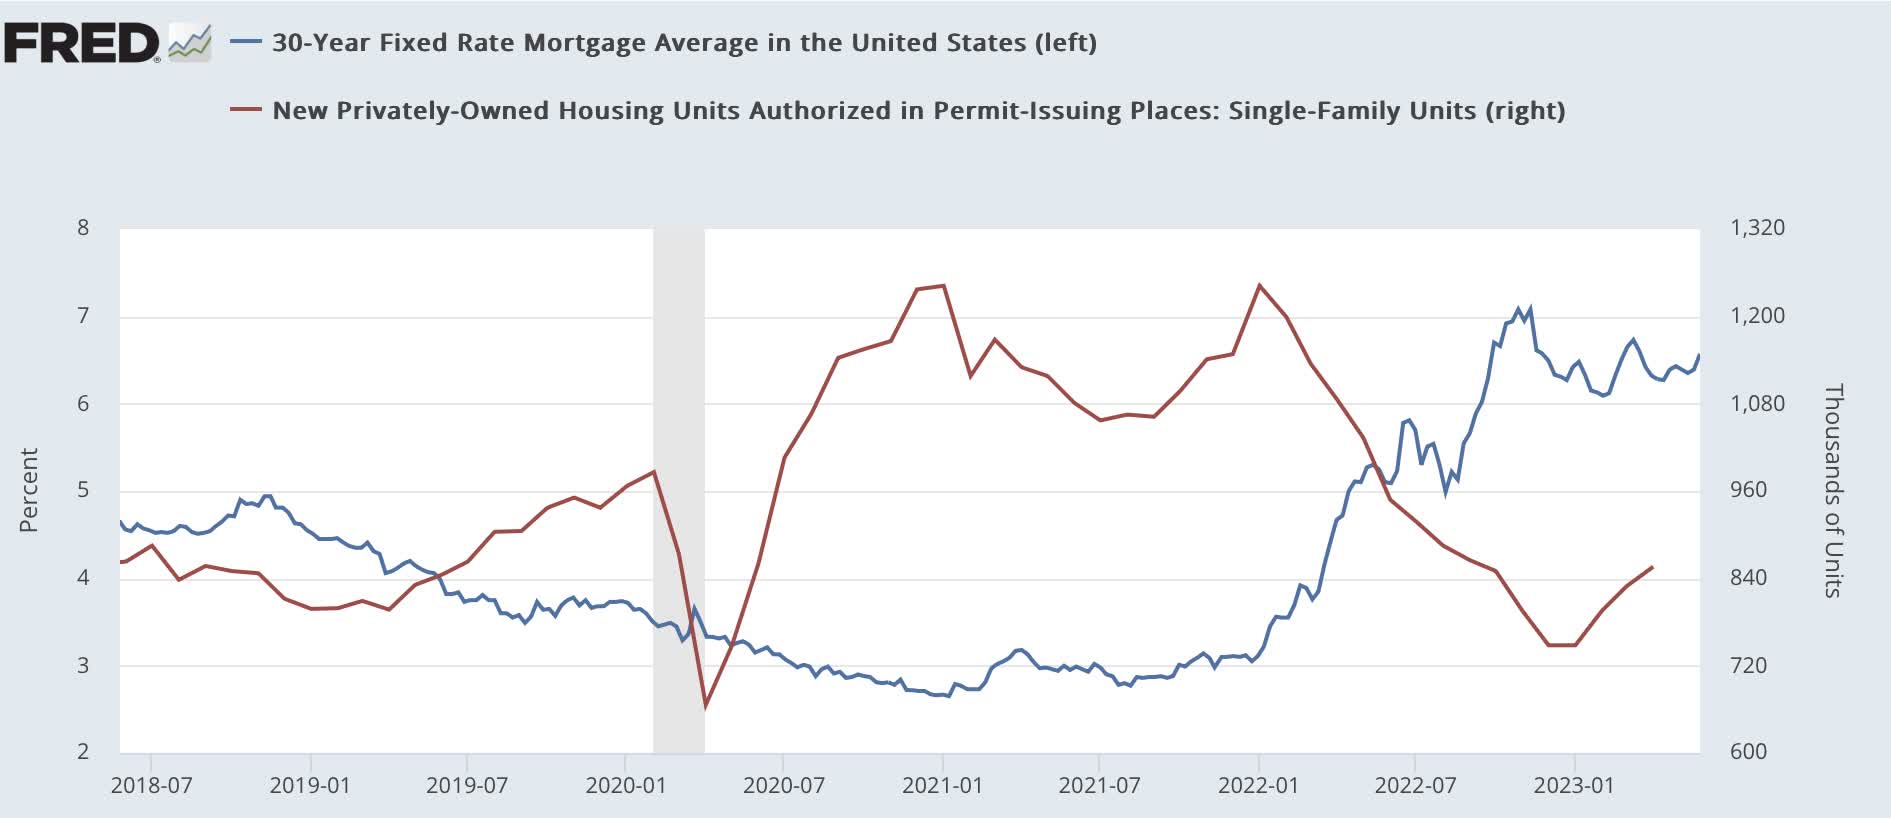
Interest rates rose from July 2021 to a peak at the end of October 2022. Sales (as represented by single family permits, which are the least noisy metric) started to decline in January 2022 through a nadir at the end of 2022. With the decline in interest rates since, sales started to increase again:
Mortgage rates vs. single family permits (FRED)
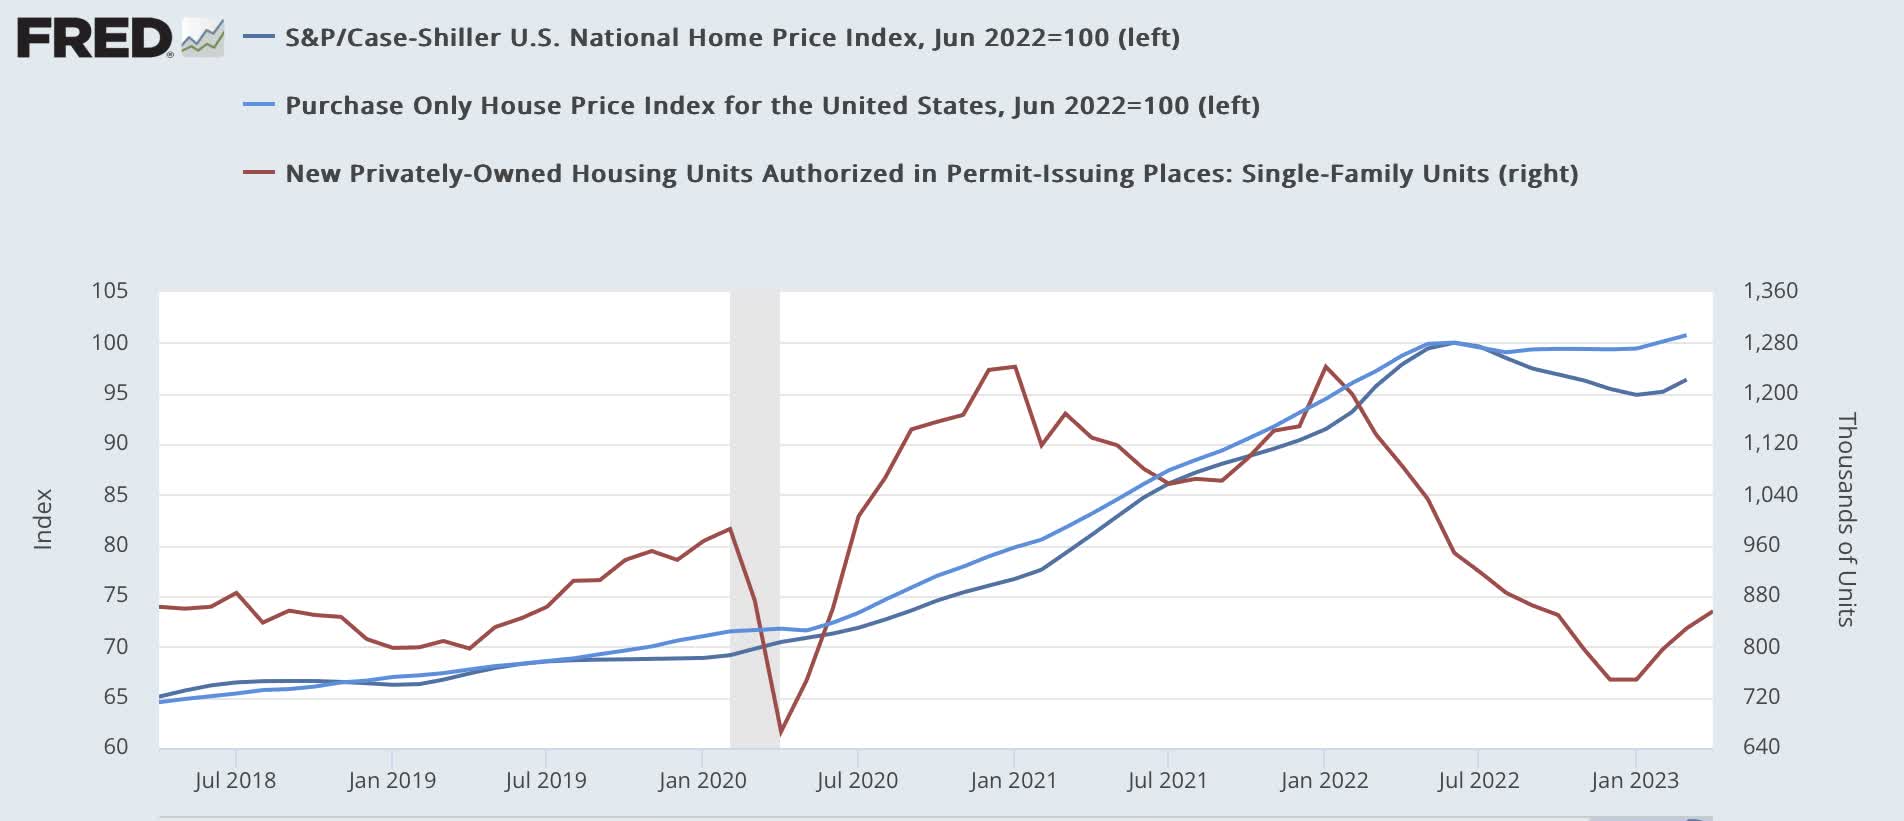
Meanwhile, prices as represented by the FHFA and Case-Shiller national Indexes continue to rise until June 2022 before declining by -3%. They may have bottomed in January:
Single family permits vs. house price indexes (FRED)
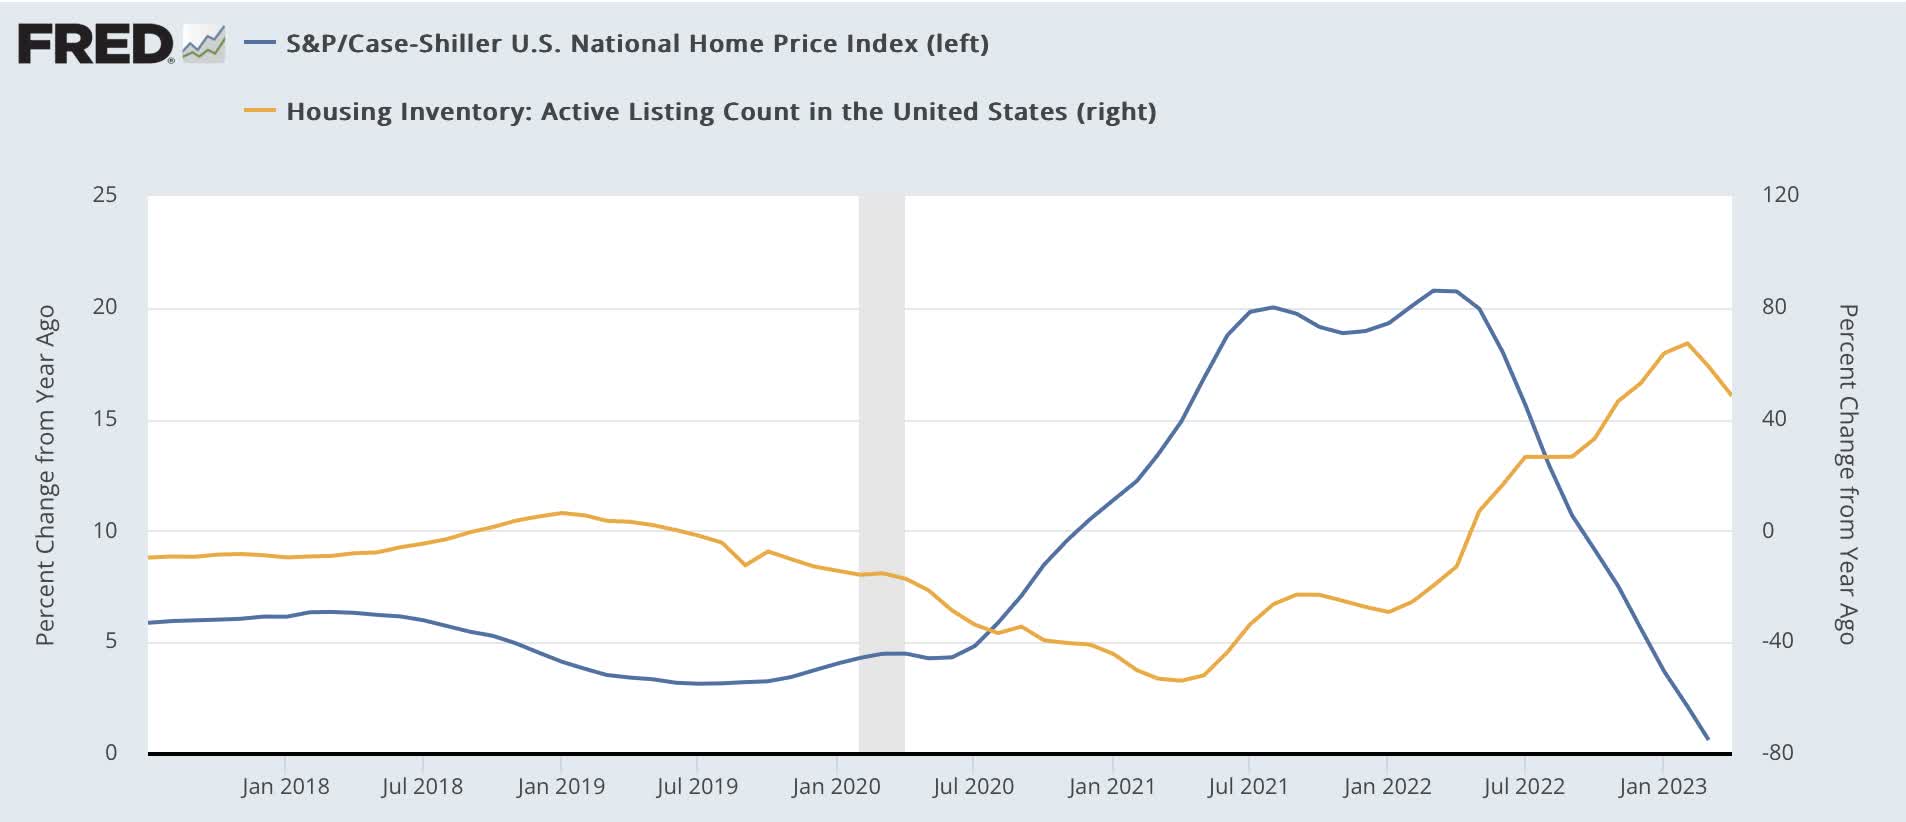
Finally, total inventory continued to increase until February, and may have begun to decline, while new inventory has been declining since last May (note that since the data is not seasonally adjusted, YoY is the best measure):
House prices vs. inventory (FRED)
In short, Fed rate hikes effectively put the brakes on the start of new home construction (although units under construction, not shown, have just recently peaked). But the effect on prices, while real, has been relatively muted. That is undoubtedly in large part because so few people have been willing to put their houses on the market where prices have been reduced, and any new mortgage they take out will be much higher than their previous one.
The CPI for shelter follows house prices, and is on track for meeting the Fed's target next spring
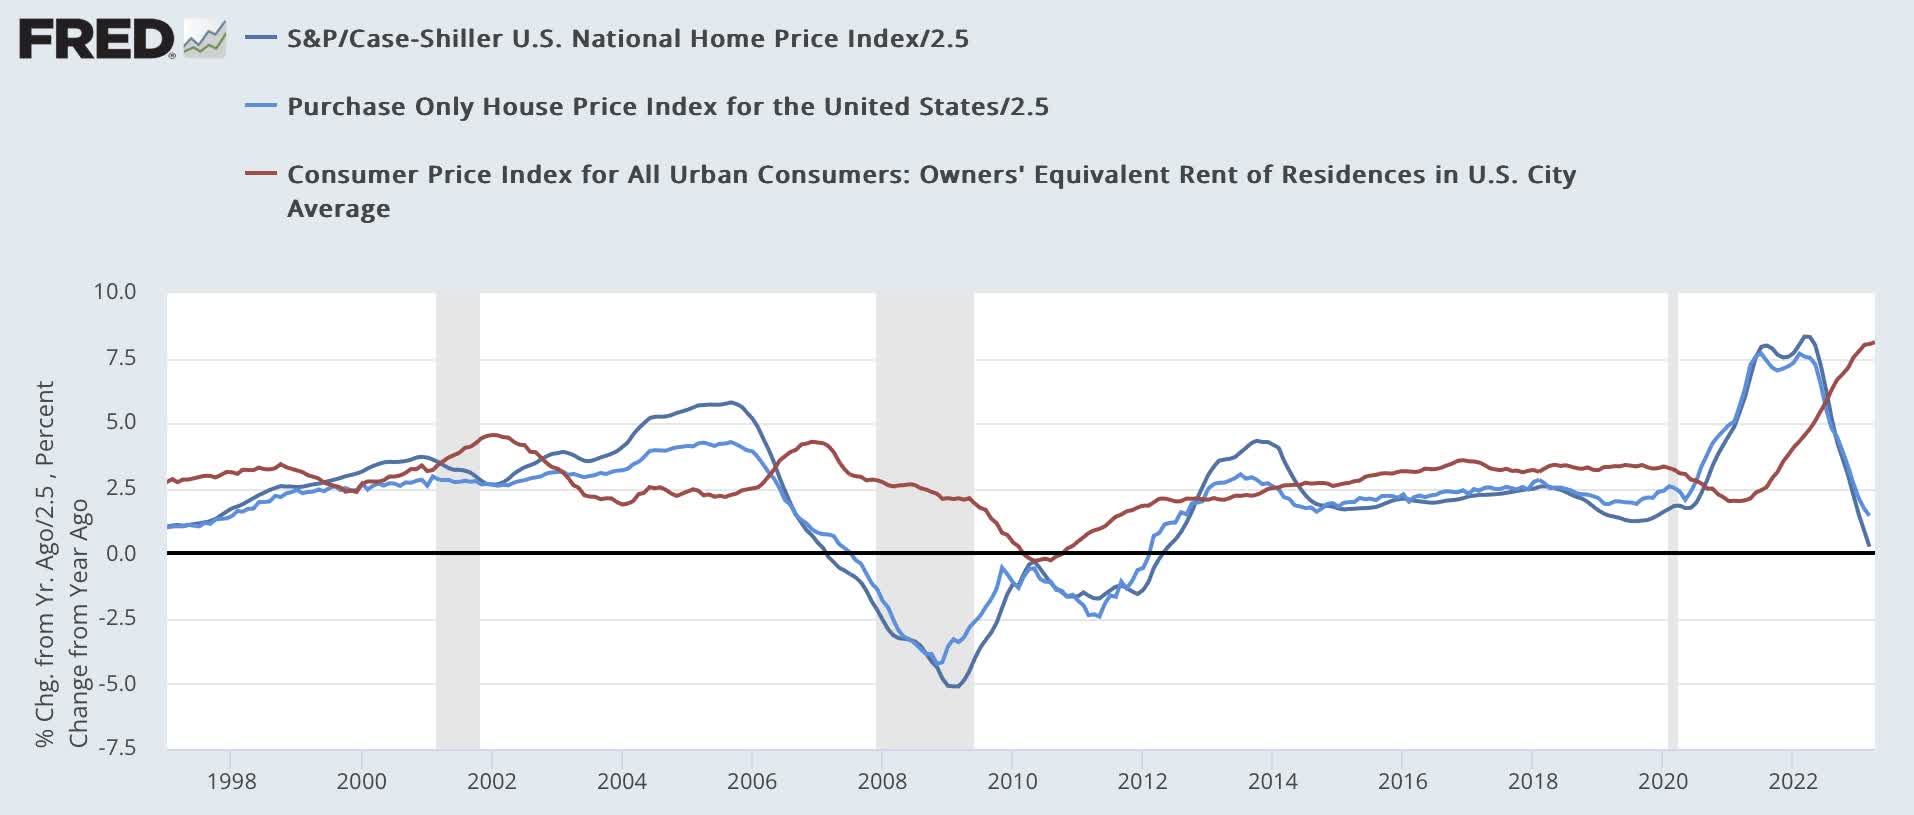
I have been writing this since December 2021, and repeated it many times since , accurately forecasting that house prices would drag Owners Equivalent Rent higher, to the level of 7.5%-8% or even higher.
Here is the latest update (prices /2.5 for scale):
YoY house prices vs. YoY Owners' Equivalent Rent (FRED)
House prices began accelerating in summer 2020, but Owners Equivalent Rent did not follow until spring 2021. As noted above, price appreciation began to decline sharply after April 2022, while OER just began to decelerate in March, as shown in the graph of monthly changes below):
Monthly house prices vs. OER (FRED)
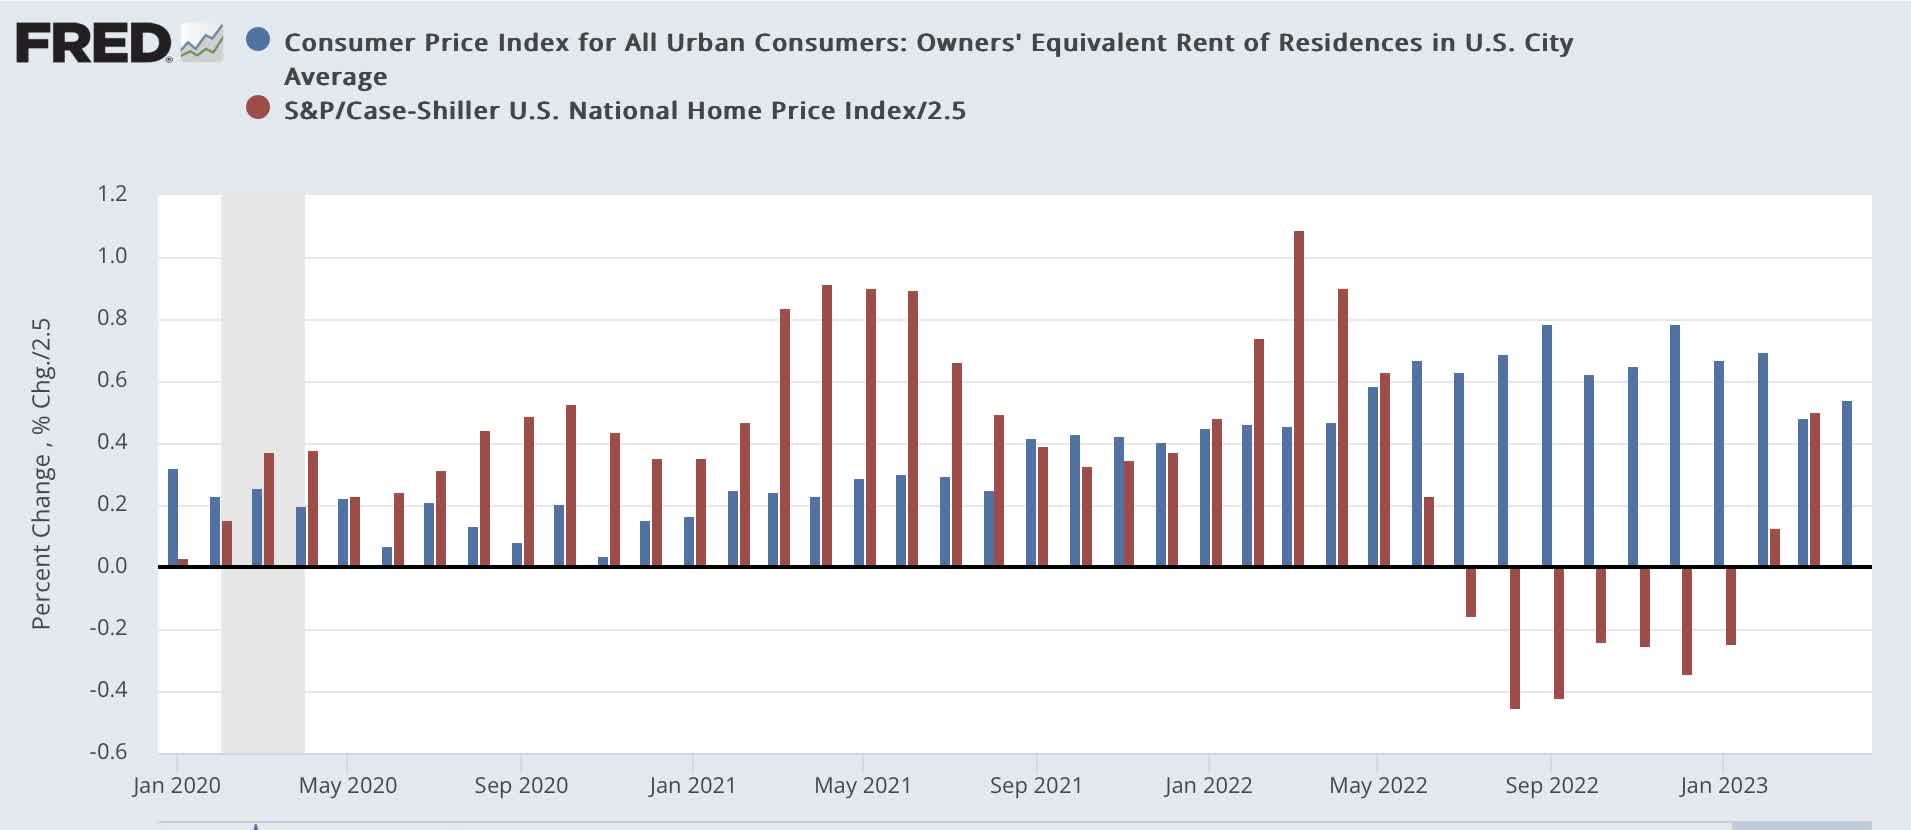
In the latest monthly report for March, house prices YoY as measured by the FHFA were only up 3.6%, and by Case-Shiller up a mere 0.7%.
And Bill McBride a/k/a Calculated Risk points out that YoY existing house prices tend to lead the Case-Shiller index by several months - and are already negative YoY:
House prices: realtor.com vs. Case-Shiller (Calculated Risk blog)
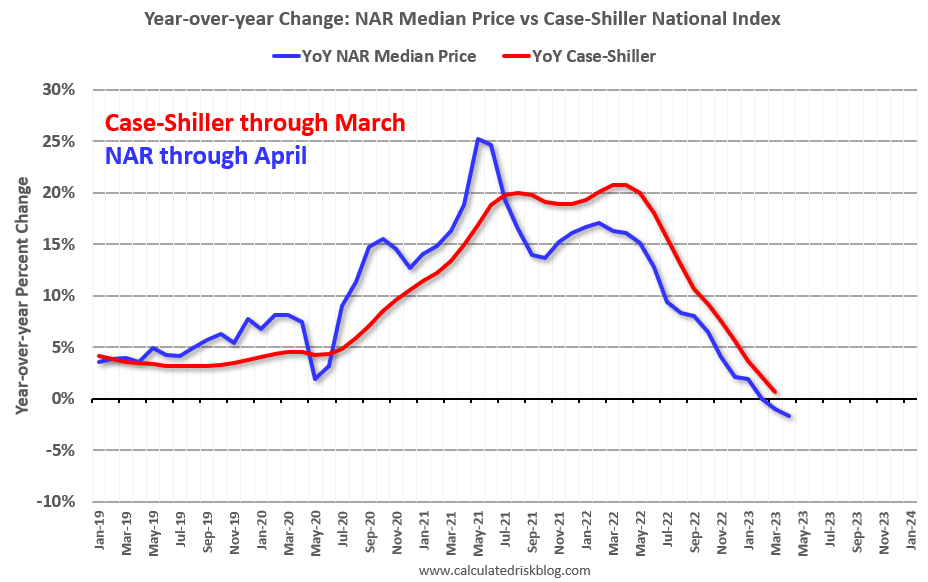
This all implies a YoY increase in Owners Equivalent Rent of only about 2%-2.5% by roughly next March.
No, rent prices are not "re-accelerating"
Two weeks ago, Seeking Alpha reprinted an article from Wolf Richter claiming the rent prices were "re-accelerating." While I think highly of Wolf Richter, in this case I disagreed in the comments, and wanted to amplify that once rents were updated for May by Apartment List, his source.
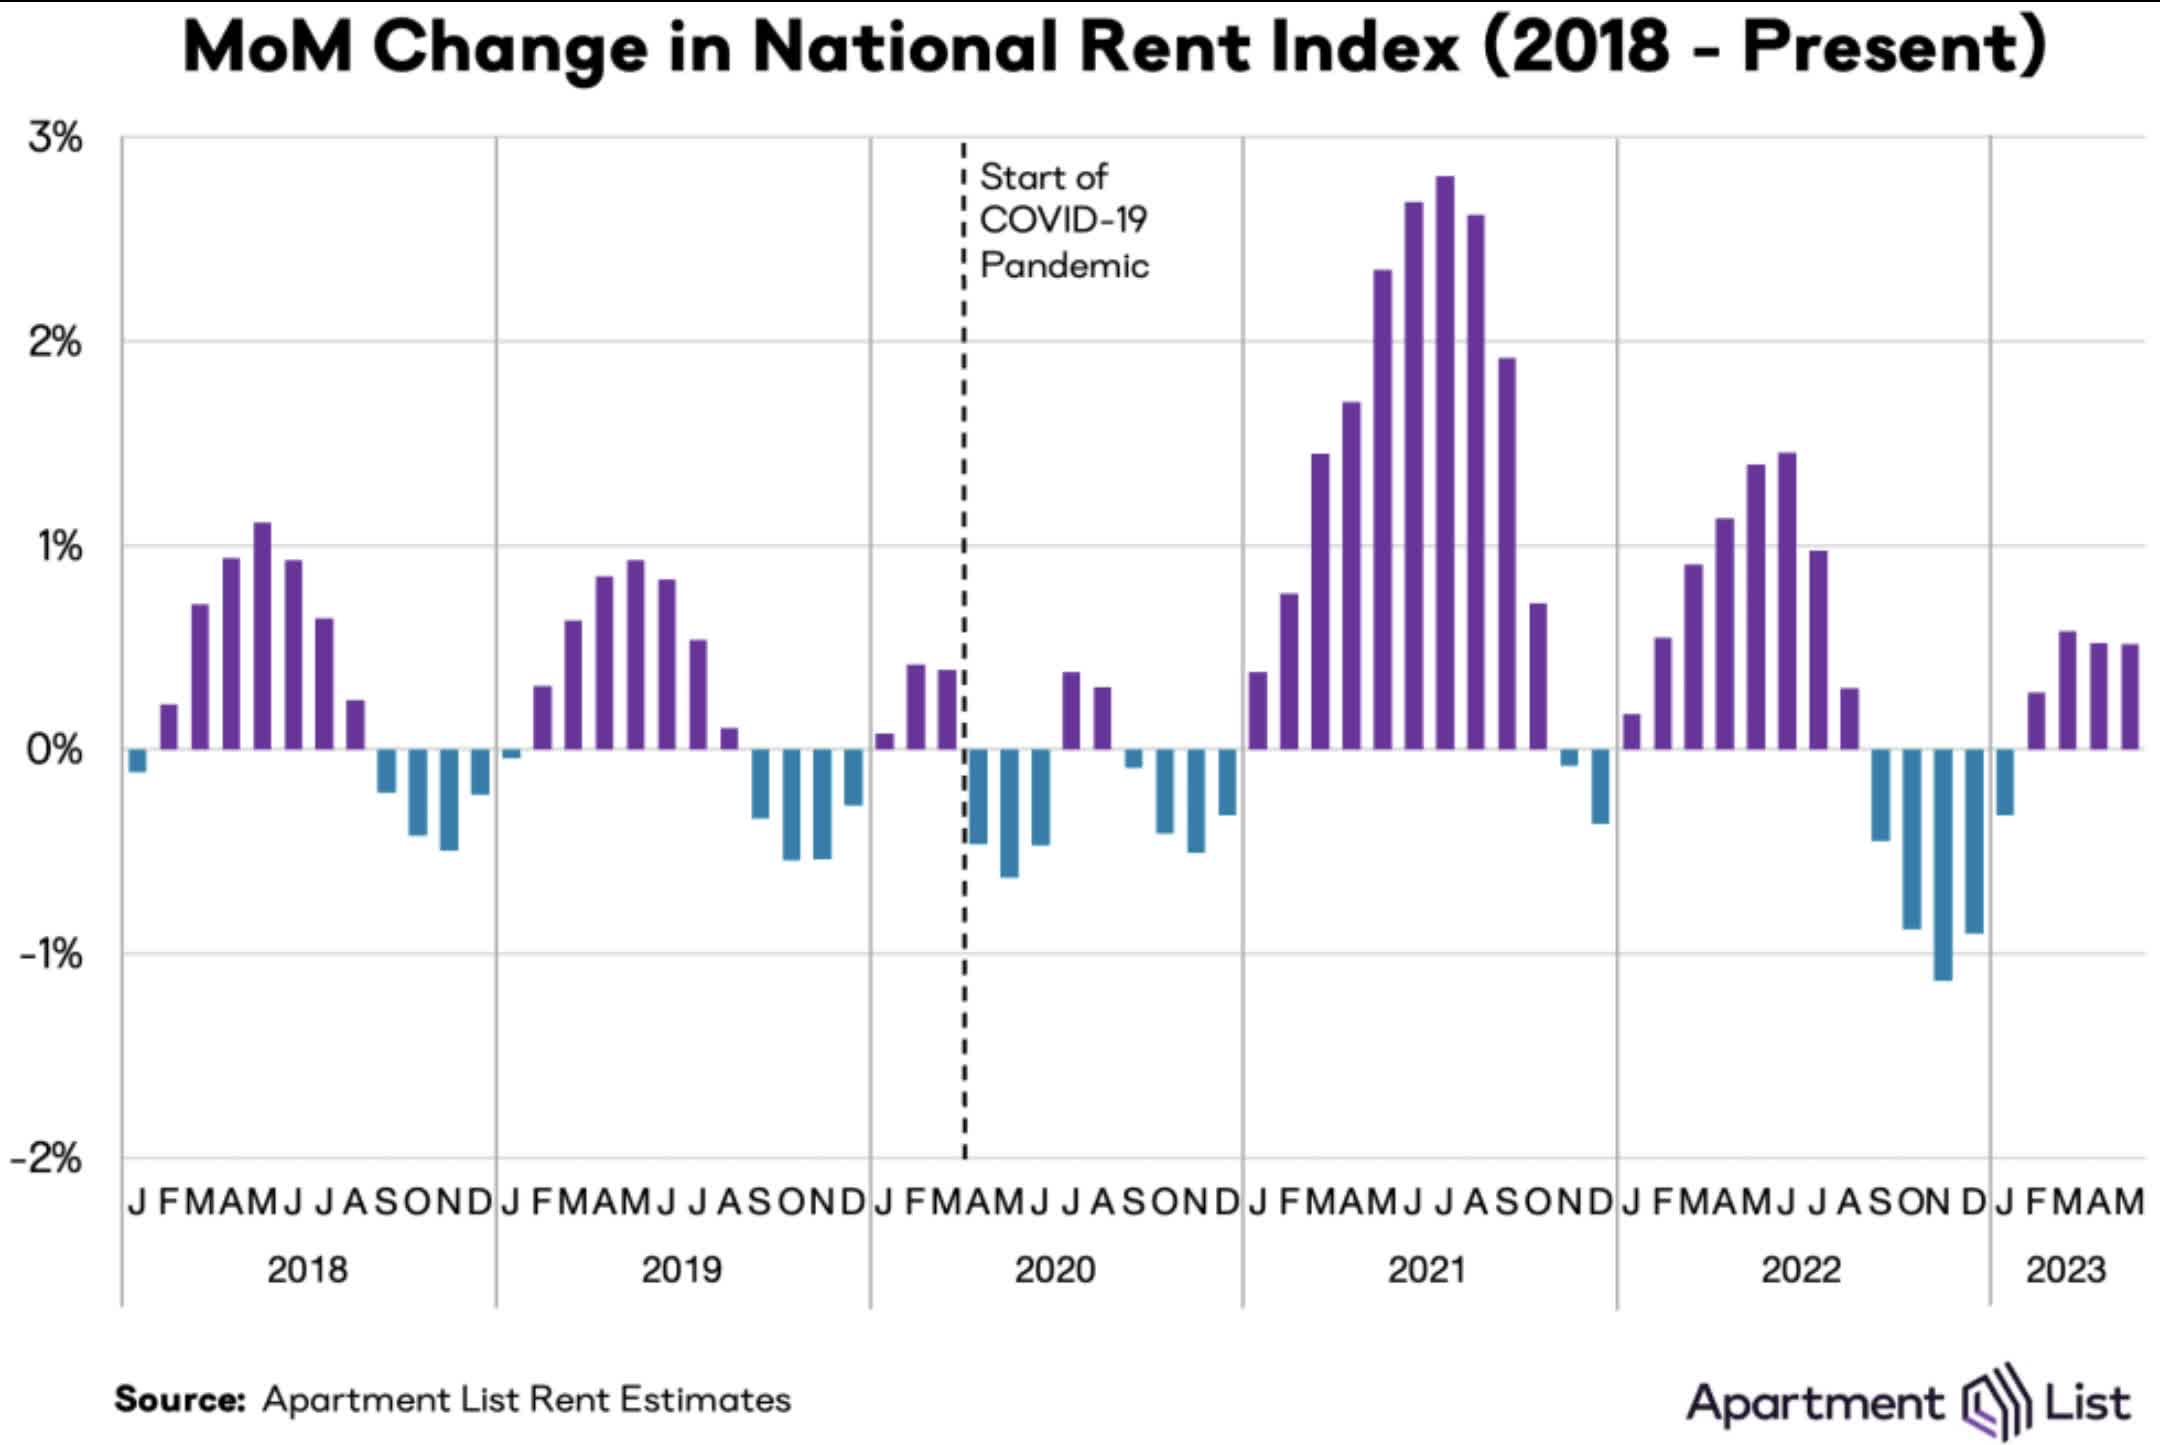
Last week, they were. To cut to the chase, here's what the monthly numbers look like:
Apartment List National Rent Report (ApartmentList.com)
And here is what Apartment List itself had to say:
"Our national rent index increased by 0.5 percent over the course of May. This is the fourth straight monthly increase in rent prices, but rent growth is flattening out at a time of year when it's normally picking up steam. Rent growth this year is coming in slower than average, and even though prices are trending up again, a combination of sluggish demand and increasing supply is keeping prices in check.
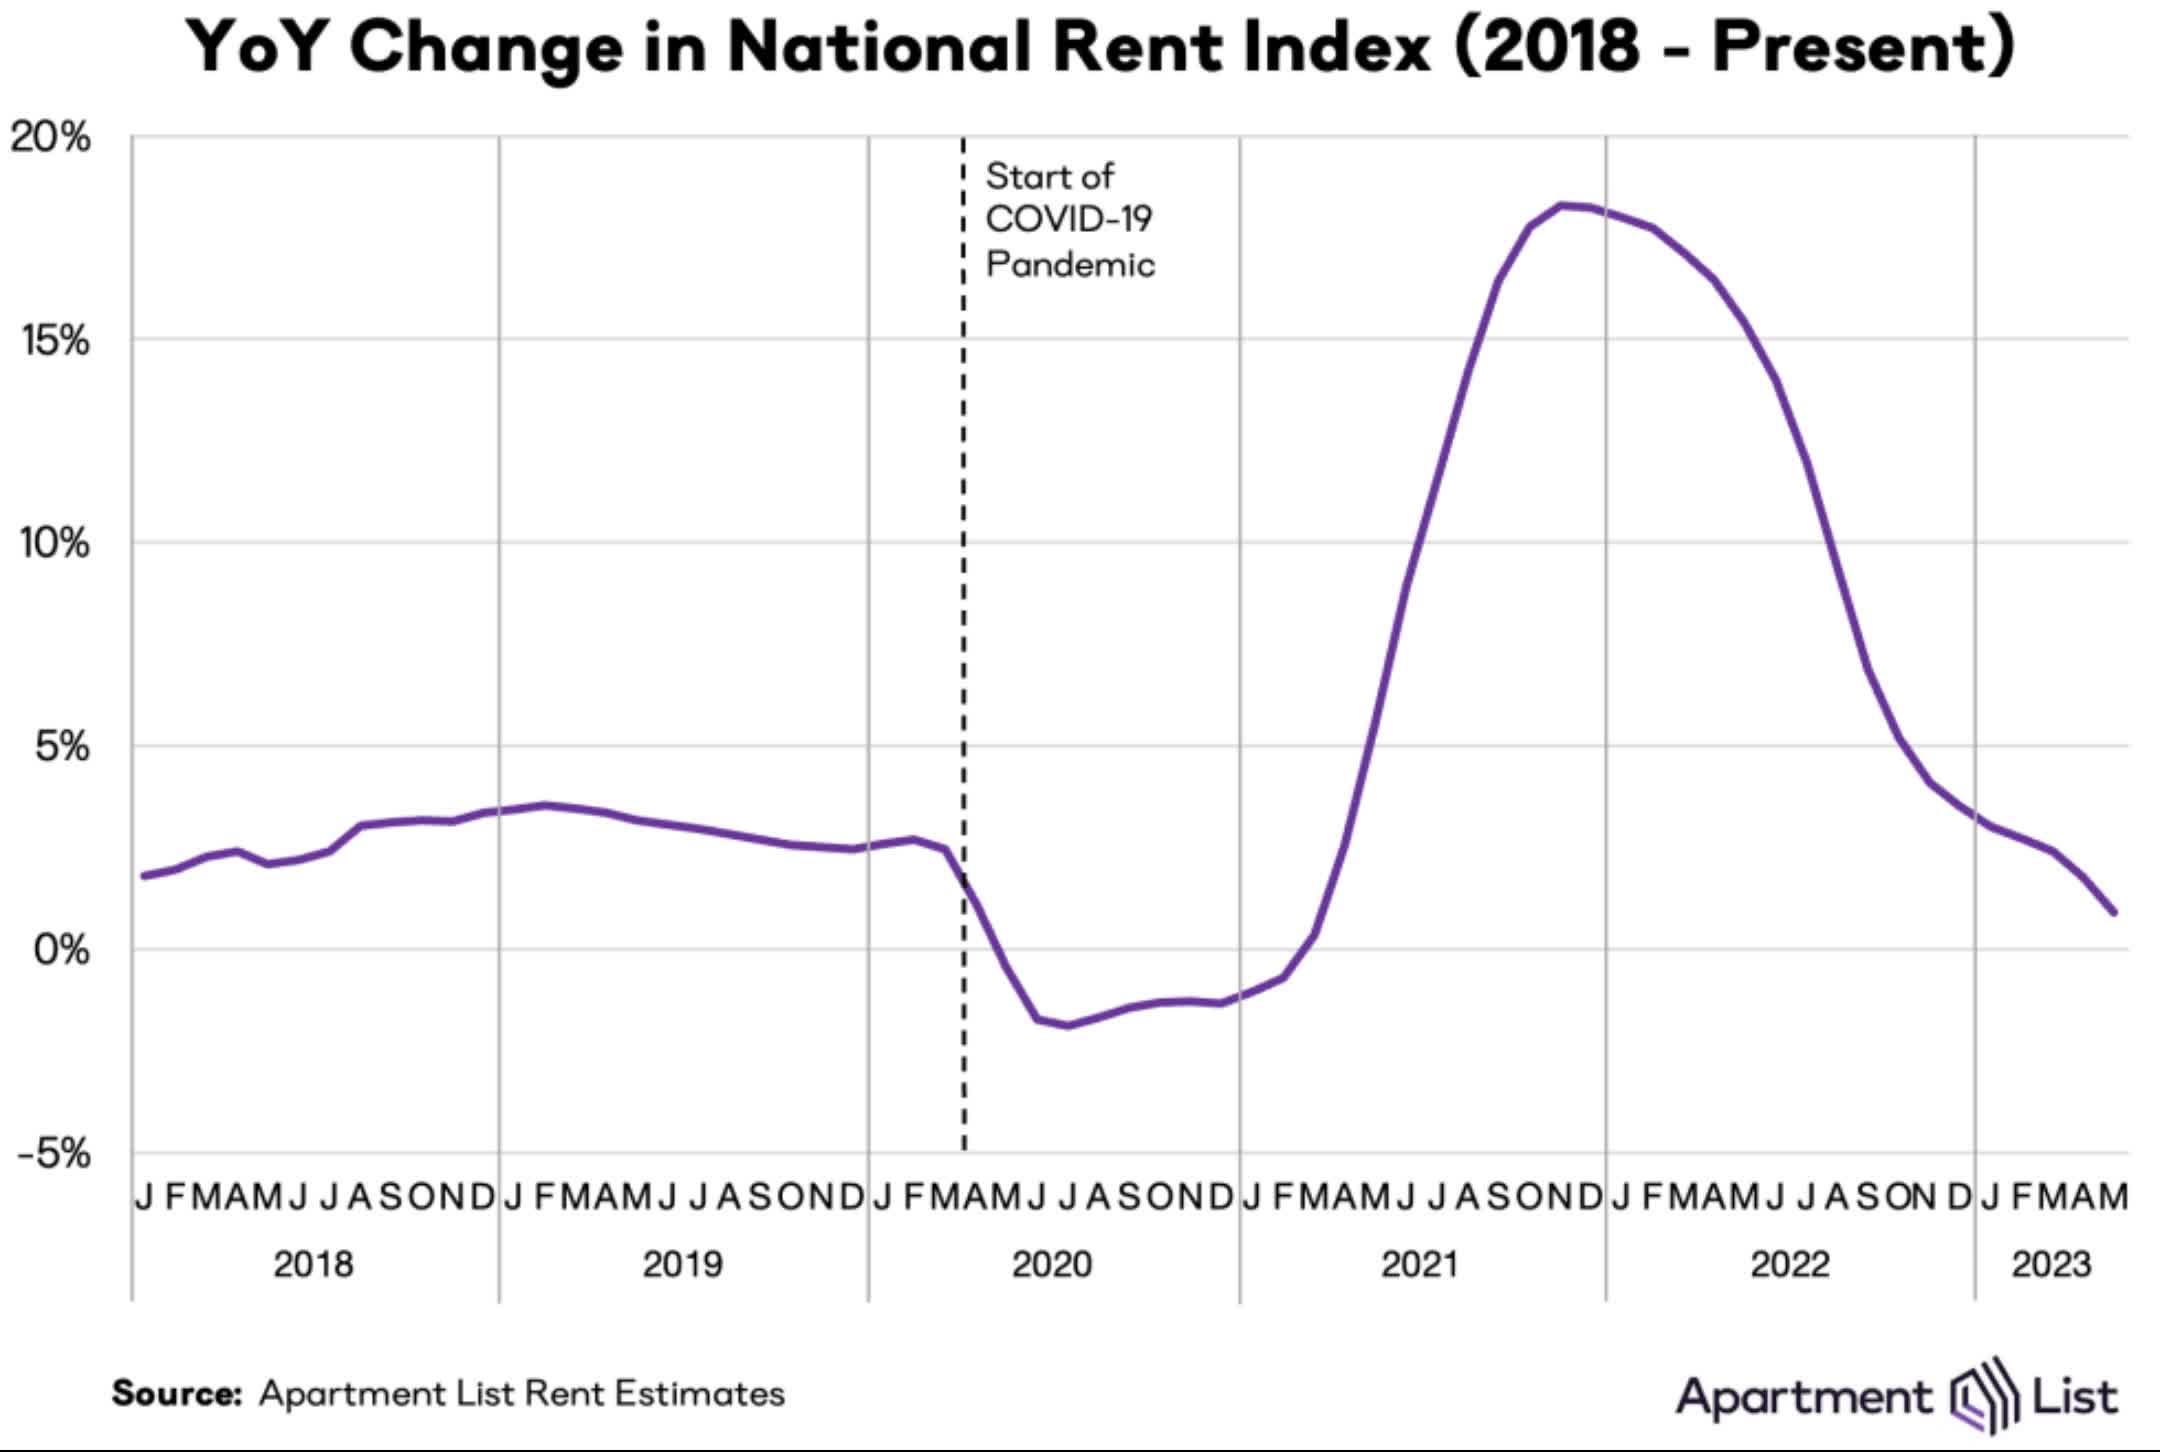
"Year-over-year rent growth is continuing to decelerate, and now stands at just 0.9 percent, its lowest level since March 2021. Year-over-year growth is now solidly below the average rate from 2018 to 2019 (2.8 percent), and could possibly even dip into slightly negative territory in the months ahead."
Here is Apartment List's YoY graph:
Apartment List YoY Rent Index (ApartmentList.com)
There are two other private sources for apartment rents with monthly updates.
Here's what Zillow had to say in its latest report:
"Asking rents climbed by $13, or 0.6%, from April to May, according to the latest edition of the Zillow Observed Rent Index ((ZORI)). That brings the typical rent price nationwide to $2,048, or 4.8% higher than one year ago, continuing a steady slowdown in annual growth rates ever since the record-high growth rate of 17% observed in February 2022.
"The 0.6% monthly increase is slightly smaller than the typical May increase of 0.7%, averaged over data from 2015 to 2019. That difference is minuscule on its own, but as the eighth consecutive month with below-average monthly growth, it makes one more point in a trend. The year-to-date rent growth of 1.9% is well below the 2.7% average cumulative growth observed in the first five months of the year in pre-pandemic ZORI data."
And here is what Zumper had to say in its May 24 update:
- "Zumper's National Index is up slightly: One-bedroom median rent across the country is $1,504, a 0.6 percent increase over last month. The two-bedroom median of $1,856 is a 0.8 percent month-over-month increase.
- "Most of the country has settled back into traditional seasonal patterns, with prices increasing slightly in the spring and summer, peaking during the fall, then dipping during the slower winter months."
All three sources for current apartment rents have the same conclusion. Apartment rents, like Daylight Savings Time, have a typical seasonal pattern: the spring ahead and then fall back. That was temporarily distorted by the pandemic, but now the normal pattern is reappearing - but at a reduced scale so far.
There is also plenty of evidence, including from academic studies, that new monthly rents lead "rent of primary residence" in the CPI by 12 months. Note that the Apartment List YoY number is as low as it was in the 2 years before the pandemic, suggesting that by next spring this metric will also be close to or at the Fed's 2% target.
Finally, both construction and completion of multi-family housing are running at 25 year record highs:
Multi-family units under construction and completed (FRED)
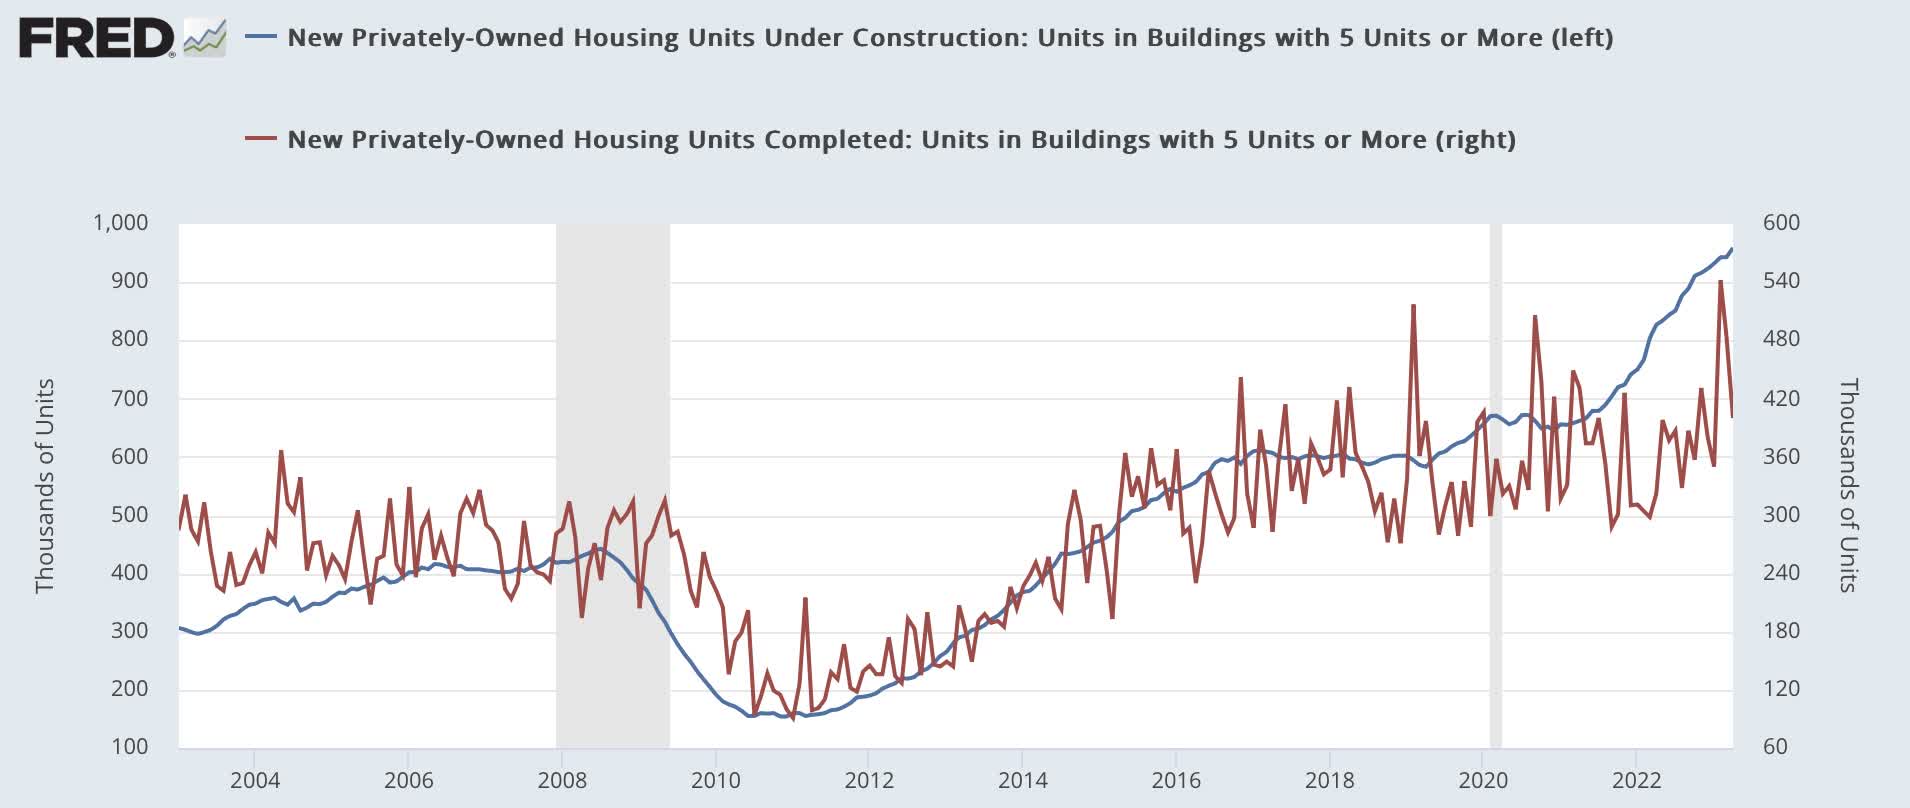
More and more capacity is going to come on the apartment market, and that is good for consumers' rents.
The Fed should aim for housing affordability
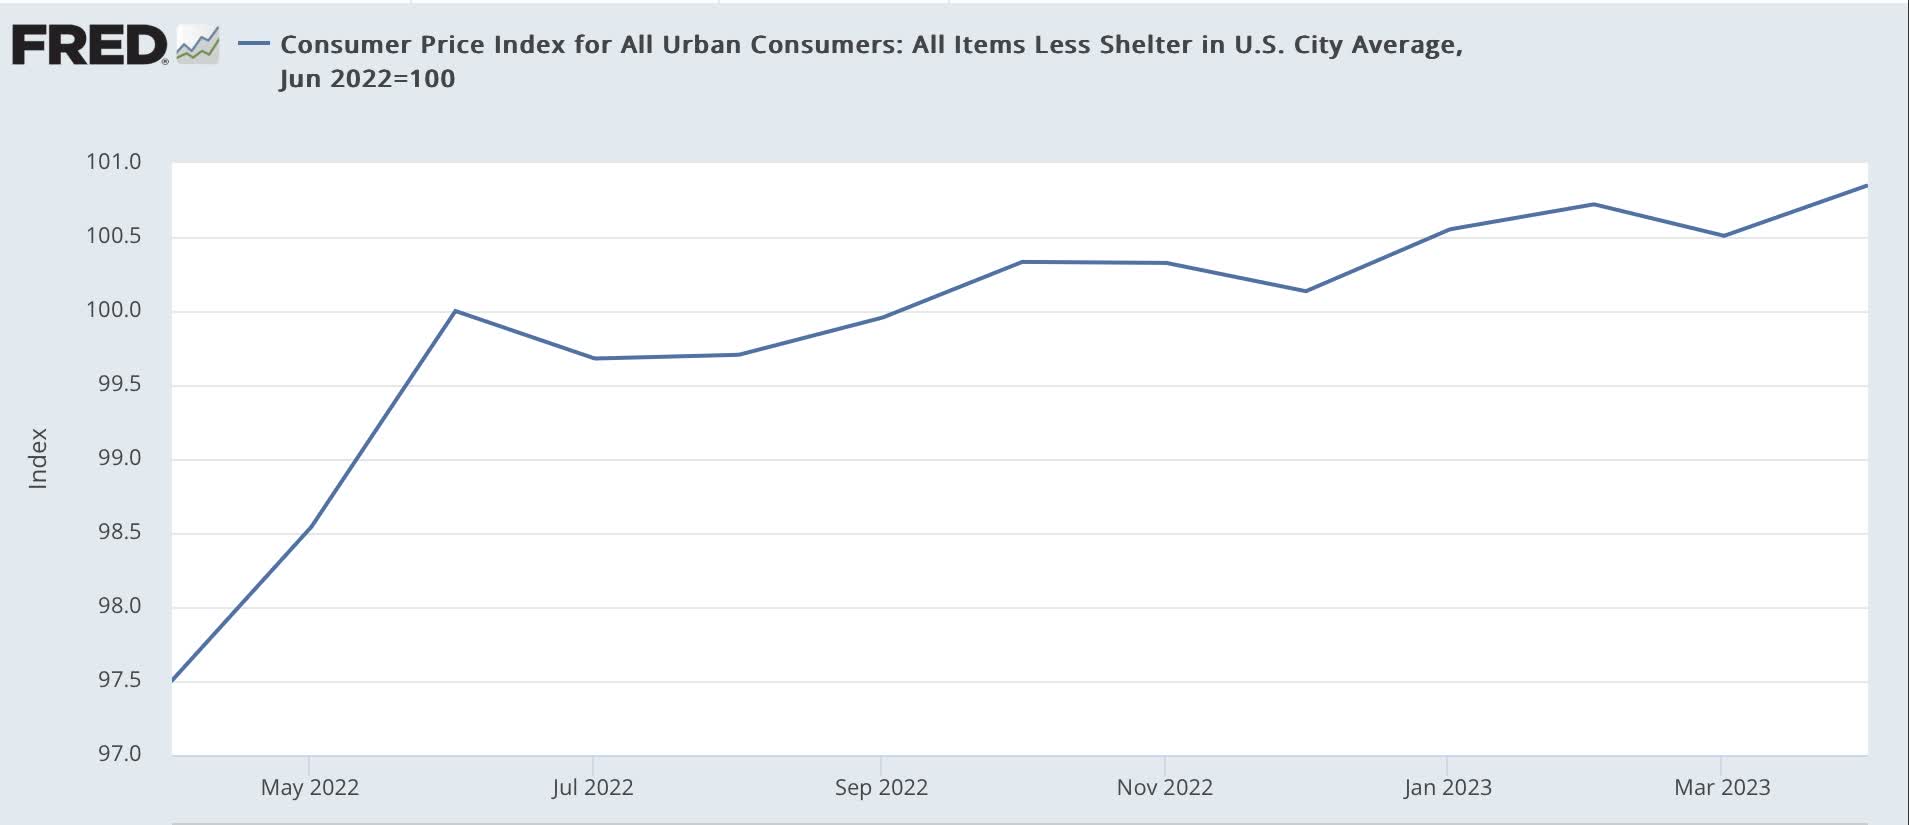
The above is all good news on the inflation front, especially since CPI ex-shelter has only risen 0.8% in the past 10 months:
CPI ex-shelter; June 2022=100 (FRED)
While I am in no position to forecast what this index will do in the future, *if* it continues at this pace, the Fed's target should be hit next winter or spring.
But the decline of less than 5% in house prices from their most unaffordable is hardly reassuring. So long as there is a shortage of housing, if the Fed reacts by cutting interest rates it will only re-ignite sharp price increases - which will show up in official CPI one year later.
The best way to show that is via the Atlanta Fed's Affordability Index:
Atlanta Fed Housing Affordability Index (Atlanta Fed)
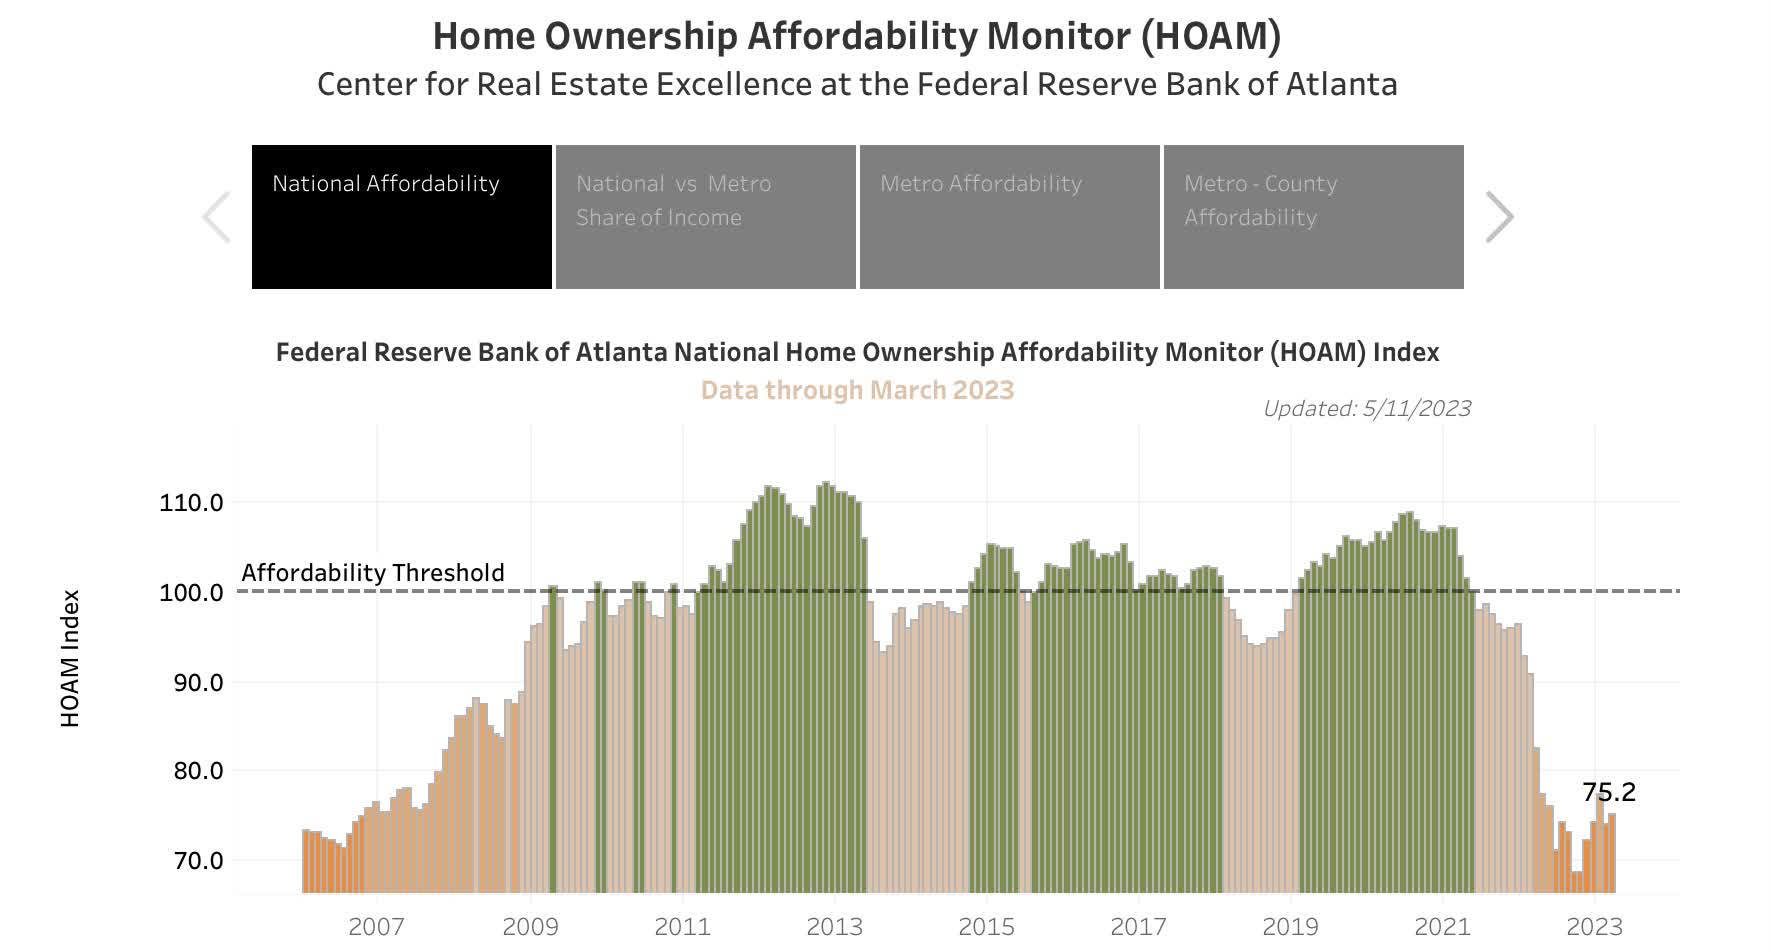
While it is off its near 20-year lows of last fall, it remains, to use a technical term, horrible. Simply put, getting affordability close to normal is the best way for the Fed to ensure that it does not remain in the vise of either spiraling rents and house prices, or sharply higher interest rates.
Conclusion
While monthly house and rent prices have stabilized, and house prices may have begun to increase at a more "normal" pre-pandemic rate, YoY house and rent prices are close to or in decline. Since these lead CPI shelter by roughly 12 months, by next spring officially measured shelter inflation is likely to be close to if not at the Fed's 2% target.
But so long as there is an overall housing shortage, rate hikes simply put a temporary lid on the pressure cooker, exacerbating the shortage in the longer term and defeating the Fed's own declared goals.
The Fed should be targeting overall affordability. Maximizing affordability means the longer-term ability to keep rates lower without igniting shelter-induced inflationary surges.
For further details see:
The Fed's Housing Conundrum