FLGR - The German DAX Has Just Hit An All-Time High And This Is Why
2023-05-25 03:55:18 ET
Summary
- The German DAX has hit an all-time high despite an energy crisis, inflation, and the Ukraine war.
- An examination of the national accounts shows why this amazing result has taken place despite all the negative real news.
- The private domestic sector is enjoying a twin surplus from federal government spending and a strong external sector.
- Aggregate demand is enjoying a three-way boost from federal government spending, the external sector, and bank credit creation.
The purpose of this article is to examine the background reasons why the German stock exchange, known as the DAX, made a new all-time high this week just gone. This will be done by examining the national accounts on a sectoral balance approach after the work of economist Wynne Godley.
Wynne Godley recalled how he came to appreciate this identity in his book Monetary Economics with Marc Lavoie. In Background Memories (W.G.) he wrote:
...In 1970 I moved to Cambridge, where, with Francis Cripps, I founded the Cambridge Economic Policy Group (CEPG). I remember a damascene moment when, in early 1974 (after playing round with concepts devised in conversation with Nicky Kaldor and Robert Neild), I first apprehended the strategic importance of the accounting identity which says that, measured at current prices, the government's budget deficit less the current account deficit is equal, by definition, to private saving net of investment.
The private saving net of investment is the private domestic sector where the asset markets such as stocks, bonds, and real estate are located and can benefit from a strong growing positive financial balance.
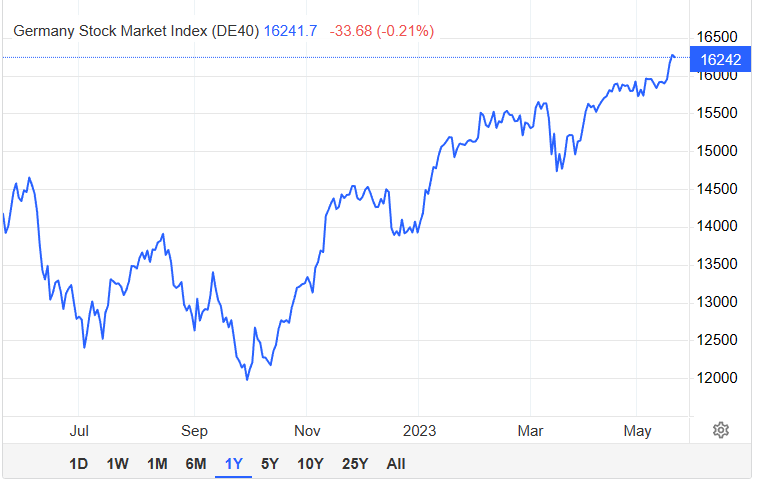
The chart below shows the DAX trading range over the last year.
Back in 2019, I wrote this article that predicted that there would be a turnaround in Germany and that indeed it would do well and it has done so despite COVID and the Russian invasion of Ukraine.
The most remarkable thing is that the DAX has achieved this new all-time high against a background of inflation, rising interest rates, refugee intakes, an energy crisis as it is cut off from cheap Russian oil and gas energy supplies, and other Ukraine war-related shortages and demands.
A look at the national accounts reveals why the stock market has been able to climb as well as it has.
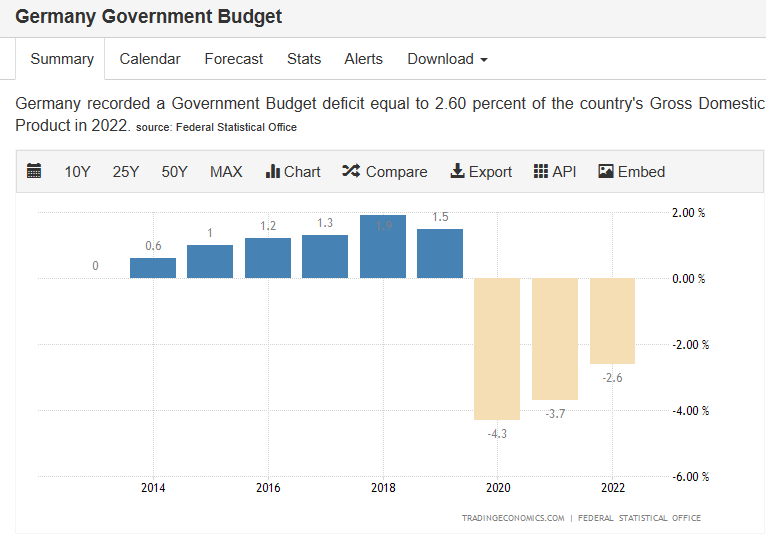
The chart above shows the German national budget since 2014 and is expressed as a percentage of GDP. Normally the Germans run a fiscal surplus, shown in blue on the chart. This means that at the macro level, the German national government is removing money from the economy and holding it back. The surplus is commonly achieved by under-investing in public goods such as health, education, and infrastructure which damage a country's long-term well-being and is often hotly debated in the local press and parliament there.
For the last three years, the reverse has occurred. The chart shows yellow fiscal deficit bars. This means that the German national government has been spending into the domestic economy causing financial balances to rise in the private sector.
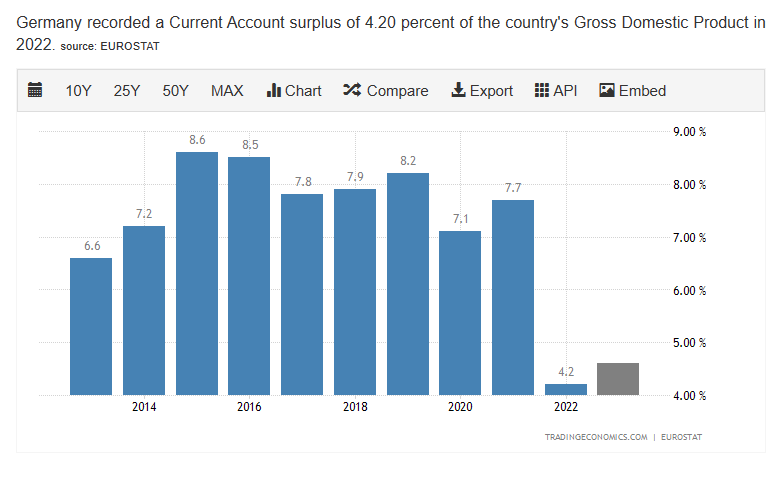
The chart above shows the current account and is expressed as a percentage of GDP. Germany is well known as an export superstar and while exports as a share of GDP have fallen sharply in 2022, it is still positive, adding 4.2% of GDP to the economy.
When one takes both sets of data one can work out the private sector domestic balance being all that money flowing into the private domestic sector where assets markets are located.
The national government is represented by the letter G and is 2.6% of GDP.
The external sector is represented by the letter X and is 4.2% of GDP.
The private domestic sector is represented by the letter P and we must use the other information to solve for it.
The equation is:
P = G + X.
This is an accounting term correct by definition and to solve it we add in the real figures for 2022:
P = 2.6 +4.2 = 6.8%
The private domestic sector balance is the sum of all that money that flowed into the private sector from the government sector and the external sector as a % of GDP. So for 2022, the government sector was 2.6% of GDP inflow as shown in the chart. And for the external sector X the inflow was 4.2% of GDP and when you add those together you get 6.8% of GDP.
The private domestic sector had an inflow of money in 2022 equal to 6.8% of GDP.
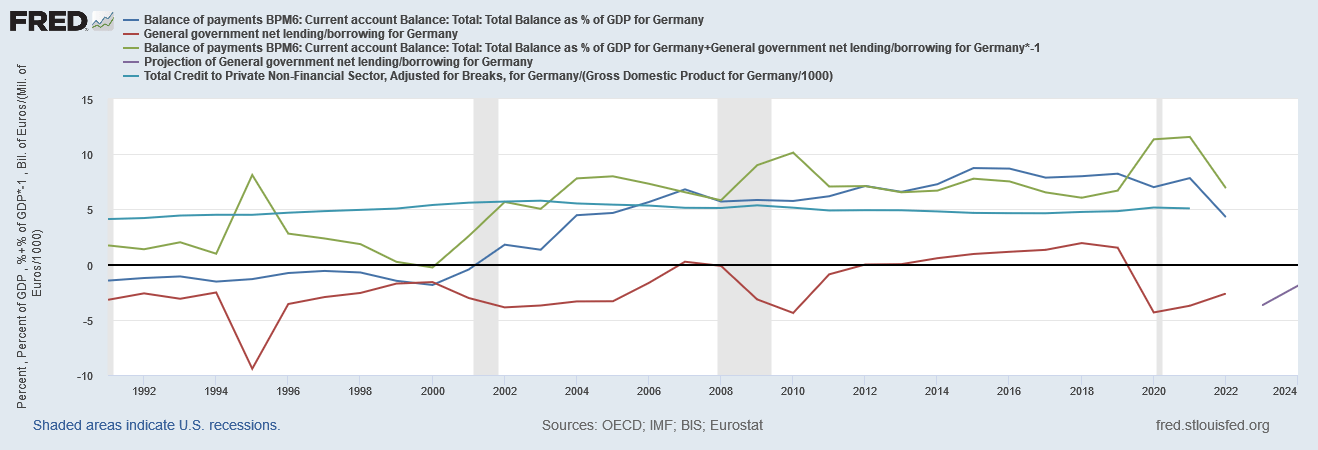
When one charts the sectoral balances on the FRED website the following butterfly diagram appears.
One sees the symbiotic relationship of the sectoral flows. The green line, which we have identified as P in the above equation is the private domestic sector balance and one sees that it is in surplus and that in the years between 2019 and 2021, it expanded outwards and increased to around 10% of GDP. The green line is produced by adding the input from the red national government [G] spending line and the dark blue external [X] sector line. The green line expands outwards by the sum of the red line and the dark blue line in perfect symmetry.
One can see here visually and interactively using this link how the sectoral balances are correct by accounting definition. A case of perfect mathematics.
In that space where the green line was able to expand the DAX was given the fuel it needed to make an all-time new high.
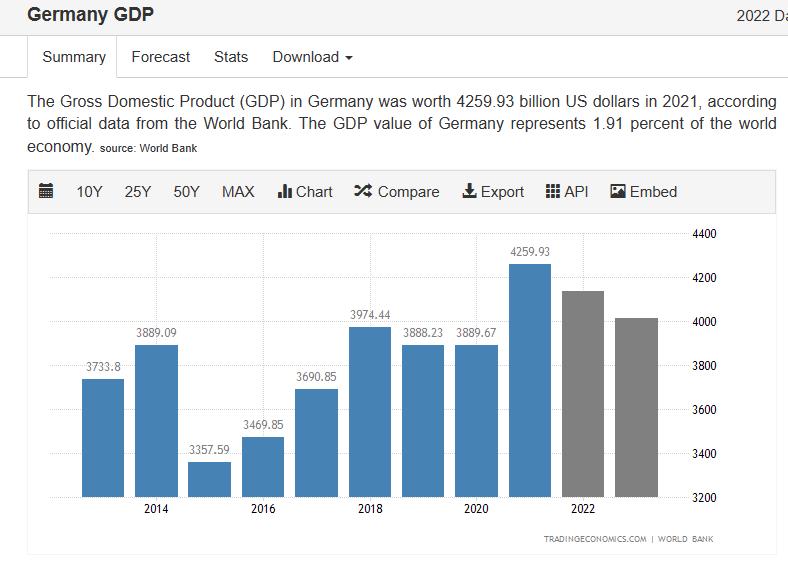
The chart above shows the German GDP expressed as billions of . In lieu of an official number for GDP in 2022 we can take the result for 2021 to estimate what the contribution of 6.8% of GDP was for 2022.
6.8% of GDP is $289+B of money inflows to the private domestic sector.
It is likely that the actual GDP figure for 2022 when it comes out, will show growth rather than the gloomy decline forecast by the gray bars above, and be in the region of $4259.93B + $289.67B = $4549.6B.
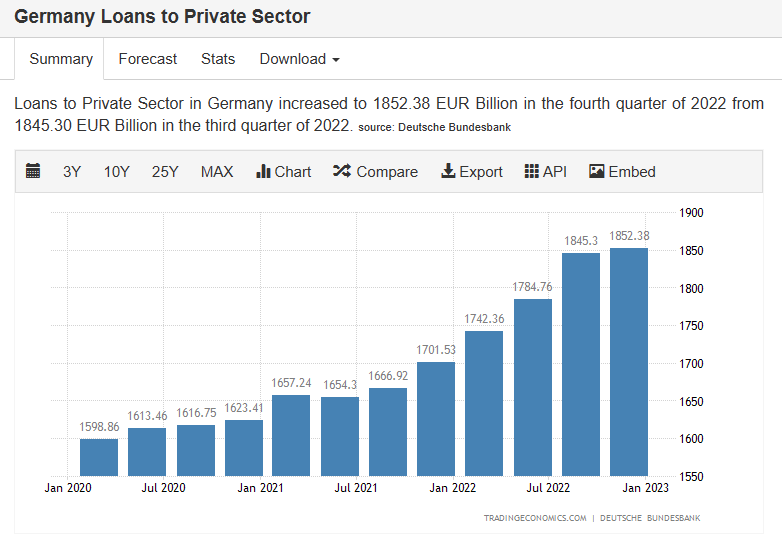
To get an estimate of aggregate demand for the same period we have to add on money creation from bank credit. Bank credit is shown in the chart below.
Between January 2021 and January 2022, a total of $78B of bank credit growth occurred. Bank credit as a percentage of GDP is 78/4259 x 100 = 1.8%.
Bank credit is represented by the letter C.
The equation for aggregate demand is:
G + X + C
So when we fill in the numbers we get the following result:
2.6 + 4.2 + 1.8 = 8.6% of GDP, which is pretty strong. Numerically this is $366.2B and so the actual GDP result for 2022 will be $4625.2B. Most likely the result will lie between the two as not all results are taken at face value in the national accounts.
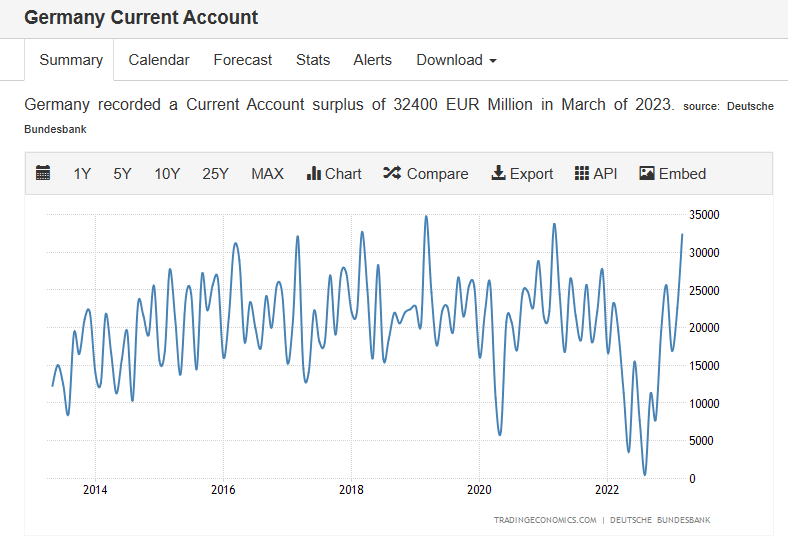
Looking to the future and the possibility of investing in the DAX and coming out in front one thing that stands out quite strongly is the dramatic recovery of the external sector.
The chart above shows the current account for the last quarter and shows that it has made a meteoric return to its former highs and will once again represent 7 to 8 percent of GDP as it has in former times before COVID and the Russian invasion of Ukraine. If the government input can be maintained, despite its current falling trend, the private sector domestic balance could get as high as 9 to 10 percent of GDP which is about the highest in the world for a developed modern economy. If this is the case then one can expect asset markets to continue making all-time new highs for as long as the private domestic sector can stay strong and positive and growing.
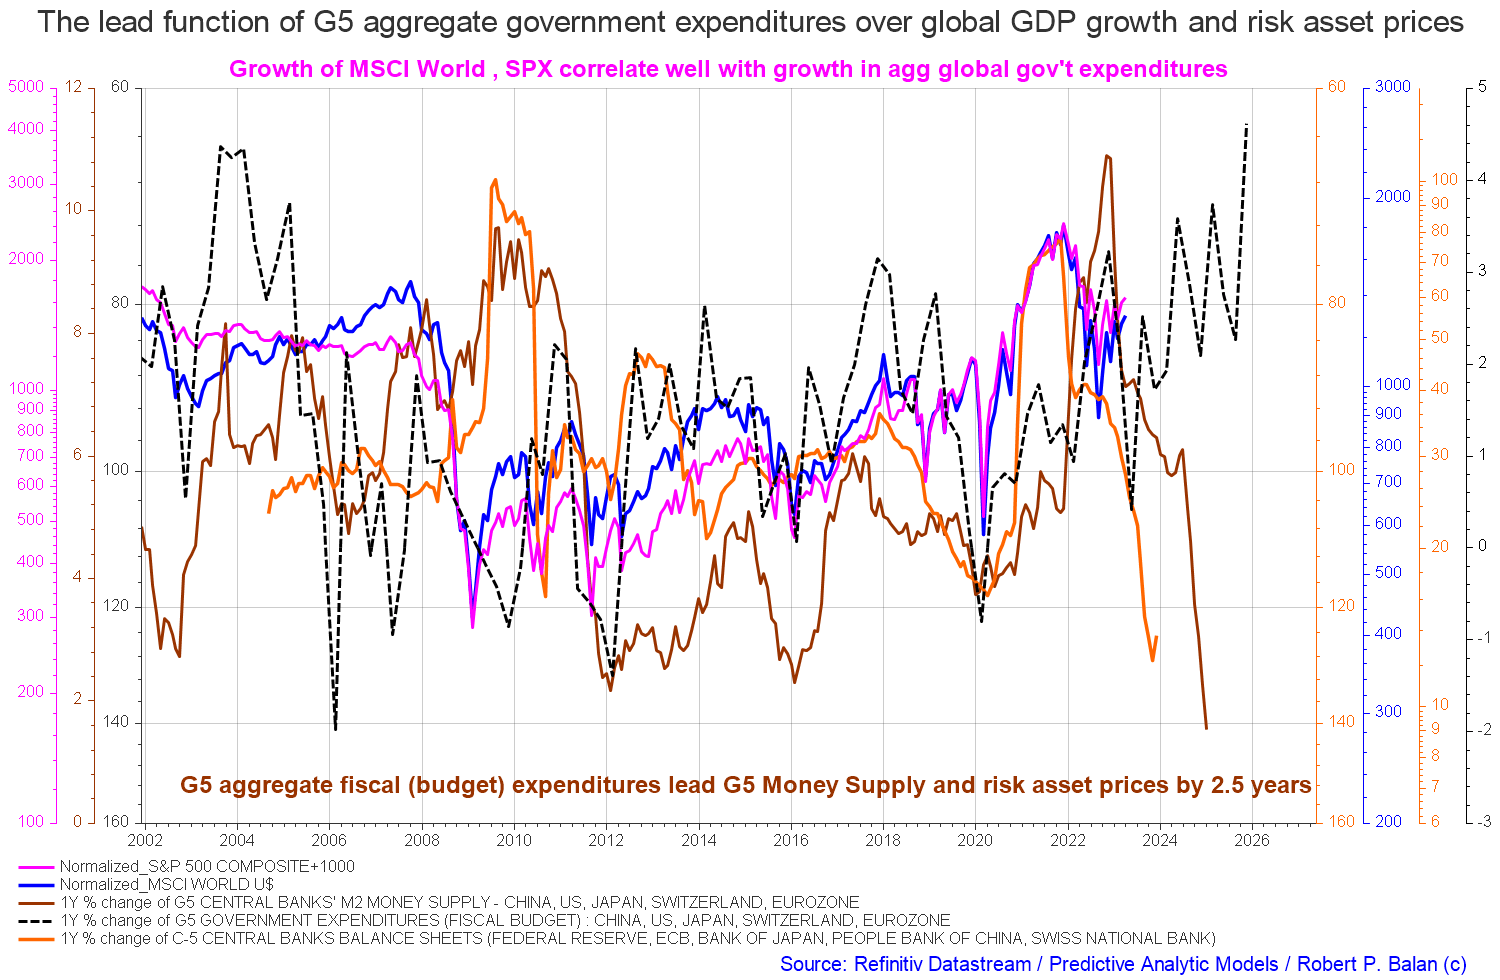
The chart below is from Predictive Analytic Models and contributed by Mr. Robert P Balan of that service and shows the combined spending power of the five largest central banks. This includes the European Central Bank as the issuer of the Euro, the currency used by Germany.
The end of the pink SPX ( SPX ) line and the blue ( MSCI ) shows the present point in time. The other lines have been brought forward as they are proven leading indicators.
The dotted black line shows the combined expenditures of the 5 largest governments in the world, and this includes Germany. One sees at first glance that the amount is rising from left to right. From a macro perspective, and despite the divergence of the orange and brown central bank M2 money supply and bank balance lines, the markets follow the dotted black G5 expenditure line the most consistently and this gives the German stock market a strong macro under current upwards.
An investor wishing to trade stock market movements in Germany could do so using the following German ETF funds that mirror the broad stock market index:
| ( EWG ) |
| iShares MSCI Germany ETF |
| ( HEWG ) |
| iShares Currency Hedged MSCI Germany ETF |
| ( FGM ) |
| First Trust Germany AlphaDEX Fund |
| ( DXGE ) |
| WisdomTree Germany Hedged Equity Fund |
| ( EWGS ) |
| iShares MSCI Germany Small-Cap ETF |
| ( DBGR ) |
| Xtrackers MSCI Germany Hedged Equity Fund |
| ( DAX ) |
| Global X DAX Germany ETF |
| ( FLGR ) |
| Franklin FTSE Germany ETF |
| ( GRMY ) |
| Xtrackers Germany Equity ETF |
For further details see:
The German DAX Has Just Hit An All-Time High And This Is Why