VTV - The Granddaddy Of Sentiment Indicators Is Pointing To Higher Prices
2023-05-21 06:10:55 ET
Summary
- The granddaddy of investor surveys, which goes back 60 years, is the Investors Intelligence survey of newsletter writers. It’s pointing to continuing higher prices.
- History shows that major lows in the stock market are best located using measurements of market sentiment than any economic series or data.
- I have looked for an economic metric that can consistently point to lows in the market as reliable as the sentiment indicator below, but can't find one.
History shows that major lows in the stock market are best found using market sentiment than any economic series. I have looked for an economic metric that can consistently point to lows in the market as reliable as the Investors Intelligence Survey of Newsletter writers shown below and can't find any.
The Investors Intelligence Survey
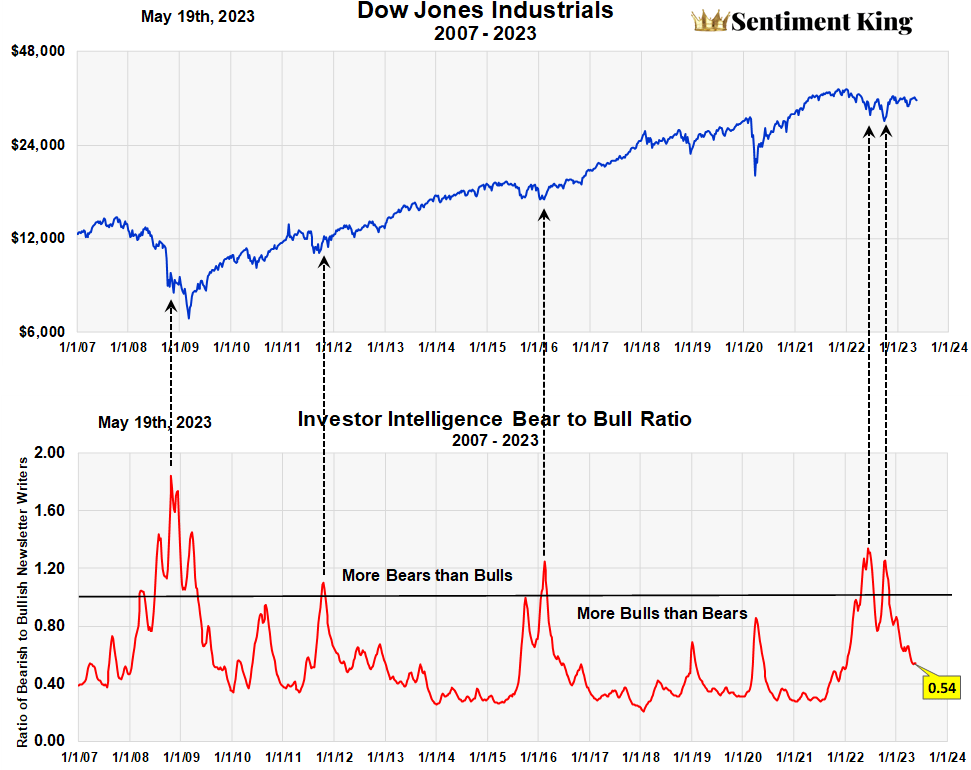
The granddaddy of all investor surveys, which goes back 60 years, is the Investors Intelligence survey of newsletter writers. Each week they categorized newsletter writers as either bullish, bearish, or “looking for a correction.” The Sentiment King divides the number of “bears” by the number of “bulls” to form a ratio, which is plotted by the red line. The chart shows sixteen years of history.
The Investors Intelligence Bear to Bull Ratio (Sentiment King)
As the graph shows, the ratio is usually far below 1.0, meaning a lot more “bulls” than “bears,” but occasionally the ratio spikes above the black line, which indicates periods when there are more “bears” then “bulls.” We've indicated these moments with black dashed arrows and explained this in this December 16th article . We now want to bring this classic indicator up to date.
Where Investment Newsletter Writers Stand Today
The graph clearly shows that the ratio has been slowly falling since reaching the two peak readings of 1.34 and 1.26 last year. It's now at .54, which means there are now about twice as many bulls then bears. This decline in the ratio is normal as the market rallies off bear market lows. You can see this by looking at what happened to the ratio at other major lows in the past.
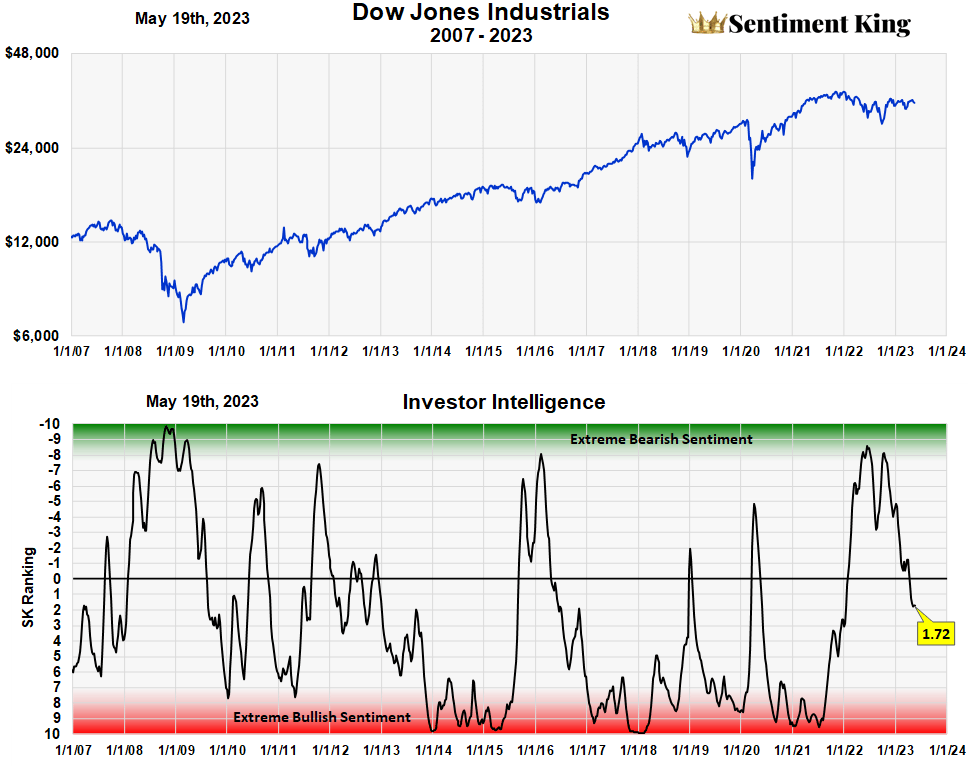
It is customary for the ratio to decline for a year or two years, reaching ratios as low as .25, which means four times more bulls than bears. However, it's hard to see what a ratio of .54 means from an historical perspective using this chart. It’s easier to see it using the Sentiment King ranking scale, shown below.
Investors Intelligence Ratio Plotted on the Sentiment King Ranking Scale (Sentiment King)
The Sentiment King ranking scale shows that the current ratio of .54 is near the middle of historical ratios. That's what 1.72 means. It means an investor needn't worry about a top in the market at this time. This indicator would have to work it way closer to the bullish extremes (red zone) before that occurred.
So the current neutral reading means that last year's strong buy signals are still in force. In fact, it indicates to us that the market is continuing to climb the investor "wall of worry."
Doubt and Worry
The term "wall of worry" is best explained by this quote from the article, "Wall of Worry or Another Brick Wall?" by David Kuo.
So, what exactly is this wall of worry? Quite simply, it is an investment phrase to describe a period of improving stock market performance at a time when logic would suggest that it shouldn’t really be happening. In other words, markets will rise even if there are still people out there who remain unconvinced that the world can pull itself out of an economic slump.
This slow decline in the ratio of Investors Intelligence "bears" to "bulls" is actually measuring this wall of worry. Even after a seven month rally, there are still quite unconvinced bears. This reluctance is normal and confirms the opinion that prices are headed higher.
For further details see:
The Granddaddy Of Sentiment Indicators Is Pointing To Higher Prices