RSF - The 'High-High-Low' Closed-End Fund Report July 2022
- Only funds with yields over 6.5%, coverage higher than 85% and trading at under a +5% premium are considered.
- Top lists of discount, yield, DxY and DxYxZ are given.
- The top DxY funds are HFRO, TEI and BGH.
Author's note: This article was released to CEF/ETF Income Laboratory members on August 2, 2022. Please check the latest data before investing.
"High-High-Low" Closed-End Fund Report
Quantitative screens help to rapidly narrow down attractive candidates from the database of 500+ closed-end funds (CEFs) for further due diligence and investigation. The "High-High-Low" report was inspired by a member of CEF/ETF Income Laboratory, who wrote:
Stanford, you should do a follow-up article on CEF that distribute 8%+, have 90% or more coverage and trade under NAV. What does that look like in today's world? How many funds are doing that?
What are the Z scores? I think many investors would be interested who are pushing for higher yield to identify best-in-class of aggressive funds that are coming close to covering dividends. Allows people to reevaluate risk/reward.
The "High-High-Low" report, therefore, screens for the following three attributes that we would like to screen for:
- High distributions (>6.5%) (i.e., 6.5% or higher yields)
- High coverage (>85%) (i.e., 85% or better coverage)
- Low premium/discount value (<+5%) (i.e., trading at a +5% premium or less)
Note that the above thresholds are subject to change, based on the number of eligible CEFs there are that satisfy all three of the criteria. I try to aim for a minimum of at least 20 eligible funds so that the "top 10" list actually means something (top 50% of the screen).
As for the Quality CEF report, I should mention some caveats about using coverage as a screen. Firstly, the coverage ratios are calculated using earnings data from CEFConnect. No efforts have been made to independently verify the coverage ratios from the individual fund annual/semi-annual reports themselves. Secondly, having a coverage ratio >90% does not guarantee that the fund's distribution is secure. Many funds reduce their distributions periodically in line with market conditions in order to maintain good coverage. Thirdly, a coverage cut-off ratio of 90% is, ultimately, an arbitrary number. A fund with 89.9% coverage will be excluded from the rankings, whereas funds with 90.1% coverage will be considered, even though only a sliver of difference separates the two.
The coverage ratio is calculated by dividing the earnings/share number provided by CEFConnect on the "distributions" tab by the distribution/share. CEFData also provides earnings coverage numbers as well.
I should also note that having both high yields and less than 100% coverage (though greater than 80%) makes this a more aggressive screen compared to the Quality report (which only selects for >100% coverage). Furthermore, note that because the universe of eligible funds is pretty small, some of the CEFs will appear in multiple top lists, just in a different order...
I hope that these rankings of "high-high-low" CEFs will provide fertile grounds for further exploration.
Key to table headings:
P/D = premium/discount
Z = 1-year z-score
Cov = coverage
1Y NAV = 1-year NAV total return
Lev = leverage
BE = baseline expense
Data were taken from the close of July 29, 2022.
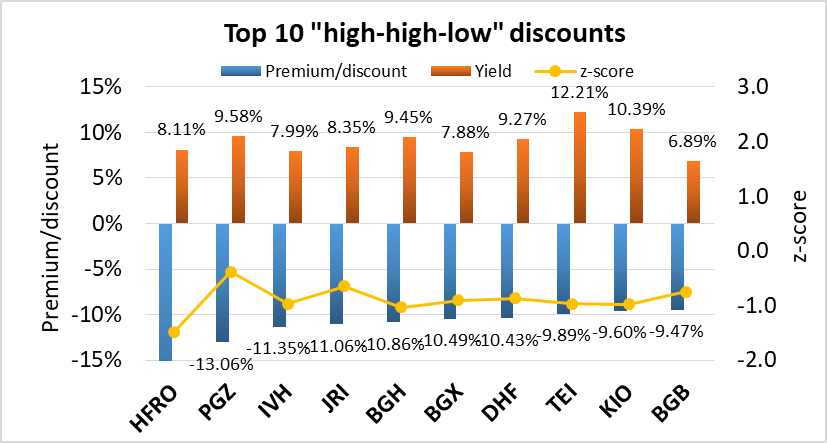
1. Top 10 widest "high-high-low" discounts
The following data show the 10 CEFs with the widest discounts, yield >6.5% and coverage >85%. Z-scores, leverage and baseline expense are shown for comparison.
| Fund |
| Ticker |
| Category |
| P/D |
| Yield |
| Z |
| Cov |
| 1Y NAV |
| Lev |
| BE |
| Highland Floating Rate Opportunities Fd |
| ( HFRO ) |
| Senior Loans |
| -25.81% |
| 8.11% |
| -1.5 |
| 116% |
| 18.1% |
| 11% |
| 1.61% |
| Principal Real Estate Income Fund |
| ( PGZ ) |
| Real Estate |
| -13.06% |
| 9.58% |
| -0.4 |
| 100% |
| -9.2% |
| 33% |
| 2.15% |
| Ivy High Income Opportunities Fund |
| ( IVH ) |
| High Yield |
| -11.35% |
| 7.99% |
| -1.0 |
| 110% |
| -17.6% |
| 30% |
| 1.51% |
| Nuveen Real Asset Inc and Grwt |
| ( JRI ) |
| Global Allocation |
| -11.06% |
| 8.35% |
| -0.6 |
| 86% |
| -8.3% |
| 32% |
| 1.47% |
| Barings Global Short Duration High Yield |
| ( BGH ) |
| High Yield |
| -10.86% |
| 9.45% |
| -1.0 |
| 122% |
| -13.0% |
| 30% |
| 1.62% |
| Blackstone Long-Short Credit Income |
| ( BGX ) |
| Senior Loans |
| -10.49% |
| 7.88% |
| -0.9 |
| 112% |
| -10.2% |
| 41% |
| 2.43% |
| BNY Mellon High Yield Strategies Fund |
| ( DHF ) |
| High Yield |
| -10.43% |
| 9.27% |
| -0.9 |
| 103% |
| -19.8% |
| 33% |
| 1.28% |
| Templeton Emerg Mkts Income |
| ( TEI ) |
| Emerging Market Income |
| -9.89% |
| 12.21% |
| -1.0 |
| 92% |
| -23.0% |
| 12% |
| 1.22% |
| KKR Income Opportunities Fund |
| ( KIO ) |
| High Yield |
| -9.60% |
| 10.39% |
| -1.0 |
| 106% |
| -16.7% |
| 42% |
| 1.32% |
| Blackstone Strategic Credit |
| ( BGB ) |
| Senior Loans |
| -9.47% |
| 6.89% |
| -0.7 |
| 108% |
| -9.8% |
| 39% |
| 1.32% |
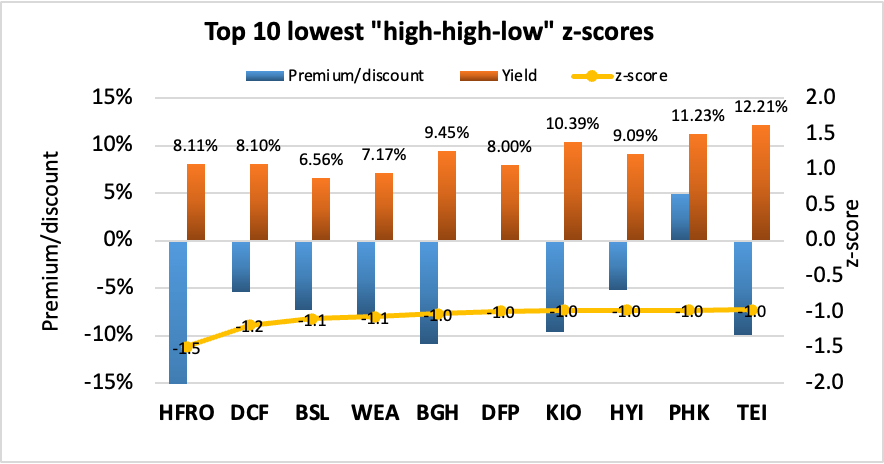
2. Top 10 lowest "high-high-low" z-scores
The following data show the 10 CEFs with the lowest z-scores, yield >6.5%, coverage >85% and premium/discount <+5%. Leverage and baseline expense are shown for comparison.
| Fund |
| Ticker |
| Category |
| Z |
| P/D |
| Yield |
| Cov |
| 1Y NAV |
| Lev |
| BE |
| Highland Floating Rate Opportunities Fd |
| ( HFRO ) |
| Senior Loans |
| -1.5 |
| -25.81% |
| 8.11% |
| 116% |
| 18.1% |
| 11% |
| 1.61% |
| BNY Mellon Alcentra Gl Crd Inc 2024 Tgt |
| ( DCF ) |
| Multisector Income |
| -1.2 |
| -5.42% |
| 8.10% |
| 88% |
| -15.0% |
| 33% |
| 1.65% |
| Blackstone Senior Floating Rate Term |
| ( BSL ) |
| Senior Loans |
| -1.1 |
| -7.33% |
| 6.56% |
| 108% |
| -7.8% |
| 35% |
| 1.32% |
| Western Asset Premier Bond |
| ( WEA ) |
| Investment Grade |
| -1.1 |
| -8.03% |
| 7.17% |
| 110% |
| -18.2% |
| 33% |
| 0.94% |
| Barings Global Short Duration High Yield |
| ( BGH ) |
| High Yield |
| -1.0 |
| -10.86% |
| 9.45% |
| 122% |
| -13.0% |
| 30% |
| 1.62% |
| Flah & Crum Dynamic Pref & Income Fund |
| ( DFP ) |
| Preferreds |
| -1.0 |
| -0.06% |
| 8.00% |
| 117% |
| -16.2% |
| 37% |
| 1.06% |
| KKR Income Opportunities Fund |
| ( KIO ) |
| High Yield |
| -1.0 |
| -9.60% |
| 10.39% |
| 106% |
| -16.7% |
| 42% |
| 2.12% |
| Western Asset High Yield Defined Opps |
| ( HYI ) |
| High Yield |
| -1.0 |
| -5.21% |
| 9.09% |
| 85% |
| -14.7% |
| 0% |
| 0.93% |
| PIMCO High Income |
| ( PHK ) |
| Multisector Income |
| -1.0 |
| 4.92% |
| 11.23% |
| 91% |
| -11.2% |
| 34% |
| 0.86% |
| Templeton Emerg Mkts Income |
| ( TEI ) |
| Emerging Market Income |
| -1.0 |
| -9.89% |
| 12.21% |
| 92% |
| -23.0% |
| 12% |
| 1.22% |
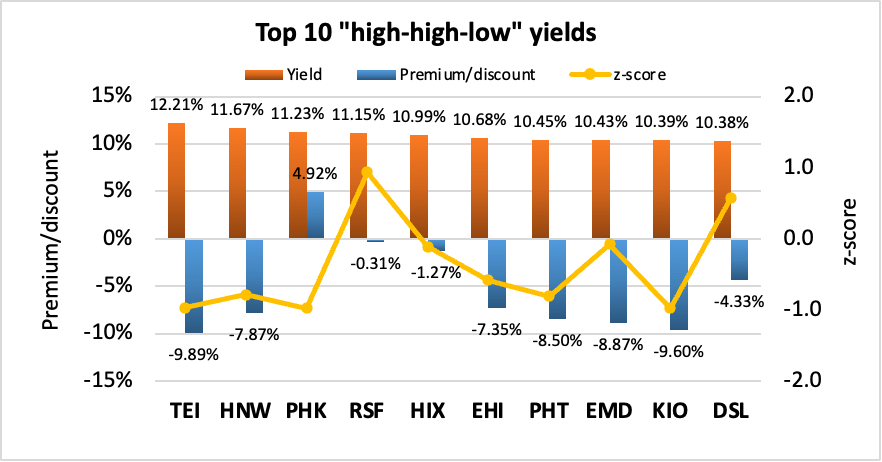
3. Top 10 highest "high-high-low" yields
The following data show the 10 CEFs with the highest yields, coverage >85% and premium/discount <+5%. z-scores, leverage, and baseline expense are shown for comparison.
| Fund |
| Ticker |
| Category |
| Yield |
| P/D |
| Z |
| Cov |
| 1Y NAV |
| Lev |
| BE |
| Templeton Emerg Mkts Income |
| ( TEI ) |
| Emerging Market Income |
| 12.21% |
| -9.89% |
| -1.0 |
| 92% |
| -23.0% |
| 12% |
| 0.88% |
| Pioneer Diversified High Income |
| ( HNW ) |
| High Yield |
| 11.67% |
| -7.87% |
| -0.8 |
| 96% |
| -16.1% |
| 35% |
| 1.58% |
| PIMCO High Income |
| ( PHK ) |
| Multisector Income |
| 11.23% |
| 4.92% |
| -1.0 |
| 91% |
| -11.2% |
| 34% |
| 0.86% |
| RiverNorth Specialty Finance |
| ( RSF ) |
| High Yield |
| 11.15% |
| -0.31% |
| 0.9 |
| 172% |
| -1.0% |
| 37% |
| 6.53% |
| Western Asset High Income II |
| ( HIX ) |
| High Yield |
| 10.99% |
| -1.27% |
| -0.1 |
| 91% |
| -22.5% |
| 33% |
| 1.27% |
| Western Asset Global High Income |
| ( EHI ) |
| High Yield |
| 10.68% |
| -7.35% |
| -0.6 |
| 103% |
| -22.5% |
| 37% |
| 1.37% |
| Pioneer High Income |
| ( PHT ) |
| High Yield |
| 10.45% |
| -8.50% |
| -0.8 |
| 107% |
| -15.4% |
| 34% |
| 1.14% |
| Western Asset Emerging Markets Debt |
| ( EMD ) |
| Emerging Market Income |
| 10.43% |
| -8.87% |
| -0.1 |
| 101% |
| -26.9% |
| 36% |
| 1.30% |
| KKR Income Opportunities Fund |
| ( KIO ) |
| High Yield |
| 10.39% |
| -9.60% |
| -1.0 |
| 106% |
| -16.7% |
| 42% |
| 1.32% |
| DoubleLine Income Solutions Fund |
| ( DSL ) |
| Global Income |
| 10.38% |
| -4.33% |
| 0.6 |
| 116% |
| -22.3% |
| 32% |
| 1.50% |
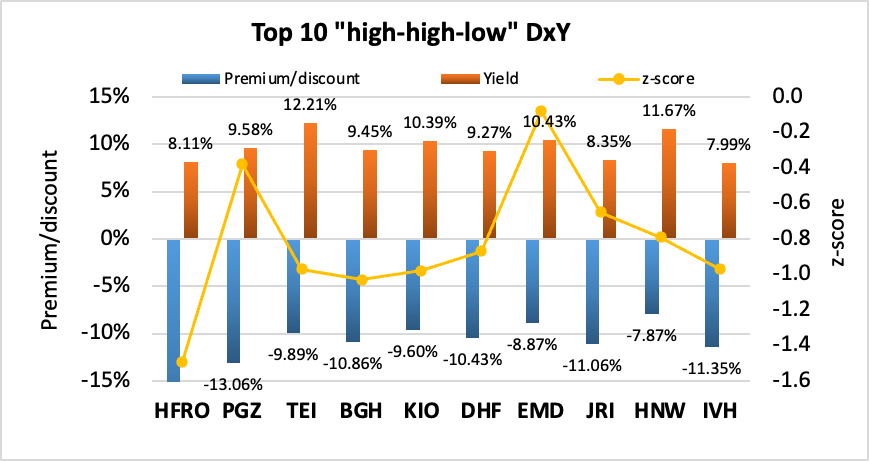
4. Top 10 best combination of "high-high-low" yield and discount
For possible buy candidates, it is probably a good idea to consider both yield and discount. Buying a CEF with both a high yield and discount not only gives you the opportunity to capitalize from discount contraction, but you also get "free" alpha as a result of the distribution being paid out. This is because paying out a distribution is effectively the same as liquidating part of the fund at NAV and returning the capital to the unitholders. I considered several ways to rank CEFs by a composite metric of both yield and discount. The simplest would be yield + discount, however, I disregarded this because yields and discounts may have different ranges of absolute values and a sum would be biased towards the larger set of values. I finally settled on the multiplicative product, yield x discount. This is because I consider a CEF with 7% yield and 7% discount to be more desirable than a fund with 2% yield and 12% discount, or 12% yield and 2% discount, even though each pair of quantities sum to 14%. Multiplying yield and discount together biases towards funds with both high yield and discount. Since discount is negative and yield is positive, the more negative the " DxY " metric, the better. Only funds with >6.5% yield, >85% coverage and <+5% premium/discount are considered.
| Fund |
| Ticker |
| Category |
| P/D |
| Yield |
| Z |
| DxY |
| Cov |
| 1Y NAV |
| Lev |
| BE |
| Highland Floating Rate Opportunities Fd |
| ( HFRO ) |
| Senior Loans |
| -25.81% |
| 8.11% |
| -1.5 |
| -2.09 |
| 116% |
| 18.1% |
| 11% |
| 1.61% |
| Principal Real Estate Income Fund |
| ( PGZ ) |
| Real Estate |
| -13.06% |
| 9.58% |
| -0.4 |
| -1.25 |
| 100% |
| -9.2% |
| 33% |
| 2.15% |
| Templeton Emerg Mkts Income |
| ( TEI ) |
| Emerging Market Income |
| -9.89% |
| 12.21% |
| -1.0 |
| -1.21 |
| 92% |
| -23.0% |
| 12% |
| 1.47% |
| Barings Global Short Duration High Yield |
| ( BGH ) |
| High Yield |
| -10.86% |
| 9.45% |
| -1.0 |
| -1.03 |
| 122% |
| -13.0% |
| 30% |
| 1.62% |
| KKR Income Opportunities Fund |
| ( KIO ) |
| High Yield |
| -9.60% |
| 10.39% |
| -1.0 |
| -1.00 |
| 106% |
| -16.7% |
| 42% |
| 2.12% |
| BNY Mellon High Yield Strategies Fund |
| ( DHF ) |
| High Yield |
| -10.43% |
| 9.27% |
| -0.9 |
| -0.97 |
| 103% |
| -19.8% |
| 33% |
| 1.28% |
| Western Asset Emerging Markets Debt |
| ( EMD ) |
| Emerging Market Income |
| -8.87% |
| 10.43% |
| -0.1 |
| -0.93 |
| 101% |
| -26.9% |
| 36% |
| 1.30% |
| Nuveen Real Asset Inc and Grwt |
| ( JRI ) |
| Global Allocation |
| -11.06% |
| 8.35% |
| -0.6 |
| -0.92 |
| 86% |
| -8.3% |
| 32% |
| 1.32% |
| Pioneer Diversified High Income |
| ( HNW ) |
| High Yield |
| -7.87% |
| 11.67% |
| -0.8 |
| -0.92 |
| 96% |
| -16.1% |
| 35% |
| 0.88% |
| Ivy High Income Opportunities Fund |
| ( IVH ) |
| High Yield |
| -11.35% |
| 7.99% |
| -1.0 |
| -0.91 |
| 110% |
| -17.6% |
| 30% |
| 1.51% |
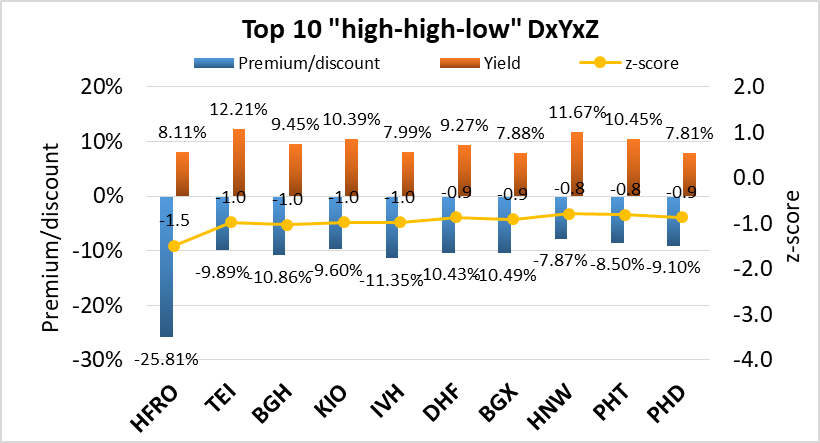
5 . Top 10 best combination of "high-high-low" yield, discount and z-score
This is my favorite metric because it takes into account all three factors that I always consider when buying or selling CEFs: yield, discount and z-score. The composite metric simply multiplies the three quantities together. As both discount and z-score are negative while yield is positive, the more positive the " DxYxZ " metric, the better. Only funds with >7% yield, >85% coverage and <+5% premium/discount are considered.
| Fund |
| Ticker |
| Category |
| P/D |
| Yield |
| Z |
| DxYxZ |
| Cov |
| 1Y NAV |
| Lev |
| BE |
| Highland Floating Rate Opportunities Fd |
| ( HFRO ) |
| Senior Loans |
| -25.81% |
| 8.11% |
| -1.5 |
| 3.12 |
| 116% |
| 18.1% |
| 11% |
| 1.32% |
| Templeton Emerg Mkts Income |
| ( TEI ) |
| Emerging Market Income |
| -9.89% |
| 12.21% |
| -1.0 |
| 1.17 |
| 92% |
| -23.0% |
| 12% |
| 1.22% |
| Barings Global Short Duration High Yield |
| ( BGH ) |
| High Yield |
| -10.86% |
| 9.45% |
| -1.0 |
| 1.06 |
| 122% |
| -13.0% |
| 30% |
| 1.47% |
| KKR Income Opportunities Fund |
| ( KIO ) |
| High Yield |
| -9.60% |
| 10.39% |
| -1.0 |
| 0.98 |
| 106% |
| -16.7% |
| 42% |
| 2.12% |
| Ivy High Income Opportunities Fund |
| ( IVH ) |
| High Yield |
| -11.35% |
| 7.99% |
| -1.0 |
| 0.88 |
| 110% |
| -17.6% |
| 30% |
| 1.51% |
| BNY Mellon High Yield Strategies Fund |
| ( DHF ) |
| High Yield |
| -10.43% |
| 9.27% |
| -0.9 |
| 0.84 |
| 103% |
| -19.8% |
| 33% |
| 1.87% |
| Blackstone Long-Short Credit Income |
| ( BGX ) |
| Senior Loans |
| -10.49% |
| 7.88% |
| -0.9 |
| 0.75 |
| 112% |
| -10.2% |
| 41% |
| 2.06% |
| Pioneer Diversified High Income |
| ( HNW ) |
| High Yield |
| -7.87% |
| 11.67% |
| -0.8 |
| 0.73 |
| 96% |
| -16.1% |
| 35% |
| 1.58% |
| Pioneer High Income |
| ( PHT ) |
| High Yield |
| -8.50% |
| 10.45% |
| -0.8 |
| 0.72 |
| 107% |
| -15.4% |
| 34% |
| 1.14% |
| Pioneer Floating Rate Fund |
| ( PHD ) |
| Senior Loans |
| -9.10% |
| 7.81% |
| -0.9 |
| 0.62 |
| 86% |
| -9.2% |
| 36% |
| 1.88% |
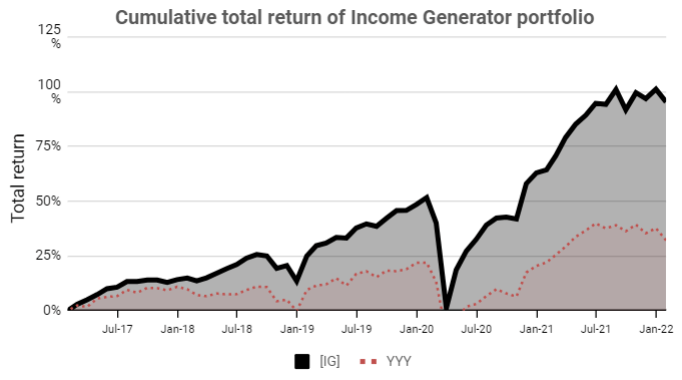
Strategy Statement
Our goal at the CEF/ETF Income Laboratory is to provide consistent income with enhanced total returns . We achieve this by:
- Identifying the most profitable CEF and ETF opportunities.
- Avoiding mismanaged or overpriced funds that can sink your portfolio.
- Employing our unique CEF rotation strategy to " double compound " your income.
It's the combination of these factors that has allowed our Income Generator portfolio to massively outperform our fund-of-CEFs benchmark ETF ( YYY ) whilst providing growing income, too (approx. 10% CAGR).
Remember, it's really easy to put together a high-yielding CEF portfolio, but to do so profitably is another matter!
For further details see:
The 'High-High-Low' Closed-End Fund Report, July 2022