T - The Inverse Jim Cramer Strategy: Q3 2022 Update
Summary
- Our Inverse Jim Cramer Strategy excelled even during the latter half of this troublesome year.
- The Mad Money host himself has once again proven to be a leading source of first-class investment advice, but only if we are to invert the recommendations.
- His investment advice helped guide generations of investors, sometimes for the better, while his critics would be quick to mention that it was often for the worse.
- In today's update, we analyze Jim's third-quarter top-mentioned stock recommendations to see how well they've faired against an ever-worsening market.
- Using the collected data, we have built a trading strategy that by design inverses of Cramer's highest conviction plays, proving so far successful in delivering market alpha.
The past couple of decades have witnessed a clear trend of stock market investing. Slowly moving away from the professionals and becoming more mainstream by the day. Major media conglomerates capitalized on this process early on by launching finance and investing-related programming that was predominantly oriented in both style and substance to the average retail investor. One of the pioneers in this space was CNBC, and there is one name that has become almost synonymous with finance TV: Jim Cramer.
His investment advice helped guide generations of investors, sometimes for the better, while his critics would be quick to mention that it was often for the worse. The man has proven year after year to be a reliable first-class source of top investment advice, but only when we invert his decision-making process. That represents the basis of our "Inverse Jim Cramer" trading strategy, which is a trading mechanism that inverts most of Cramer's top-mentioned stock recommendations and has so far proved successful in generating alpha on the market.
Today's article is an update focusing on the strategy's performance during the third quarter of the year. Our original article on the Inverse Jim Cramer Strategy can be accessed through this link .
Inverse Cramer Strategy Update
With the idea of benefitting from the datasets collected, we have created the "Inverse Cramer" Strategy, which approaches the data in a rather interesting and unique way.
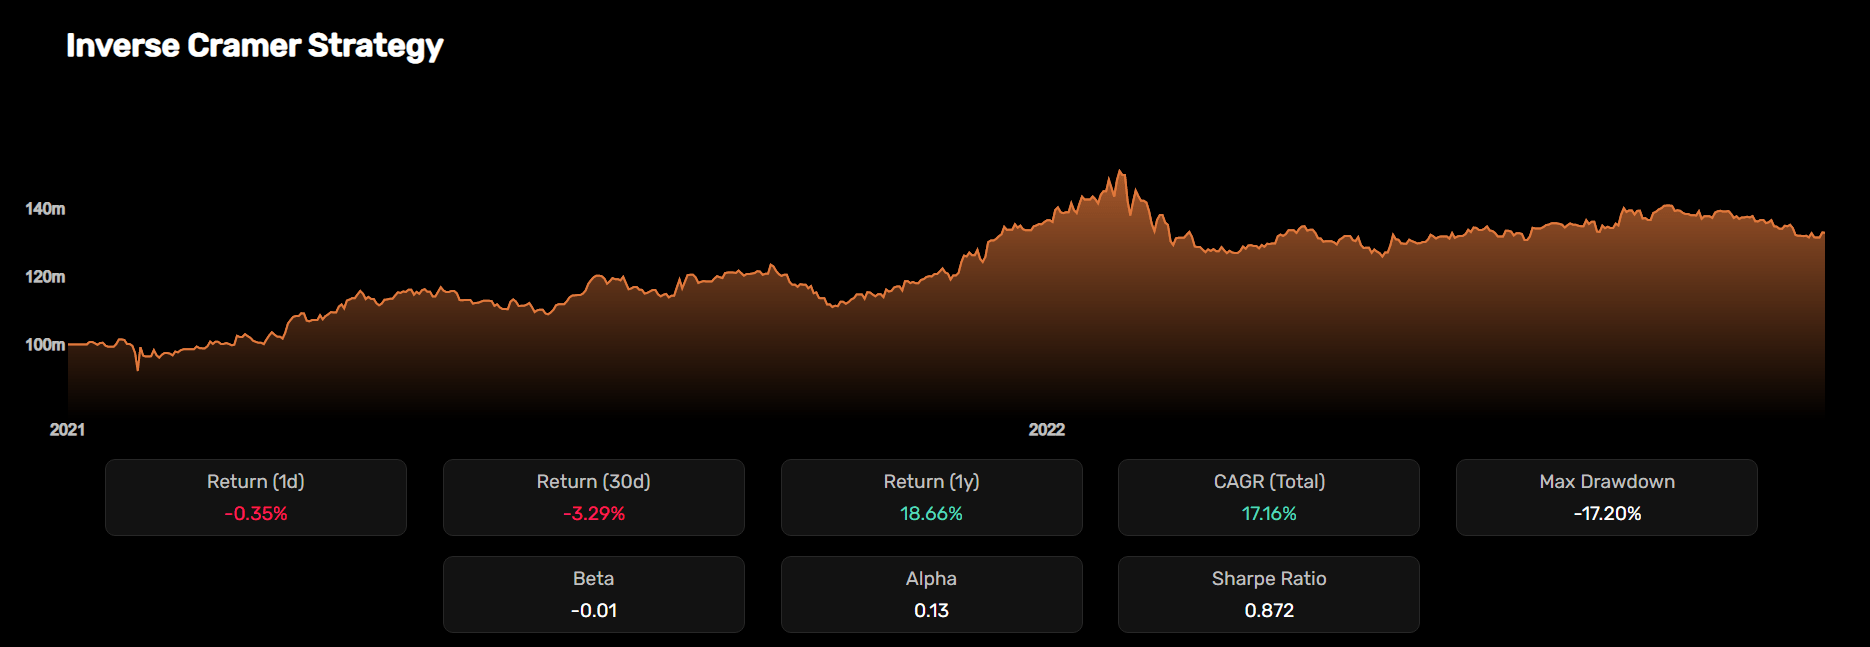
The strategy tracks the performance of companies that have been most recommended by the popular TV host over the course of the past 30 days. It does that by opening a short position in the top-most recommended companies while hedging it with a long position in the market index. The strategy uses an equal-weighted portfolio, with an implemented system of weekly rebalancing. This approach was successful in generating a CAGR rate of 17.16% given its inception date of the 1st of January 2021. The strategy generated a year-to-date return of negative 1.37%, alongside a one-year return of 18.66%. In the same period, the S&P500 ( SPY ) generated a negative year-to-date of 22.96% and a negative one-year return of 18.24% for the same period.
The Inverse Jim Cramer Strategy (Quiver Quantitative)
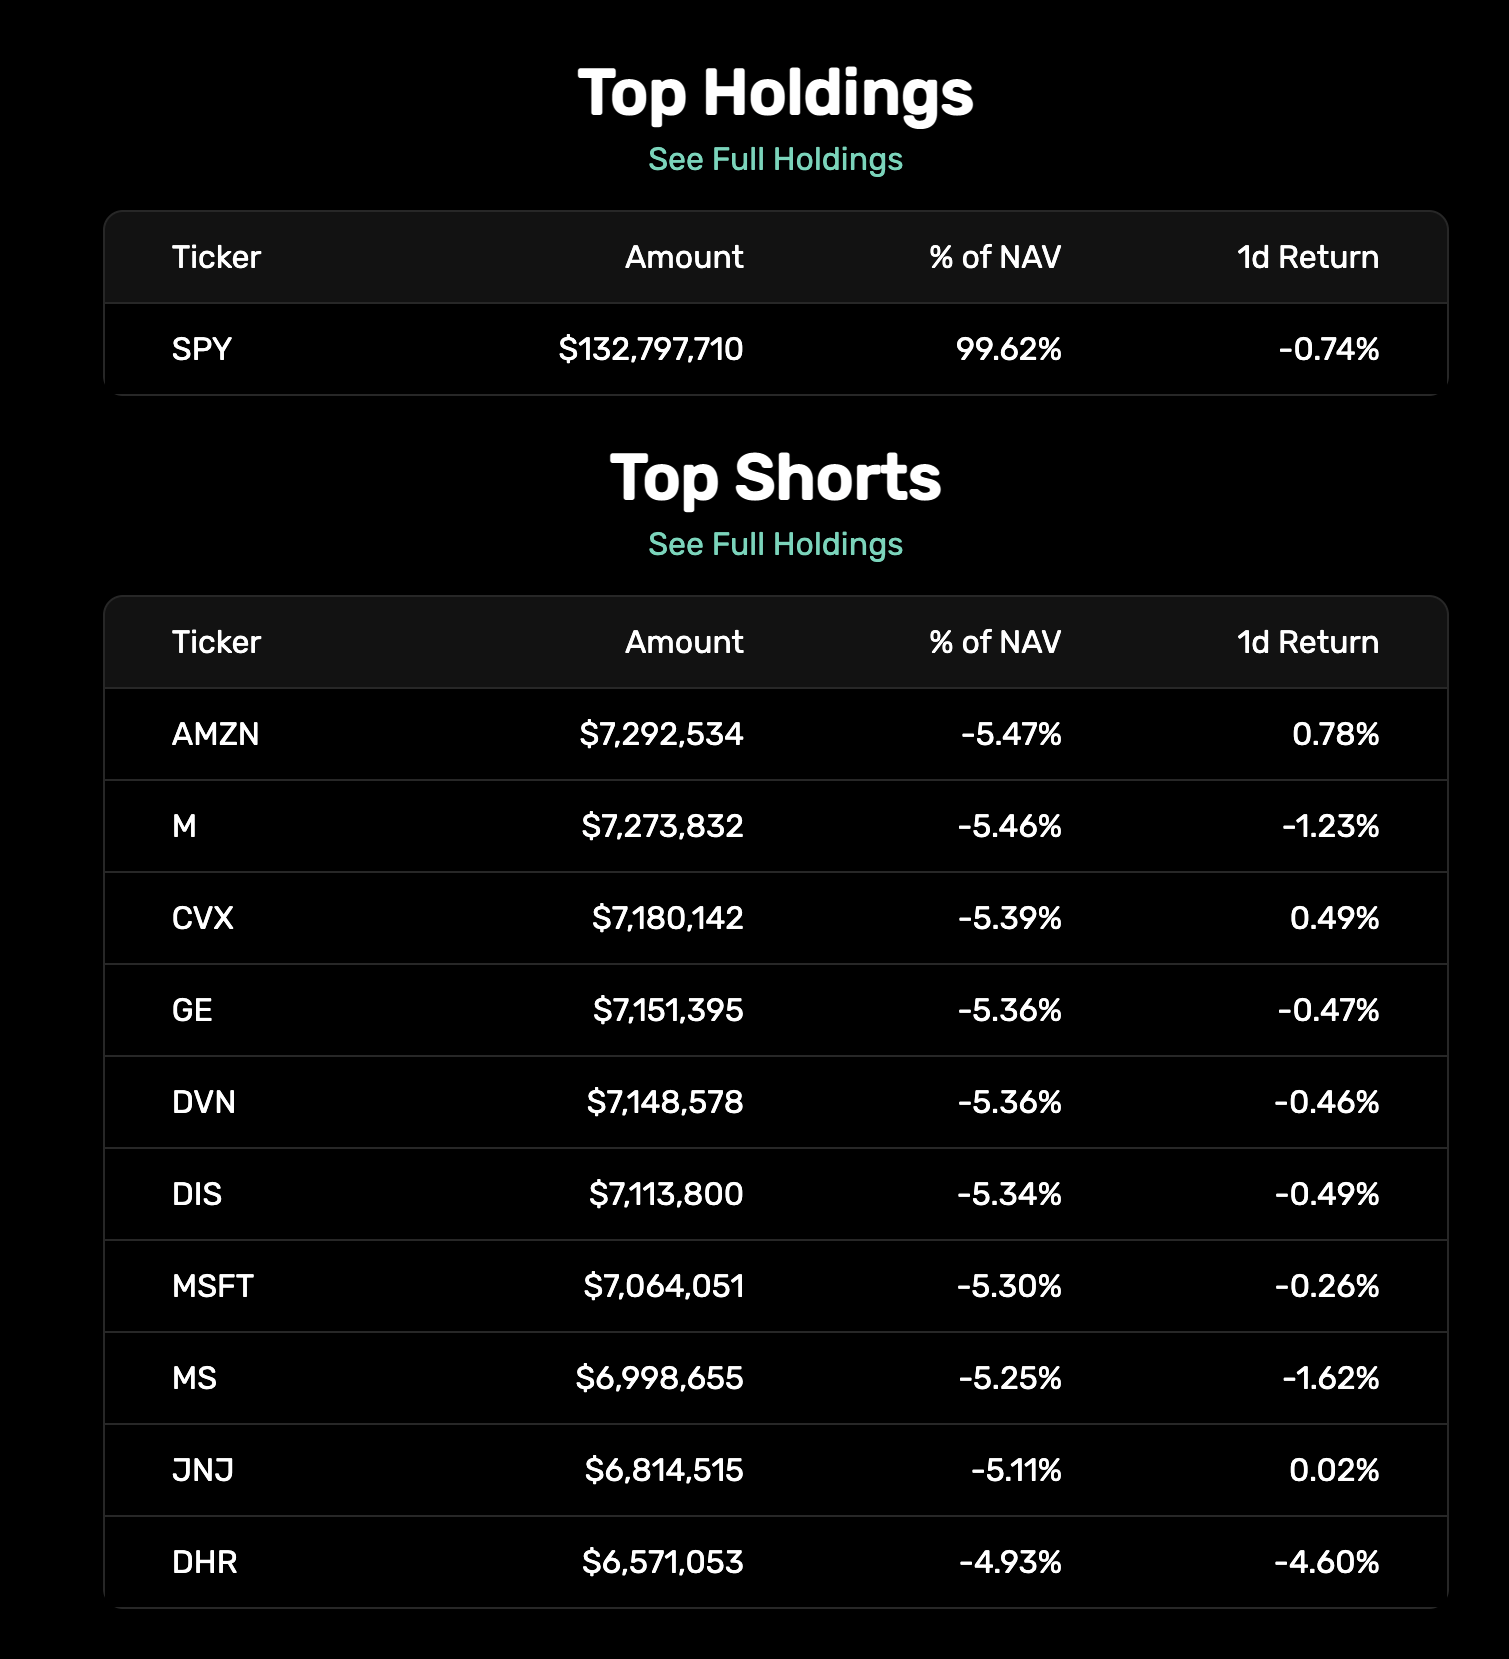
The biggest short position at the moment in the strategy is Macy's (M), with a current allocation of 5.12%. The company is shortly followed by the 5.09% short on General Electric (GE) and the 5.07% short on Devon Energy (DVN). If the average investor would have invested $100 million by inverting Jim Cramer's highest conviction stock recommendations at the beginning of 2021, the same investment would have compounded to $132 million as of today, which is slightly off the June high, when the portfolio hit its peak of almost $152 million.
Strategy Holdings (Quiver Quantitative)
The Walt Disney Company ( DIS )
The soon-to-be hundred-year-old Burbank-based integrated entertainment company has been through a rough patch for the better part of the year. On top of an already difficult year in terms of macroeconomics, the entire streaming sector is still suffering from the selloff that ensued after Netflix ( NFLX ) posted its disastrous first-quarter earnings results.
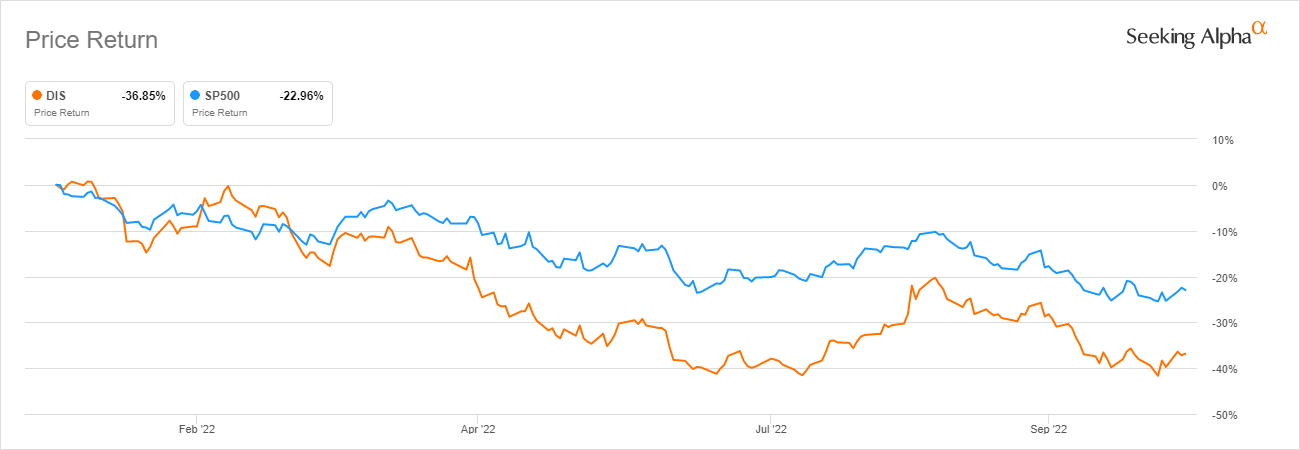
The report sheds light on several fundamental weaknesses in the streaming business model that had many investors and analysts excited for years. This is exactly when Jim Cramer took a significant interest in the company, recommending investors to buy the dip ever since. The rationale is rather simple, the Mickey Mouse company is still arguably the most well-rounded entertainment company in the industry after its rather controversial $71 billion acquisition of 20th Century Fox back in 2019. It also has a rock-solid IP portfolio that other competitors can only envy and a legacy business that will ensure cash flow stability even at the most difficult of times. Disney is trading at an NTM EV/EBITDA of 13.79x, NTM P/E of 21.09x, and NTM P/FCF of 42.10x. As previously stated, alongside essentially everything and anything streaming-related, DIS significantly underperformed the market for the year. The company generated a negative year-to-date return of 36.89% and a negative one-year return of 42.22%.
At around this time last year, Disney was trading as high as $171.18 per share. Seeking Alpha Authors remain slightly bullish on DIS, assigning it a Buy" rating with an average score of 3.56/5.00. Wall Street Analysts, on the other hand, are much more enthusiastic about Disney's prospects, assigning it a "Strong Buy" rating with an average score of 4.44/5.00. Disney remains solidified near the top of Cramer's stock shopping list, with the last time the Mad Money host recommended it just weeks ago on the 29th of September. The company is currently trading at $100.76.
Walt Disney Company vs S&P500 YTD Results (Seeking Alpha)
Macy's Inc. ( M )
Macy's is another company with an immensely rich history that found its way to the top of Cramer's wish list. The New York-based retail chain giant was founded way back in 1830 and has grown to become one of the powerhouses among high-end department stores. The company owns and operates iconic brands, including Macy’s, Bloomingdale’s, and Bluemercury, among others. Lockdowns and restrictions in early 2020 have hit its business hard, to the point of causing liquidity issues and even leading the company to post a $0.63 billion loss for the first quarter of the year. Since then, Macy's has made a successful recovery, but now new headwinds threaten their retail-oriented business model. A degrading macroeconomic environment could lead to a cut in demand as households reign in on discretionary spending.
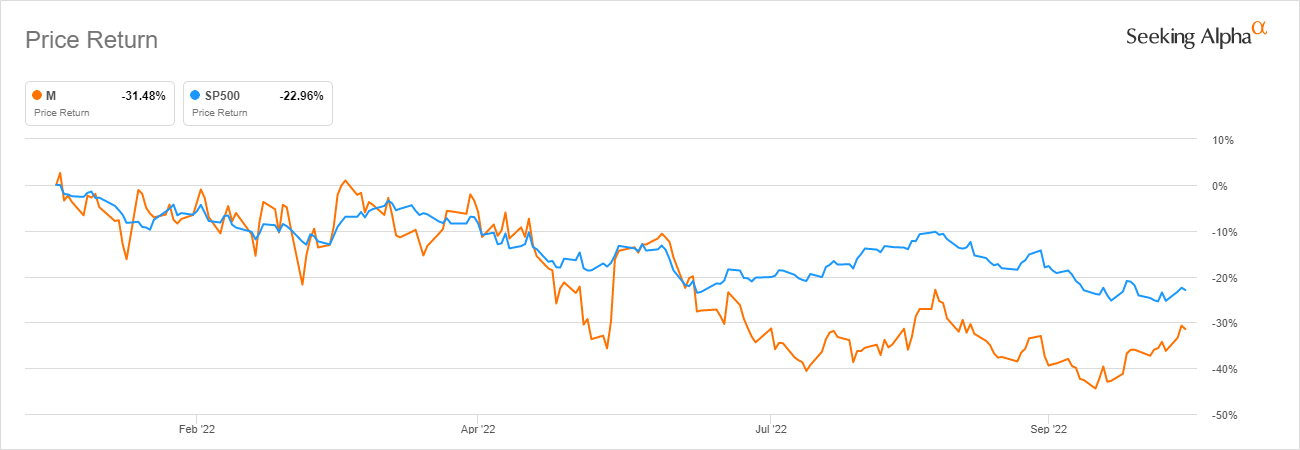
Still, Cramer remains very bullish on the business and even hosted Macy's CEO, Jeff Gennette, last Wednesday on his show. Given the difficult situation in which the company has found itself, it is no surprise it underperformed in the market, generating a negative year-to-date return of 31.63% and a negative one-year return of 29.41%. Macy's is trading at a relatively attractive valuation with an NTM EV/EBITDA of 4.74x and an NTM P/E of 5.21x. It is also selling for an astonishing 5.88x NTM P/FCF, so the value proposition remains clear in this case.
Seeking Alpha Authors have a rather positive outlook on the company, assigning it a "Buy" rating with an average score of 4.00/5.00. Still, Wall Street Analysts remain unconvinced, assigning it a "Hold" rating with an average score of 3.33/5.00. The company is currently selling at $19.51.
Macy's vs S&P500 YTD Returns (Seeking Alpha)
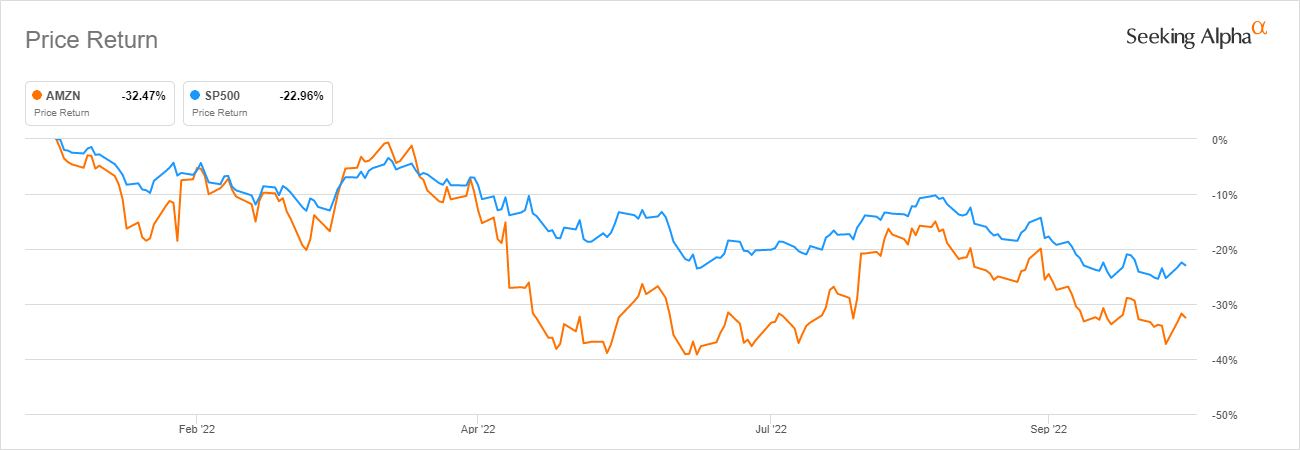
Amazon.com, Inc. ( AMZN )
Jeff Bezos's brainchild has become one of Jim's most recommended stocks as of late and has climbed right near the top of our inverse strategy holdings. Amazon, like many of the high-flying tech stocks, after generating some extraordinary returns for investors over the past couple of years, significantly underperformed the market more recently and delivered a negative 32.47% year-to-date return and a negative 33.17% one-year return. It is hard to think that the company was trading at as high as $183.83 just in November of last year. The major pullback led to perhaps the best valuation AMZN had to offer in years, as it is currently selling for an NTM EV/EBITDA of 16.15x, NTM P/E of 74.08x, and an NTM P/FCF of 43.18x.
Seeking Alpha Authors remain largely bullish about the prospects of AMZN, even after the decline, with an average rating of 3.50/5.00. On the other end, Wall Street Analysts still remain convinced and have assigned the stock a "Strong Buy" rating with an average score of 4.62/5.00. Shares of Amazon are currently trading at $118.11.
Amazon vs SYP500 YTD Results (Seeking Alpha)
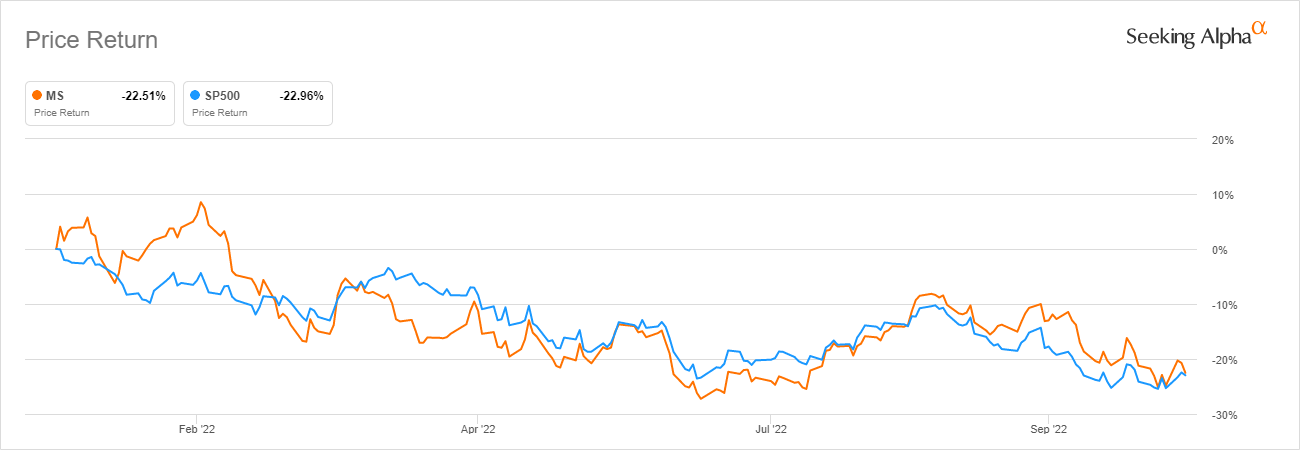
Morgan Stanley ( MS )
Morgan Stanley is the only large U.S. bank that made its way to Cramer's shopping list and one of his most recommended purchases. MS recently disappointed investors by missing both the top and bottom line estimates in their latest third-quarter earnings report. Shares of the bank tumbled by close to 5% as the market struggled to digest the troublesome report. Revenues came in at $12.99 billion, short of the $13.3 billion estimate, while earnings came in short by $0.02 per share. Cramer reaffirmed his bullish view after the report, claiming that "investors need to be patient with Morgan Stanley." The bank traded largely in line with the market, having generated a negative 22.51% year-to-date return alongside a negative one-year return of 23.70%. MS is currently selling for a P/BV per share of 1.46x while offering a dividend yield of 3.90%.
The bank has been held in high regard by both Seeking Alpha Authors and Wall Street analysts. Seeking Alpha Authors have been long bullish on the company assigning it a "Buy" rating with an average score of 3.83/5.00. Wall Street analysts have been even more bullish and assigned MS a "Strong Buy" rating with an average score of 4.10/5.00. The bank currently trades at around $78.76 per share.
Morgan Stanley vs S&P500 YTD Results (Seeking Alpha)
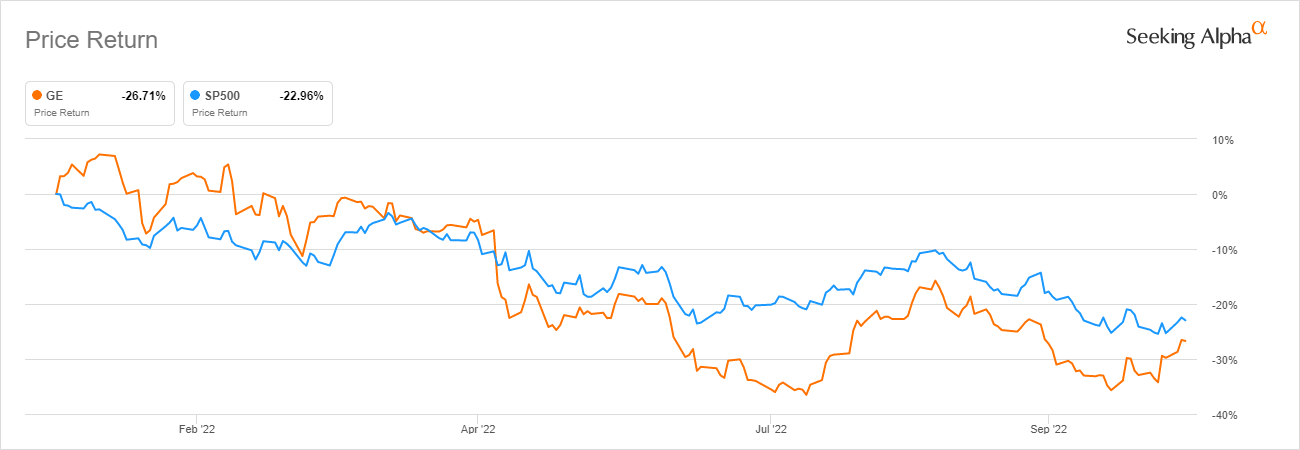
General Electric Company ( GE )
In November of last year, General Electric outlined a cunning plan to split into three publicly traded companies that will be separately focused on energy, healthcare, and aviation in order to maximize shareholder value. The first major step in this plan is to spin off its healthcare business into a new public company in early 2023. GE will follow that up by combining its energy divisions into a unified company that is supposed to be spun off in early 2024.
After the two spinoffs, the leftover company will be solely focused on aviation, a prospect that Jim Cramer likes very much, maintaining his bullish view on GE. The more than a-century-old conglomerate only slightly underperformed the market this year, generating a negative year-to-date return of 26.71% accompanied by a negative one-year return of 32.66%. GE is selling at what might be considered fair in line with overall market valuations. They are currently trading for an NTM EV/EBITDA of 10.64x, NTM P/E of 20.71x, and an NTM P/FCF of 14.87x.
Both Seeking Alpha Authors and Wall Street Analysts remain largely bullish about the prospects of the old giant, both assigning GE a "Buy" rating, with the former giving an average score of 3.60/5.00, while the latter came in with a much more enthusiastic 4.22/5.00. Shares of General Electric are currently trading at $70.53.
General Electric vs S&P500 YTD Results (Seeking Alpha)
Latest Quarterly Picks
We have collected, aggregated, and analyzed more than 3,637 live on-air stock-picking recommendations. Just this quarter, he added another 440 recommendations to that tally. On 225 occasions, Jim Cramer recommended purchasing a stock or has otherwise expressed bullish views on individual stocks during the third quarter of this year. Note there will be some differences in the companies discussed here as this list covers all of quarter three and our strategy tracks his recommendations over the last 30 days.
Jim Cramer Stock Picks (Quiver Quantitative)
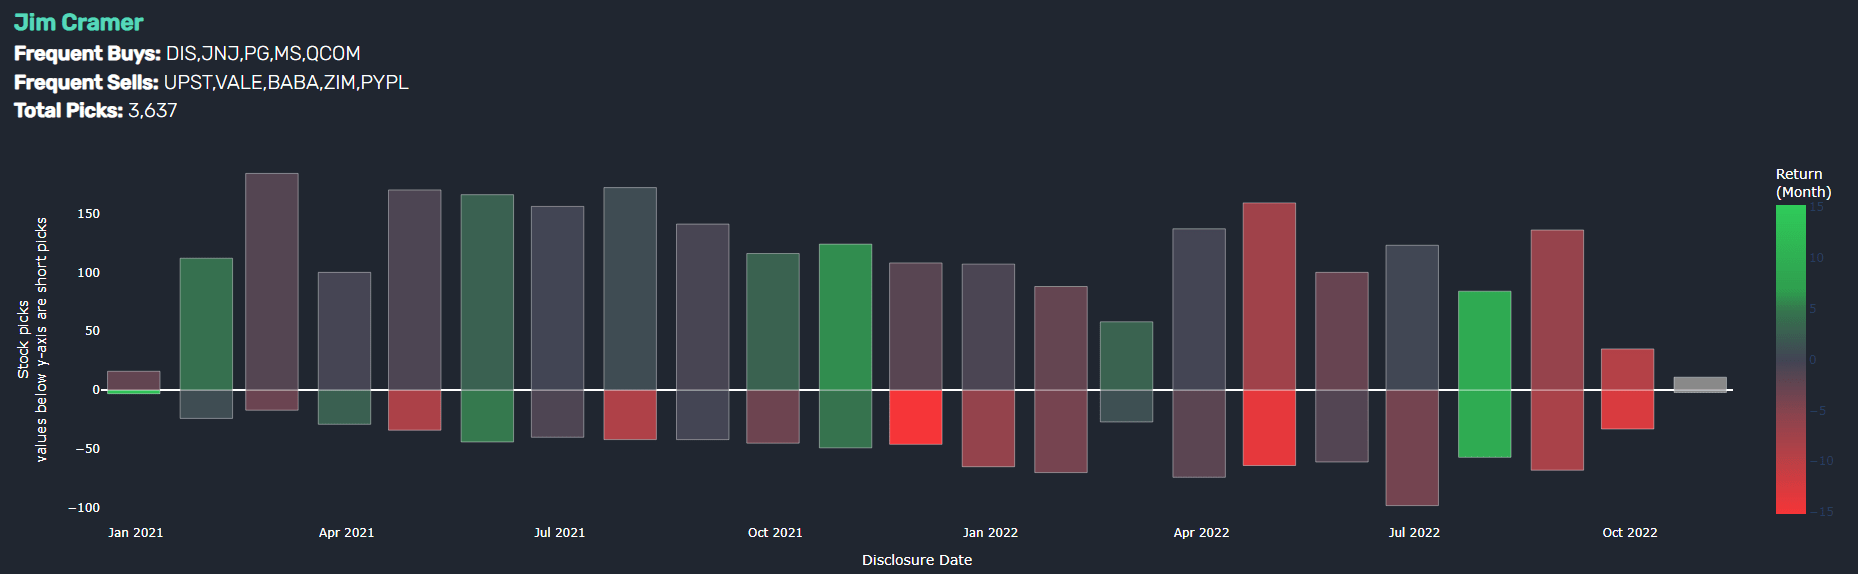
Here is our list of Jim's top most recommended stocks:
Jonhson & Jonhson ( JNJ )
- QuiverQuant Buy Ranking: #1
- Total Buy Recommendations: 8
- First Recommendation: 13th of July
- Last Recommendation: 29th of August
Jonhson and Jonhson QQ Report (Quiver Quantitative)
Tellurian Inc ( TELL )
- QuiverQuant Buy Ranking #2
- Total Buy Recommendations: 6
- First Recommendation: 19th of July
-
Last Recommendation: 19th of September
Tellurian Inc QQ Report (Quiver Quantitative)
Ford Motor Company ( F )
- QuiverQuant Buy Ranking #3
- Total Buy Recommendations: 6
- First Recommendation: 5th of July
- Last Recommendation: 12th of September
Ford Motor Company QQ Report (Quiver Quantitative)
The Walt Disney Company
- QuiverQuant Buy Ranking #4
- Total Buy Recommendations: 6
- First Recommendation: 5th of July
- Last Recommendation: 29th of September
The Walt Disney Company QQ Report (Quiver Quantitative)
Starbucks Corporation ( SBUX )
- QuiverQuant Buy Ranking #5
- Total Buy Recommendations: 5
- First Recommendation: 8th of August
-
Last Recommendation: 6th of September
Starbucks Corporation QQ Report (Quiver Quantitative)
Besides our list of the top five most recommended stocks, Jim Cramer seems to have taken a particular liking to The Coca-Cola Company ( KO ), Devon Energy Corporation ( DVN ), The TJX Companies ( TJX ), Morgan Stanley ( MS ), Constellation Brands ( STZ ), SoFi Technologies ( SOFI ), Procter & Gamble Company ( PG ), MP Materials ( MP ), Honeywell International ( HON ), Halliburton Company ( HAL ), Alphabet Inc. ( GOOGL ), Cisco Systems, Inc. ( CSCO ), Salesforce, Inc. ( CRM ), Wells Fargo & Company ( WFC ), Twitter, Inc. ( TWTR ), Tesla, Inc. ( TSLA ), Seagen Inc. ( SGEN ), Qualcomm Incorporated ( QCOM ), Realty Income Corporation ( O ), Cloudflare, Inc. ( NET ), Microsoft Corporation ( MSFT ), among others.
Jim Cramer has also made a total of 185 live on-air stock sell recommendations or has otherwise expressed his bearish views on individual stocks during the third quarter of this year.
Here is our list of Jim's top most recommended sells:
Humana Inc ( HUM )
- QuiverQuant Sell Ranking #1
- Total Sell Recommendations: 3
- First Recommendation: 6th of July
- Last Recommendation: 14th of September
Humana Inc QQ Report (Quiver Quantitative)
AT&T Inc ( T )
- QuiverQuant Sell Ranking #2
- Total Sell Recommendations: 3
- First Recommendation: 14th of July
- Last Recommendation: 30th of August
AT&T QQ Report (Quiver Quantitative)
The Boeing Company ( BA )
- QuiverQuant Sell Ranking #3
- Total Sell Recommendations: 3
- First Recommendation: 6th of July
- Last Recommendation: 29th of September
The Boeing Company QQ Report (Quiver Quantitative)
Pioneer Natural Resources ( PXD )
- QuiverQuant Sell Ranking #4
- Total Sell Recommendations: 2
- First Recommendation: 29th of August
- Last Recommendation: 31st of August
Pioneer National Resources QQ Report (Quiver Quantitative)
Eli Lilly and Company ( LLY )
- QuiverQuant Sell Ranking #5
- Total Sell Recommendations: 2
- First Recommendation: 15th of July
- Last Recommendation: 29th of July
Eli Lilly and Company QQ Report (Quiver Quantitative)
On the other hand, more notable "sell" or "trim" recommendations by the Mad Money host during this year include companies like AT&T Inc. ( T ), 3M Company ( MMM ), Upstart Holdings, Inc. ( UPST ), ChargePoint Holdings, Inc. ( CHPT ), Alibaba Group Holding Limited ( BABA ), Uber Technologies, Inc. ( UBER ), Marathon Digital Holdings, Inc. ( MARA ), Kohl's Corporation ( KSS ), Verizon Communications Inc. ( VZ ), Snap Inc. ( SNAP ), Carnival Corporation & plc ( CCL ), Warner Bros. Discovery, Inc. ( WBD ), Block, Inc. ( SQ ), Vale S.A. ( VALE ), Zoom Video Communications ( ZM ), Sunnova Energy ( NOVA ), Nucor Corporation ( NUE ), Occidental Petroleum ( OXY ), and others.
Closing thoughts and conclusions
While he happens to be the target of criticism for his slightly lackluster stock-picking performance, the Mad Money host remains one of the most influential and popular finance TV personalities in history. He is a veteran of investing while there is blood on the streets, considering that he has lived through the last seven bear markets and was professionally engaged in the market in one way or another during the last four. As we have mentioned earlier, the TV host came out with close to 440 stock-picking recommendations this quarter alone, adding to our tally of more than 3,600 picks we have collected and aggregated throughout the years. Still, there is one strong underlying trend that can be recorded when analyzing his stock picks, the vast majority of those stock tips tend to deliver underperformance, as was shown once again this quarter.
While his outlandish and controversial picks may lead to good ratings, this philosophy, combined with a large number of recommendations he has to make, ultimately has led to poor returns. In the third quarter alone, the inverse Cramer strategy returned about 2.2% while the overall market declined by 2.37% for the same period. This adds to the already impressive year-to-date results of the strategy, which delivered a negative return of only 3.3%, while the broader market declined by more than 22.96% since the beginning of the year.
We will pursue the effort of monitoring his on-air performance, as we believe it can be used to the advantage of the everyday investor, given that his market underperformance became solidified to the point where inverting his stock recommendations actuality tends to deliver alpha on the market, thereby presenting an interesting and possibly lucrative investment strategy .
For further details see:
The Inverse Jim Cramer Strategy: Q3 2022 Update