VTI - The Magnificent 7 May See A Magnificent Decline
2023-10-23 11:35:56 ET
Summary
- The Magnificent 7 stocks, including Nvidia, Tesla, Meta, Microsoft, Apple, Amazon, and Alphabet, may be facing a significant decline based on technical charts.
- The initial rise in these stocks was driven by a short-volatility dispersion trade, but the trade is now falling apart.
- The Bloomberg Magnificent 7 index shows a triple-top pattern, indicating that the recent rally may be over and significant losses could occur.
The Magnificent 7, which has led the market sharply higher in recent months, may be on the cusp of a magnificent decline based on the technical charts. The group of 7 stocks is made up of Nvidia ( NVDA ), Tesla ( TSLA ), Meta ( META ), Microsoft ( MSFT ), Apple ( AAPL ), Amazon ( AMZN ), and Alphabet (GOOG, GOOGL ).
The move higher in these shares initially started out as a short-volatility dispersion trade, as volatility-related funds were probably taking part in a trade that entailed shorting S&P 500 (SP500) implied volatility and then using the components of the S&P 500 to hedge the risk . This was likely done by buying the call options of these larger components and then using the stock to remain delta-neutral.
Mechanical Trade
This could be observed by measuring the S&P VIX Index (VIX) index, which moved dramatically lower over the summer, and the S&P 1-month implied correlation basket. This is also easy to see when comparing the implied volatility of a one-month at-the-money option of the seven stocks climbing while the S&P 500 implied volatility was falling.
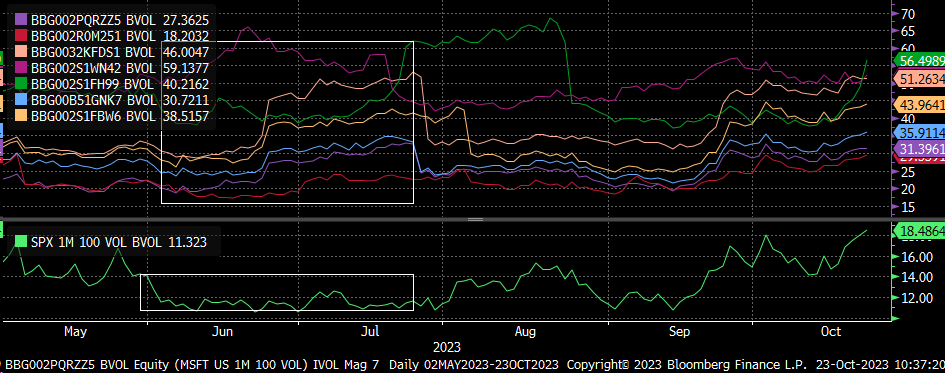
This caused the 1-month implied correlation index to move lower to a level not seen since late 2017 and the fall of 2018. The index measures the expected correlation of the implied volatility of the top 50 stocks in the S&P 500. When it moves lower, it means the correlation is falling.
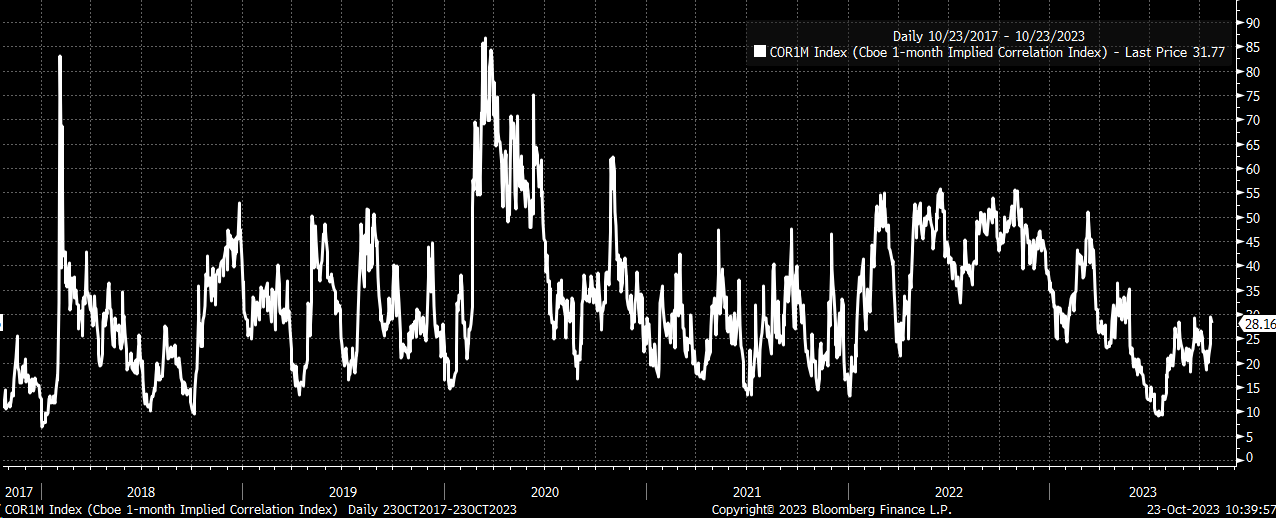
AI Narrative
This trade, of course, was taking place under the Artificial Intelligence narrative, which helped to boost any stock that talked about AI. The biggest winner of this was clearly Nvidia of this title.
Regardless, the rally was mechanically driven, and while there is no doubt that Nvidia has seen a big surge in revenue, the trade was more about the easing of financial conditions and the declines in the VIX index than anything else.
Technicals D eteriorate
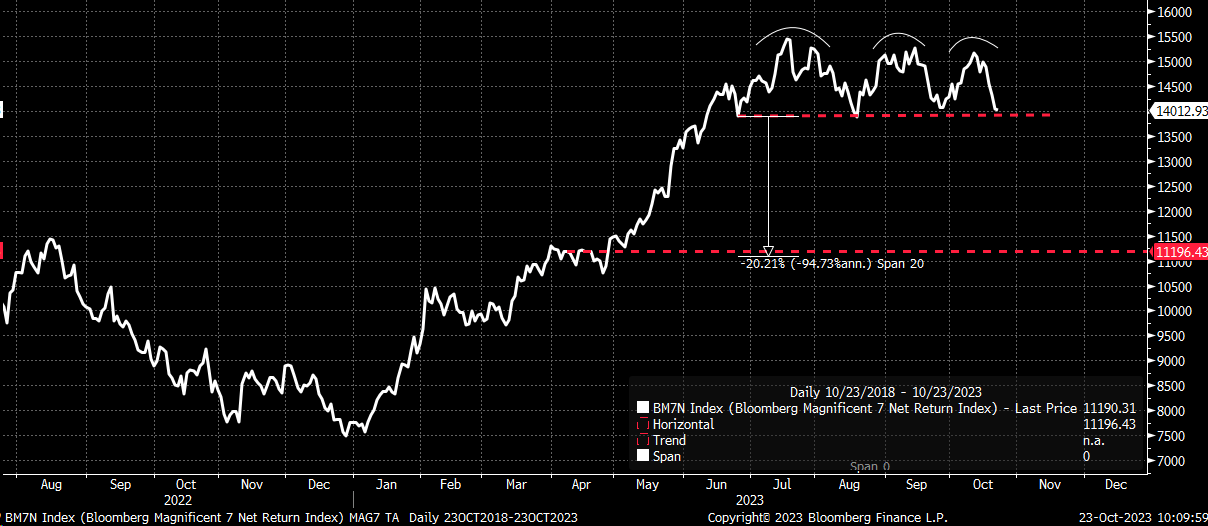
That trade is not only falling apart now; it is on the cusp of collapsing, as the Bloomberg Magnificent 7 index, a measure of these seven stocks, shows that a clear triple-top pattern has formed. A triple-top pattern is a reversal pattern and would suggest that the recent rally in the group of 7 is over and could face significant losses.
At this point, the index needs to fall below the neckline, and once the index falls below the neckline, it would serve as confirmation that the decline is likely to move a bit faster and could be rather steep when measuring the entire move for the group combined, and could technically amount to a decline that is as much as 20%.
Since the middle of April, data shows that Nvidia and Meta were the biggest gainers among the group and accounted for more than half of the gains. It also probably means these stocks will likely lead the way lower for the Magnificent 7 and the rest of the market.
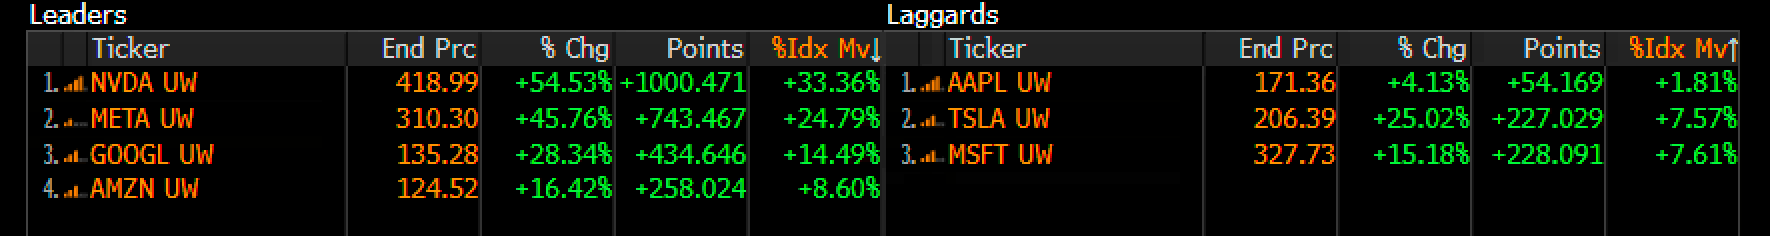
Nvidia has a technical pattern that resembles the Bloomberg index most closely, probably because it was the largest contributor to the gains. The chart shows a potential triple top or head and shoulders pattern. Both have the same meaning, and in this case, both would suggest that the stock works lower in the months ahead and eventually tries to fill the technical gap at around $310.
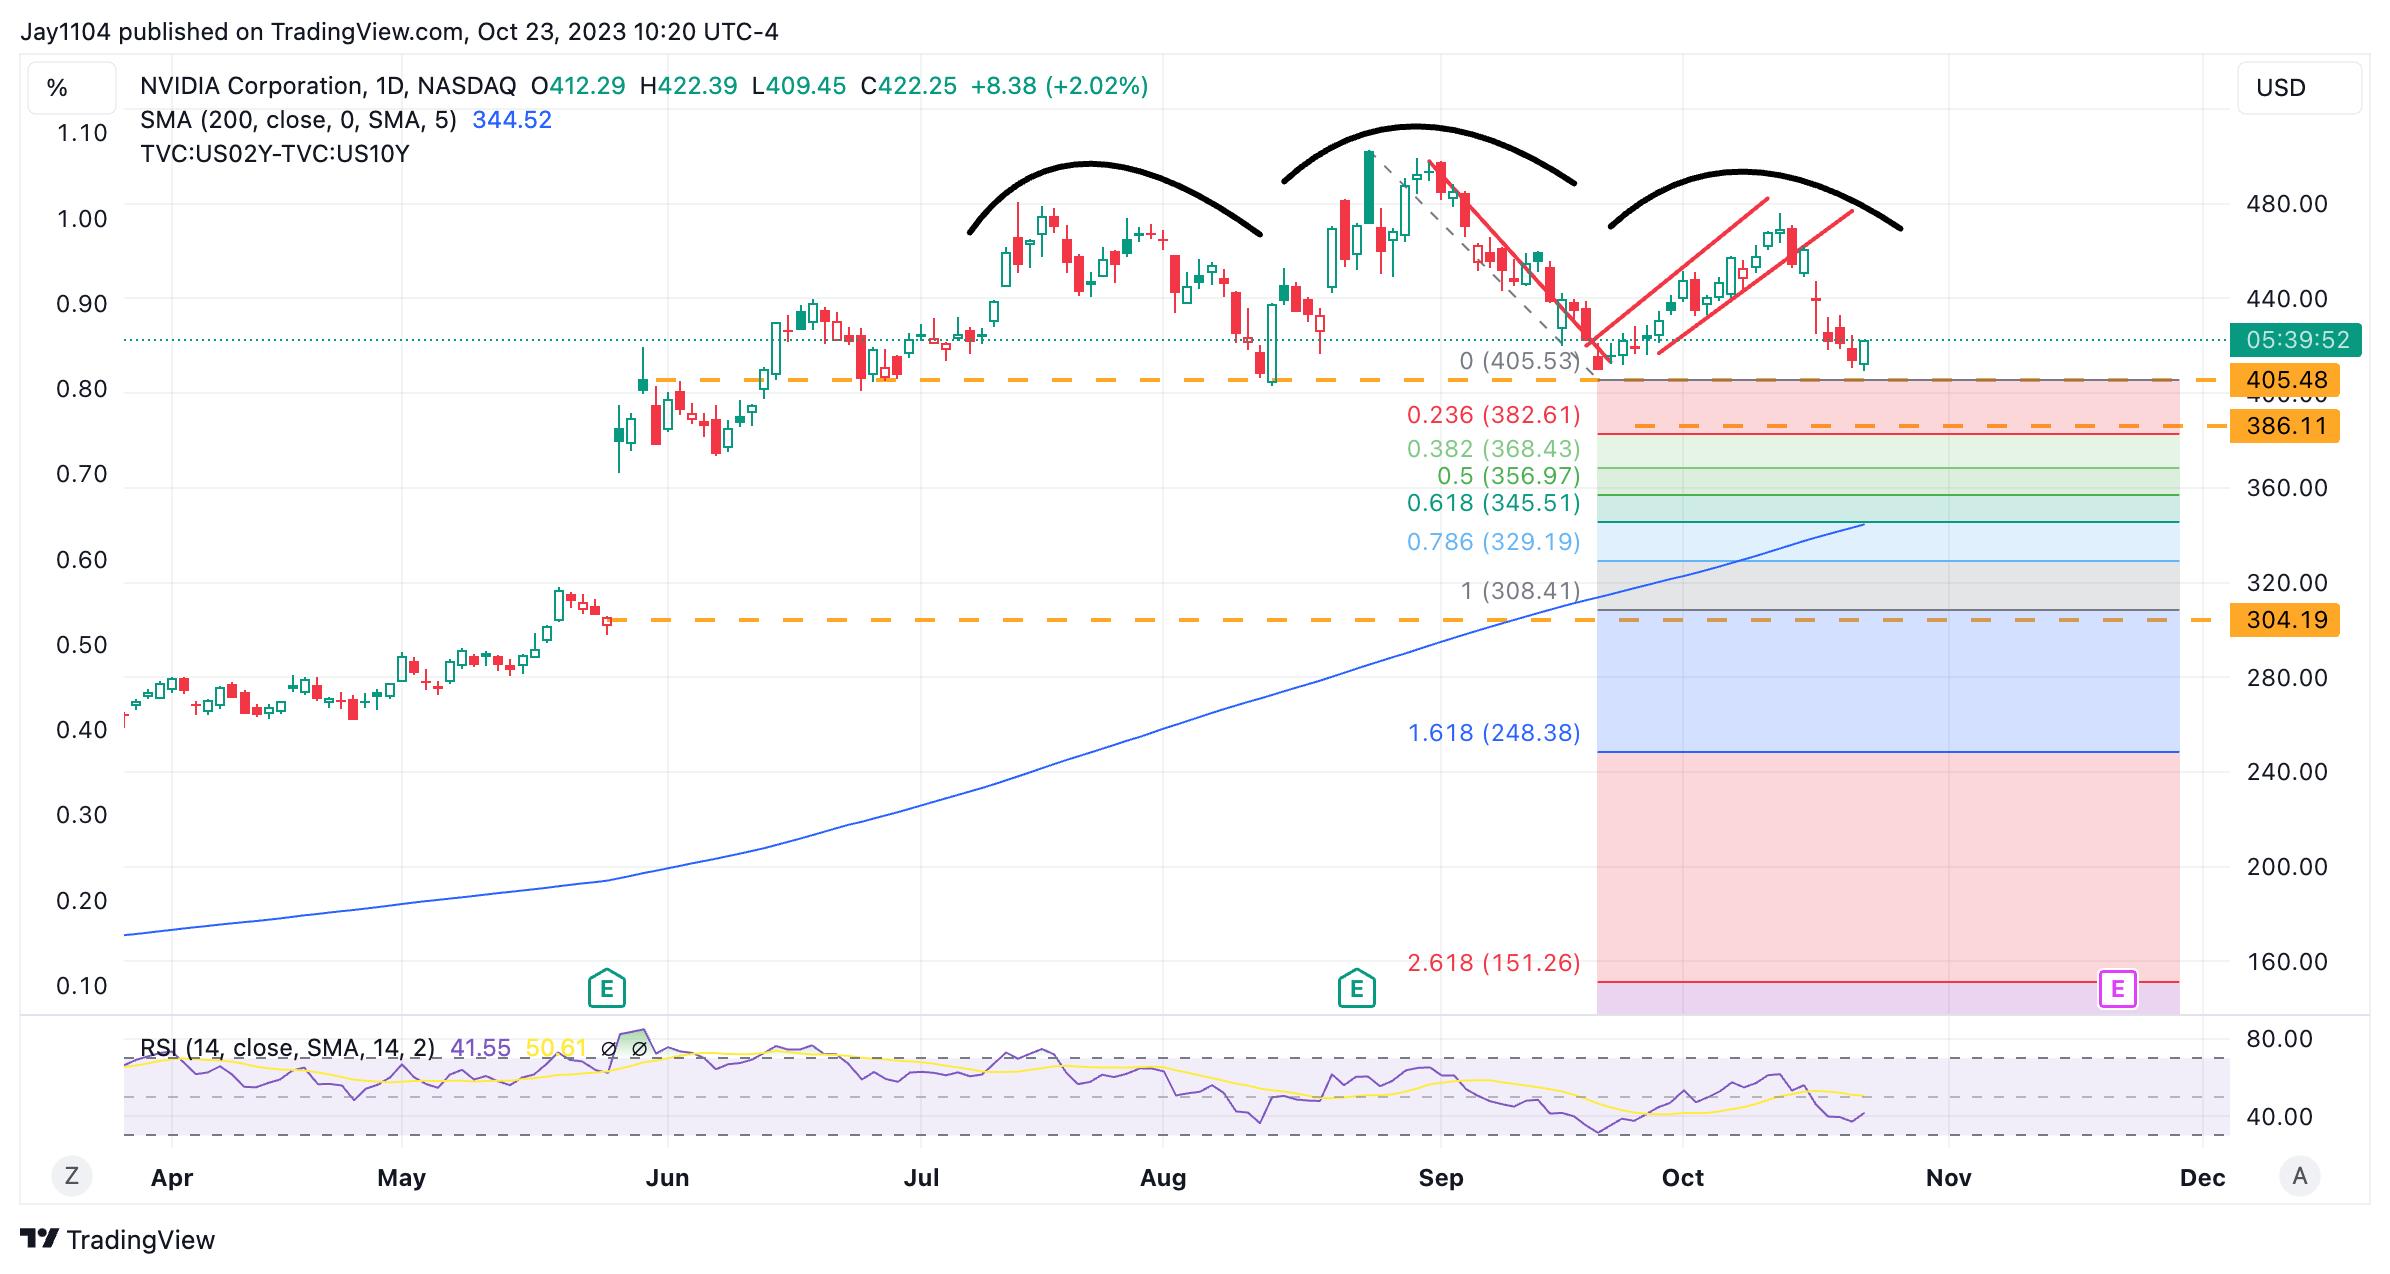
Meanwhile, Meta also shows signs of a potential distribution pattern known as a double top. But unlike Nvidia, Meta would need to fall much further to confirm the bearish double top pattern and break the neckline around $277. A drop below $277 would lead to big losers and the potential for the hare to fall to as low as $228.
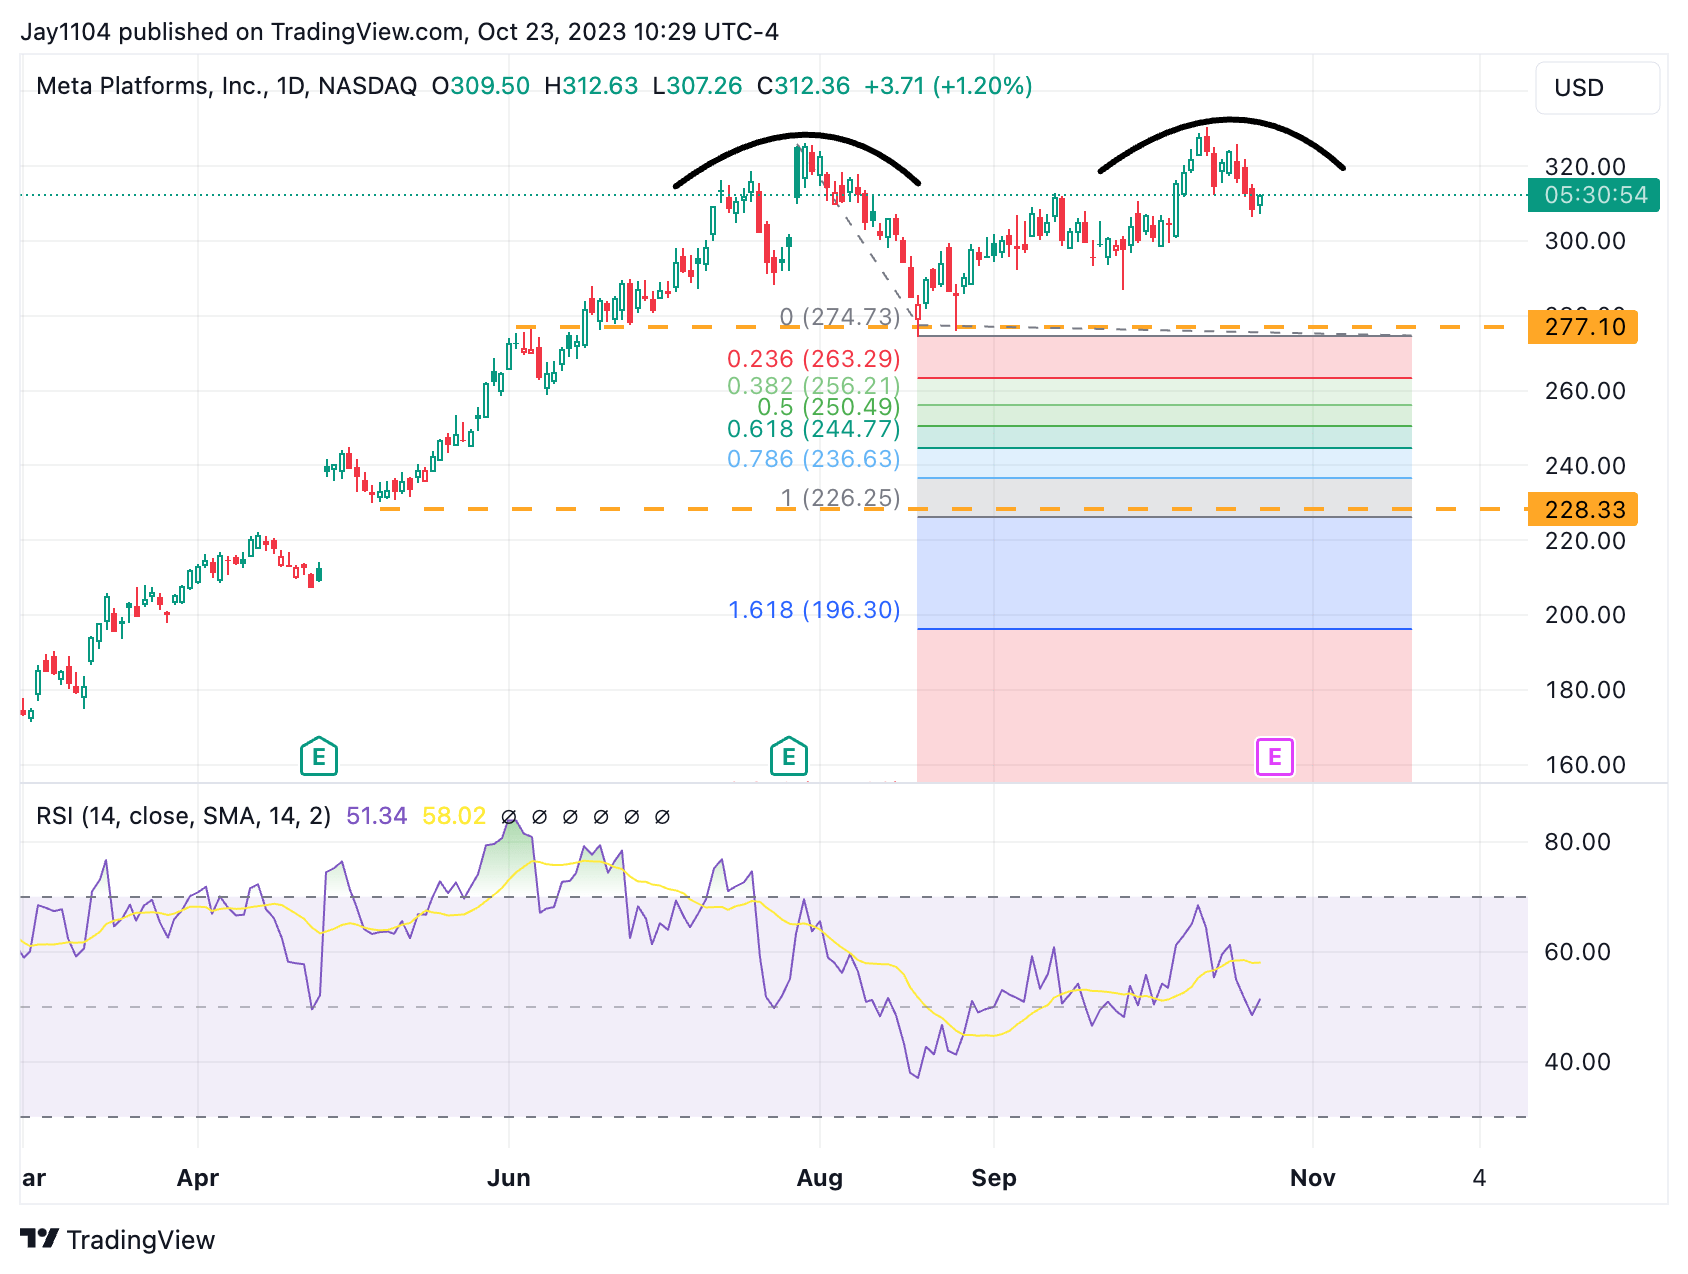
It isn't to say that any of this will or won't happen, but more to be aware of the current state of where the market and this group of stock sits; as long as these support levels hold, then Nvidia, Meta, and the other five stocks may recover some of there recent loses and move higher.
However, based on the rise in the 1-month correlation index and the rise in the VIX index, it seems that this mechanical trade is unwinding, and once this bubble truly pops, it could be quite a distance lower for the group of 7 and, more importantly, the broader market as well.
For further details see:
The Magnificent 7 May See A Magnificent Decline