QYLD - The Markets Are In Disarray And RYLD Is Performing Much Better Than QYLD
Summary
- Covered Call ETFs have provided large amounts of income through 2022, but the most popular hasn't been the best performer and RYLD has generated a better ROI.
- RYLD has been a better investment compared to XYLD and QYLD since 2021 and slightly trails XYLD for 2022.
- I illustrate the numbers behind RYLD in several scenarios, including an investment made at inception in 2019.
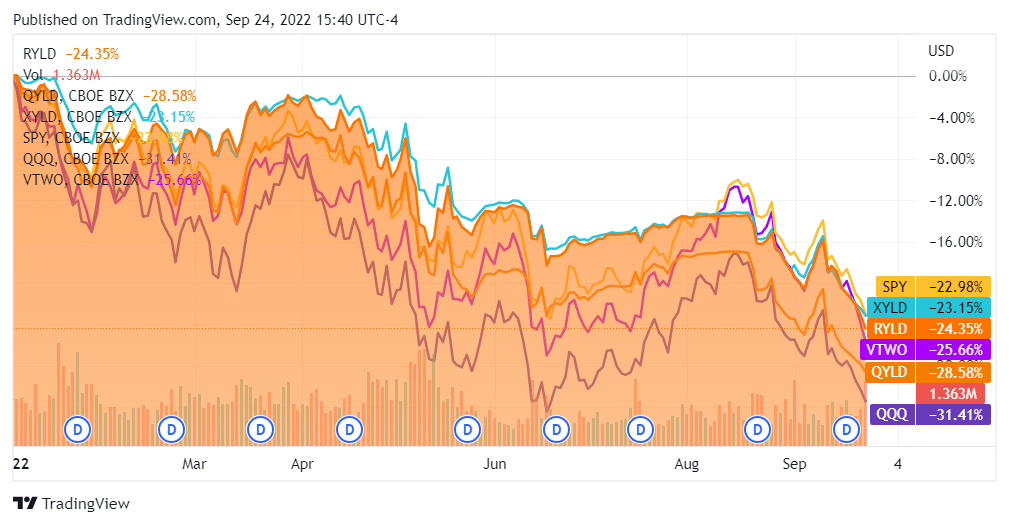
The markets have been absolutely crushed in 2022, and the June 2022 lows are about to be retested as the recent rally has disappeared. The S&P 500 is back in a bear market as it's down -23% on the year, while the Nasdaq has fallen deep into bear market territory, declining -31.36% YTD. Things started to look better, but over the past month, the S&P 500 tumbled -10.93%, while the Nasdaq fell -12.68%. Many year-end projections have been revised, and some of the largest investment banks, such as Goldman Sachs ( GS ) have cut their 2022 price target on the S&P 500 from 4,300 to 3,600. This is a completely different investing environment compared to 2021, and while people were addicted to double-digit gains in a short period, reality has set in, and any single-digit appreciation on the major indices is looking appealing.
The Covered-Call ETF's from Global X, which include the Global X Nasdaq 100 Covered Call ETF ( QYLD ), Global X S&P 500 Covered Call ETF ( XYLD ), and the Global X Russell 2000 Covered Call ETF ( RYLD ), remain extremely popular during the bear market. RYLD, and QYLD have marginally outperformed their respective indexes, while XYLD has underperformed its target index by less than 1%. These funds have become increasingly popular as they generate large amounts of income by writing covered calls against their portfolio to generate monthly distributions for their investors. The double-digit income that these funds can generate has softened the blow from the market decline and has generated significantly more income than many other investments. Interestingly enough, RYLD has the lowest net assets with $1.27 billion compared to $1.87 billion for XYLD and $6.52 billion for QYLD, but of the 3, RYLD has been the best investment since 2021, the 2nd best investment since the beginning of 2022, and it's been significantly better than QYLD which many yield-seeking investors have gravitated toward. RYLD looks very interesting, and I plan on adding to my position.
RYLD's performance since its inception
RYLD went public on 4/17/19 for $25 per share. Since then, RYLD has paid 40 consecutive distributions without missing a single month. RYLD has established a long track record of distribution income from its Covered-Call strategy to investors. Since May of 2019, RYLD has paid $8.85 per share in distributions, which is an investment yield of 35.39% on its initial $25 share price. RYLD utilizes a buy-write where it buys exposure to the stocks in the Russell 2000 Index and writes or sells corresponding call options on the same index. The options are written at the money on a monthly basis and the premiums collected are used to fund its monthly distributions to shareholders.
Global X
There is 1 premise for investing in Covered-Call funds such as RYLD, and that's to generate income. You're either looking for income now and utilizing RYLD as a vehicle to generate monthly income or you're reinvesting the monthly distributions from RYLD to create a larger income stream in the future. I have built to models and color-coded the time periods by year to illustrate how RYLD has performed since its inception. Both models will assume that 100 shares were purchased for $2,500 on the date of its inception.
Model 1, Reinvesting the Distributions
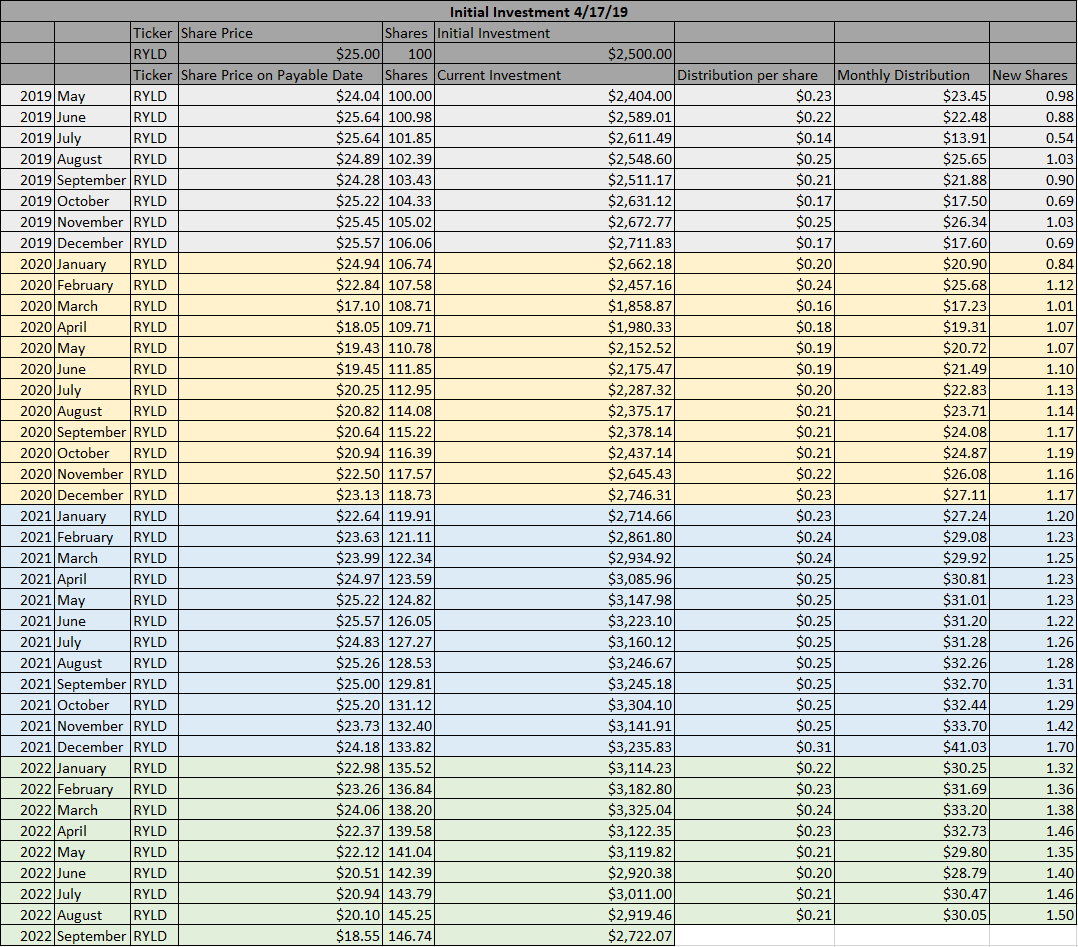
In the first model, all monthly distributions have been reinvested. RYLD would have paid $1,072.45 in distributions, increasing the total share count by 46.74 to 146.74. The additional shares would increase your future distribution income by $131.92 based on the TTM distributions. The current asset base of 146.74 shares would be valued at $2,722.07, which is an ROI of 8.88%. The forward projected annual income is $409.92, which is a 16.4% yield on your initial investment of $2,500.
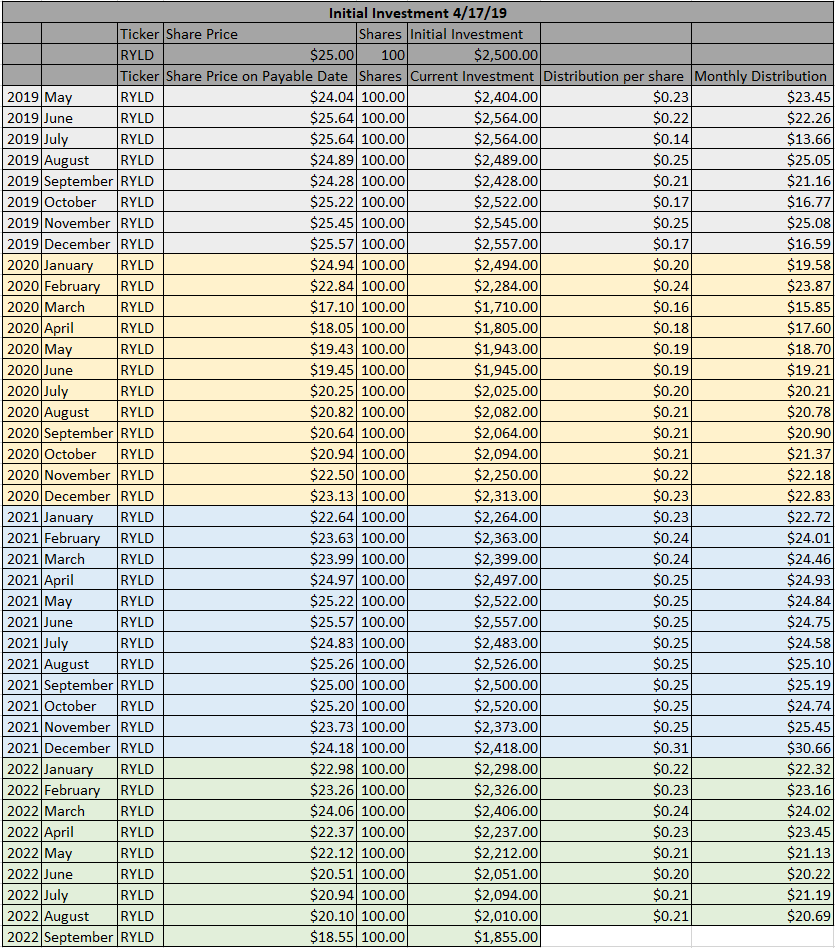
So, how would the numbers have changed if you had taken the income? Surprisingly, you would have ended up slightly better. Your initial investment would have declined by -$645 or -25.80%. RYLD would have generated $884.72 in monthly income, bringing your total profit to $239.72 or 9.59%, slightly better than the 8.88% from reinvesting every distribution. This is because RYLD has fallen so much that the value of the distributions in model 1 declined, while in model 2, the distributions were taken as cash, so their value has stayed the same. While from an ROI perspective, taking the income gives you a slight advantage, your forward projected income is only $282.22 compared to $409.92 when the dividends are reinvested.
How RYLD has fared compared to XYLD and QYLD since 2021, and in 2022
A lot of people have been interested in how RYLD, XYLD, and QYLD compare to each other. I will look at these 3 funds from 2021 and the beginning of 2022 to answer this question.
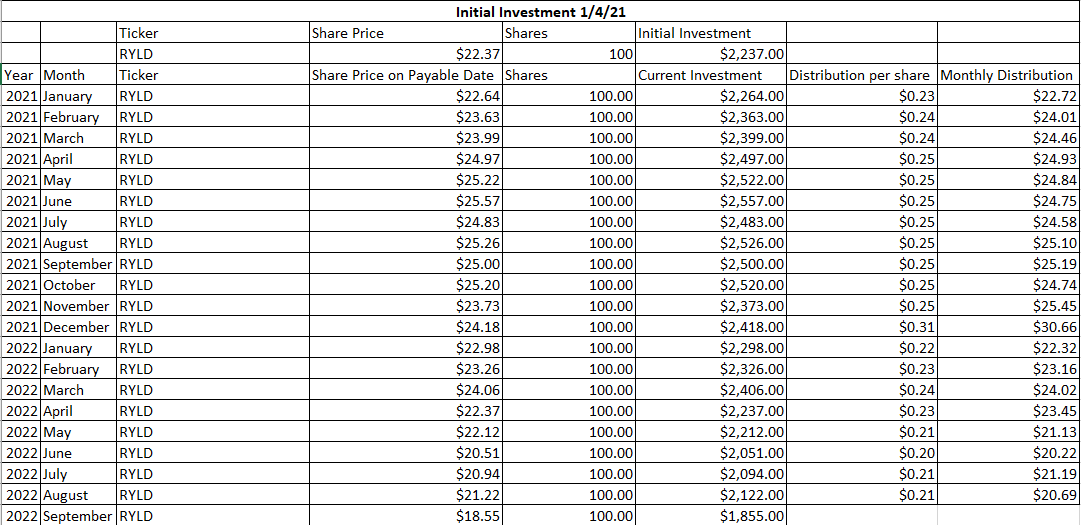
At the beginning of 2021, an initial investment in RYLD would have cost $2,237. Today it would be worth $1,855, which is a decline of -$382 or -17.08%. RYLD would have paid $477.61 in monthly distributions, which would be a 21.35% yield on invested capital, and it would bring the total ROI to 4.27%, as the total profit would be $95.61.
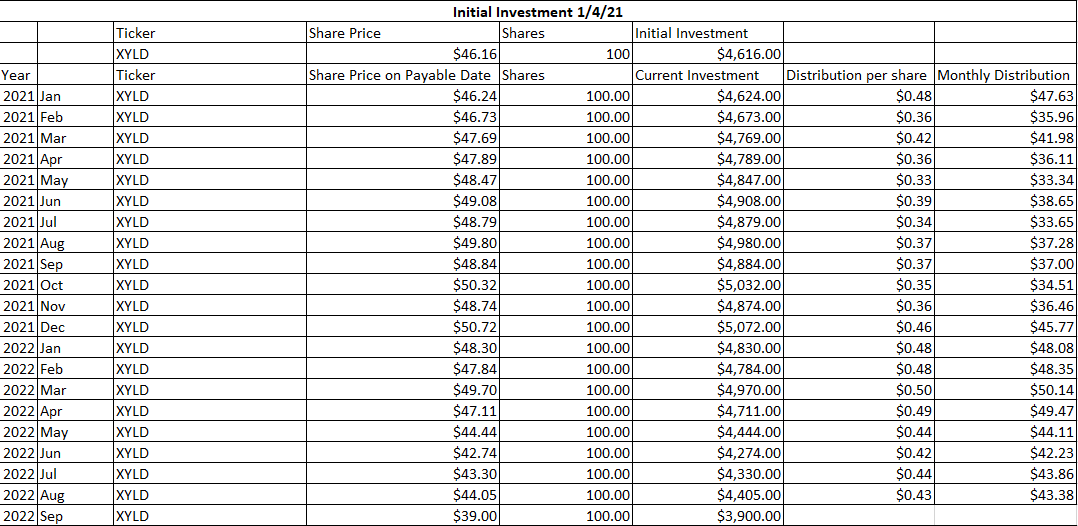
At the beginning of 2021, an initial investment in XYLD would have cost $4,616. Today it would be worth $3,900, which is a decline of -$716 or -15.51%. XYLD would have paid $827.97 in monthly distributions, which would be a 17.94% yield on invested capital, and it would bring the total ROI to 2.43%, as the total profit would be $111.97.
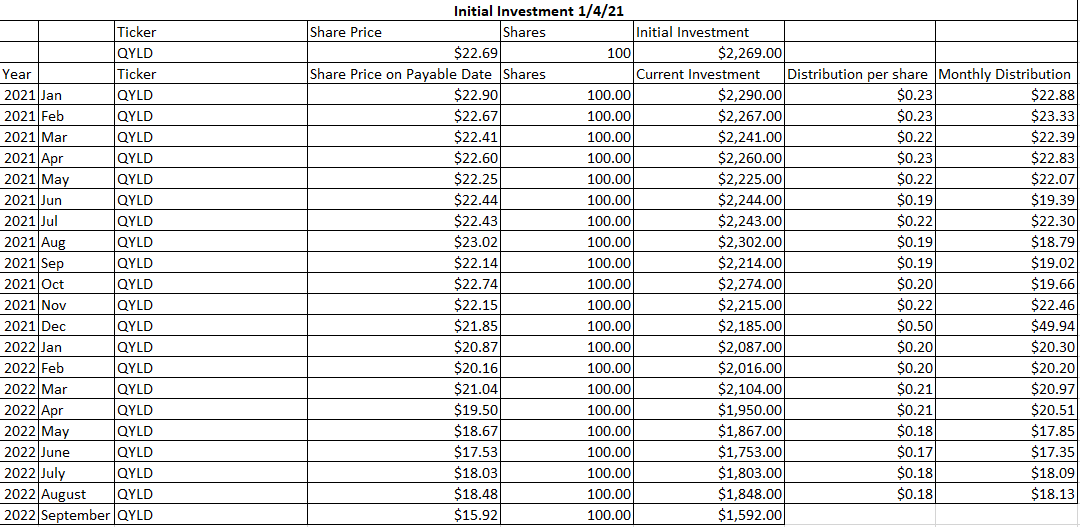
At the beginning of 2021, an initial investment in QYLD would have cost $2,269. Today it would be worth $1,592, which is a decline of -$677 or -29.84%. QYLD would have paid $438.46 in monthly distributions, which would be a 19.32% yield on invested capital, and it would bring the total ROI to -10.51%, as the total profit would be -$238.54.
Since 2021, RYLD has been the best Covered-Call ETF from Global X as its total ROI and yield on invested capital were the largest of the 3 funds. The story changes a bit if you're just looking at 2022.
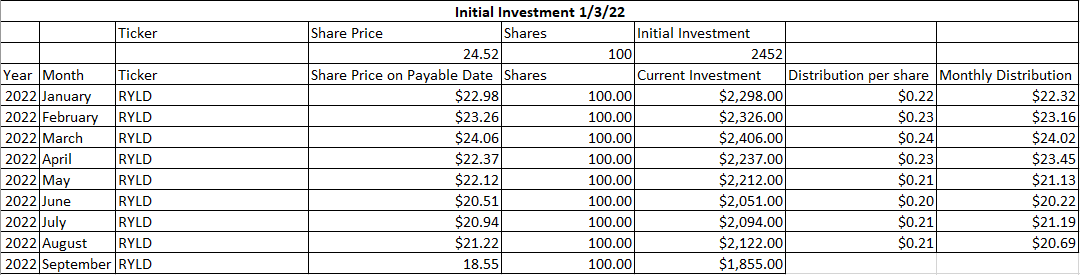
At the beginning of 2022, RYLD traded at $24.52, putting the price of 100 shares at $2,452. The value of its shares today is $18.55, placing the initial 100 shares at a value of $1,855. This is a decrease of -$597 or -24.35%. RYLD has paid $176.18 in distributions which is a 7.19% yield on invested capital. The total loss in 2022 is -$420.82 for a total ROI of -17.16%.
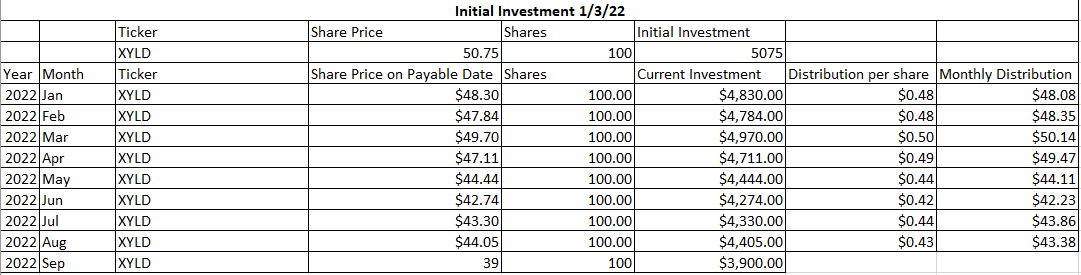
At the beginning of 2022, XYLD traded at $50.75, putting the price of 100 shares at $5,075. The value of its shares today is $39, placing the initial 100 shares at a value of $3,900. This is a decrease of -$1,175 or -23.15%. QYLD has paid $369.62 in distributions which is a 7.28% yield on invested capital. The total loss in 2022 is -$805.38 for a total ROI of -15.87%.
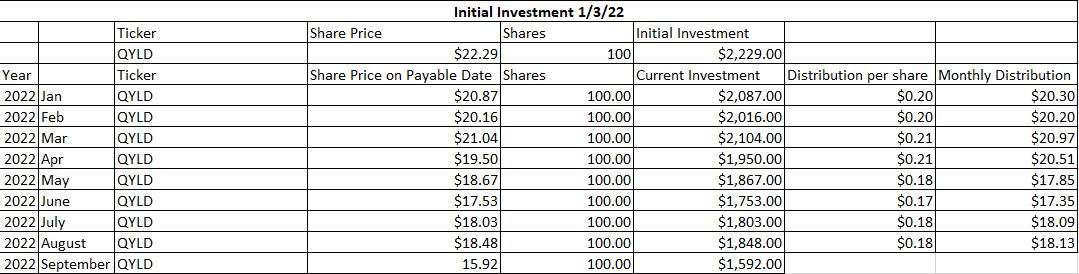
At the beginning of 2022, QYLD traded at $22.29, putting the price of 100 shares at $2,229. The value of its shares today is $15.92, placing the initial 100 shares at a value of $1,592. This is a decrease of -$637 or -28.58%. QYLD has paid $153.40 in distributions which is a 6.88% yield on invested capital. The total loss in 2022 is -$483.60 for a total ROI of -21.70%.
Looking at just 2022, XYLD has become the best investment as the combination of its distributions and asset base has a total ROI of -15.87% compared to -17.16% from RYLD, and -21.7% from QYLD.
Conclusion
2022 hasn't been the year investors were hoping for as the major indices entered bear markets instead of extending the bull market out further. On the bright side, the downturn proved that the Covered-Call ETF's from Global X would follow the markets rather than implode as some had suggested. If you're looking for monthly income, RYLD is looking very interesting here. Since 2021, RYLD has remained in the black and created the largest ROI compared to XYLD and QYLD. If you're looking at 2022 alone, RYLD is slightly trailing XYLD. From a yield perspective, RYLD has paid $2.82 per share in the TTM and has a forward yield of 15.21%. Based on RYLD's prior history since inception, if I was going to start investing in Covered-Call ETF's RYLD would be the first one I choose, rather than QYLD. I plan on adding to all 3 funds throughout the remainder of 2022, but I think RYLD is the best opportunity.
For further details see:
The Markets Are In Disarray And RYLD Is Performing Much Better Than QYLD