DIA - The Private Domestic Sector Prints A $130B Surplus In May Pointing To Better Markets In June
2023-06-11 05:24:29 ET
Summary
- The US private domestic sector balance increased by $130bn in May 2023, a positive result driven by a $246bn injection of funds from the federal government.
- Bank credit creation retraction continued for the fifth consecutive month, signaling a potential economic downturn.
- The Federal Reserve's demand destruction policy may lead to a recession by the end of 2023 or the beginning of 2024.
The purpose of this article is to examine the USA sectoral flows for May 2023 and assess the likely impact on markets as we advance into June 2023. This is pertinent, as a change in the fiscal flow rate has an approximately one-month-lagged effect on asset markets and is a useful investment forecasting tool. Other macro-fiscal flows can point to events months or years ahead.
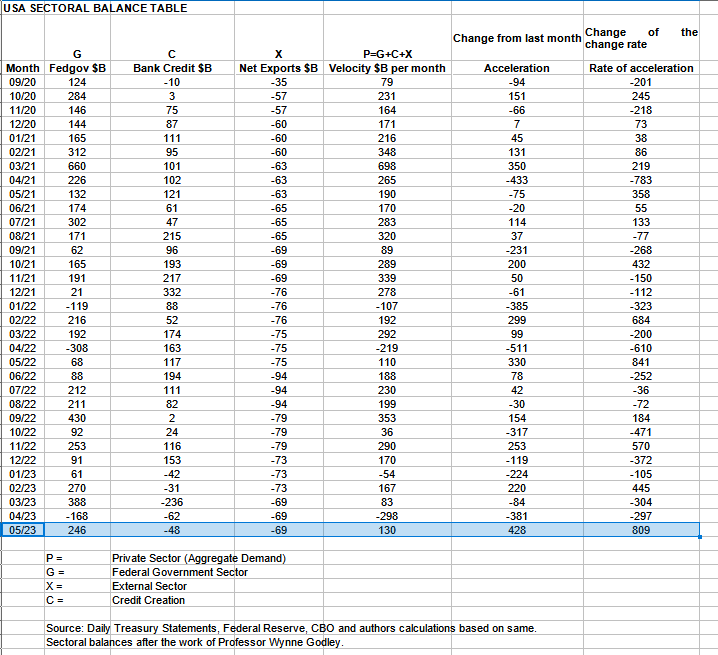
The table below shows the sectoral balances for the USA which are produced from the national accounts.
US Treasury and author calculations
In May 2023, the domestic private sector recorded a $130B rise in financial balances overall and this is a positive result.
From the table, one can see that the $130+ billion private domestic sector addition of funds came from a large $246+ billion injection of funds by the federal government [and this includes the new injection channel from the Fed of around $10.44B from interest on reserves that went directly into the banking sector], less -$48B+ billion of credit retraction from commercial banks [IE more loans were repaid or written off than were created] and less the -$69B+ billion that flowed out of the private domestic sector and into foreign bank accounts at the Fed in return for imported goods and services.
This is the fifth consecutive month of bank credit creation retraction. As a general rule: where the banks go the economy follows. And it is not looking good. Bank lending is constrained by two things: One is the bank's capital from which to extend loans, and, two, the other is the pool of credit-worthy borrowers willing to apply for and take out a loan. With a Fed-induced recession firmly on the horizon who would want to take out a loan now in a rising rate environment?
Next month we will have fresh external sector current account data to work with.
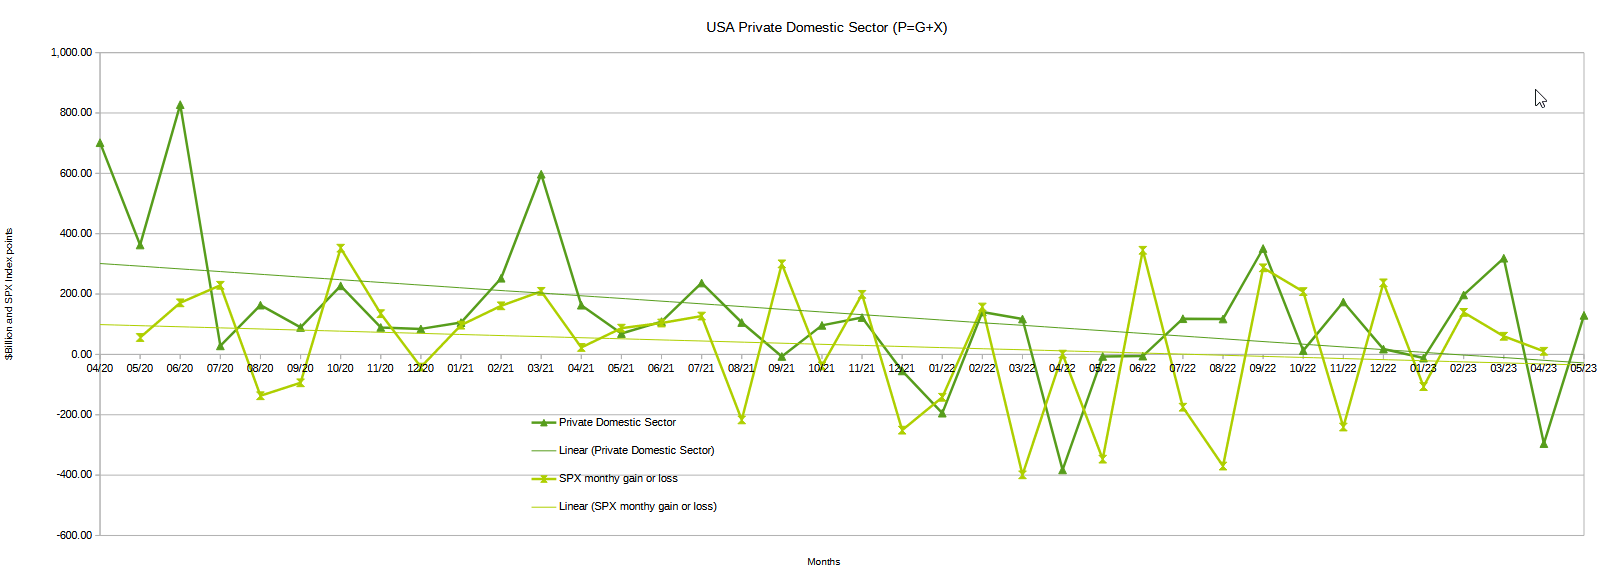
The chart below shows the sectoral balance data plotted in nominal terms. A trend line has been added to give an idea of the broad direction, which is downwards for both the private domestic sector (where asset markets are located) and the SPX. The calculation is Federal government spending or G plus the external sector (X and normally a negative factor) to leave that amount of money left to the private domestic sector, or P, by accounting identity true by definition.
The chart suggests that the SPX's next move would be for a larger gain than in previous months following the upward move in the private domestic sector balance. Over the last three months, the SPX has managed to stay in positive territory however the big caveat is that the rate of increase is lower each month.
US Treasury and author calculations
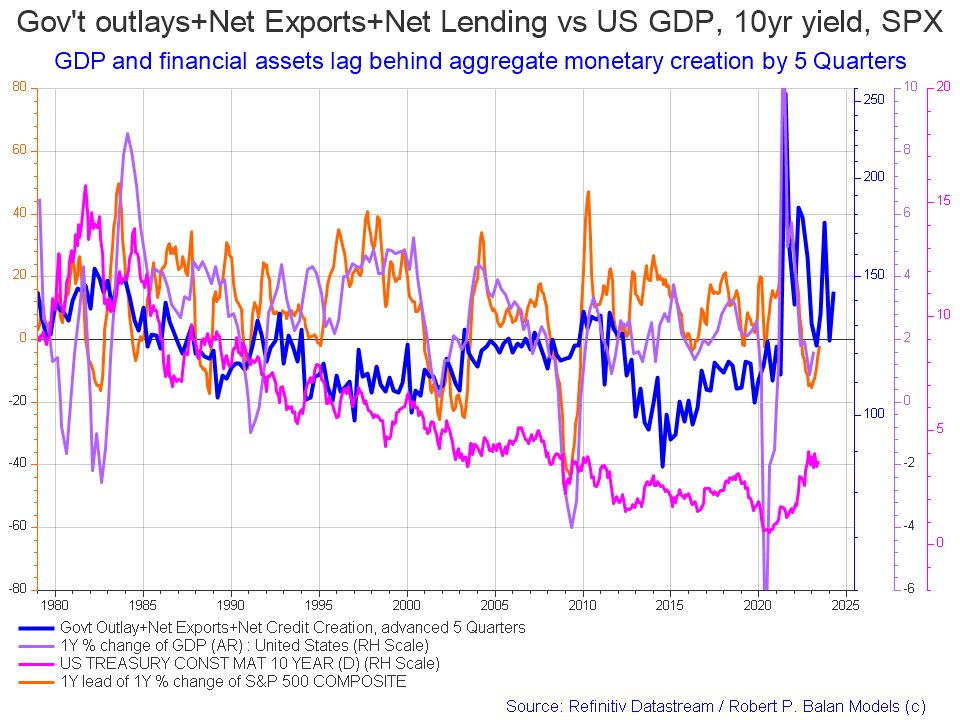
The following chart emerges when one graphs the change rate of the information in the USA sectoral balances table above and adjusts for impact time lags. This is like a long-range market radar set.
The blue line shows the fiscal impulse from federal government outlays plus bank credit creation and less the current account balance and leads by up to five quarters [a year and three months]. Short term, the orange SPX line appears to be trending back upwards to follow the leading blue line. Longer term the leading blue fiscal impulse line points to a major inflection downwards for markets in late 2024 or early 2025 and then a change of trend back upwards again.
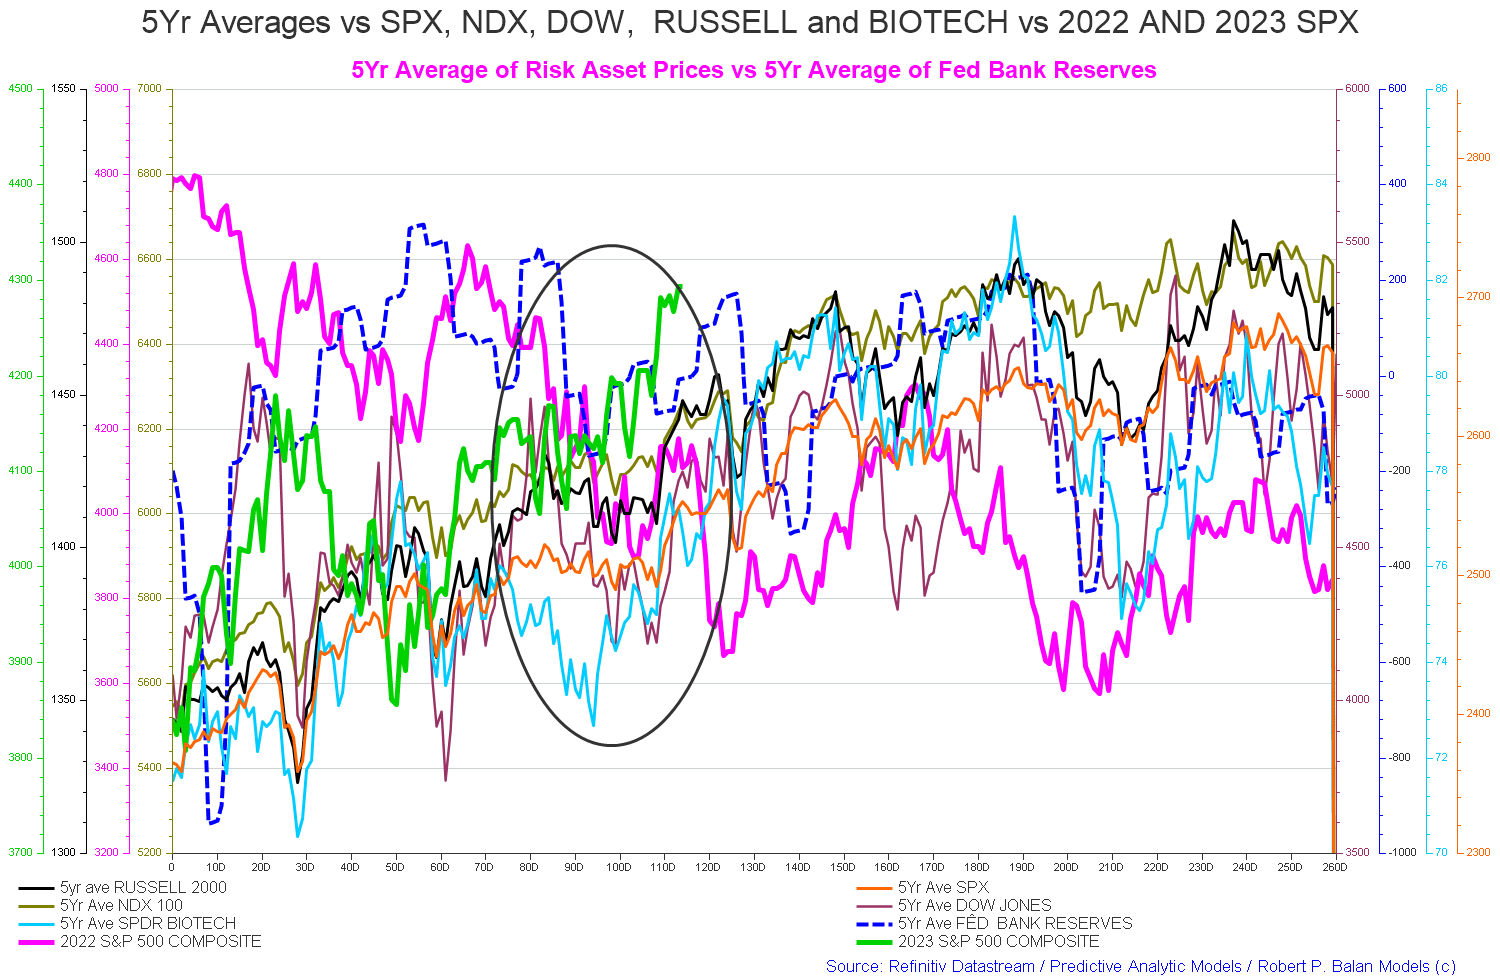
The chart below shows the five-year average of the seasonal stock market patterns for the SPX ( SPX ), NDX ( NDX ), Dow ( DIA ), Russell 2000 ( RTY ), and Biotech ( IBB ) market indexes. The black oval shows roughly where we are (trading day 115) at the time of writing and the end of the green line on the chart below.
The 5-year index averages call for a flat sideways movement falling into trading day 110-120 [Early June].
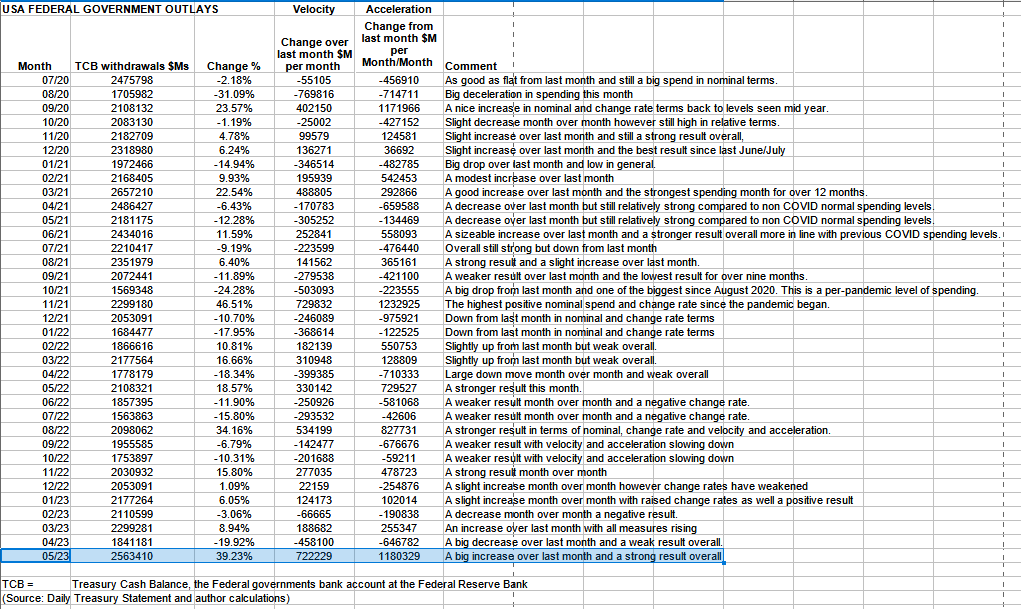
The table below shows the total federal government withdrawals from their account at the Federal Reserve Bank. A withdrawal by the federal government is a receipt/credit for the private sector and therefore a positive for asset markets.
The table shows that total outlays were much higher than last month and that the monetary velocity and acceleration are strongly positive having come from a low base.
Federal taxation was relatively light and so the resulting private domestic sector balance shown in the first table was relatively high.
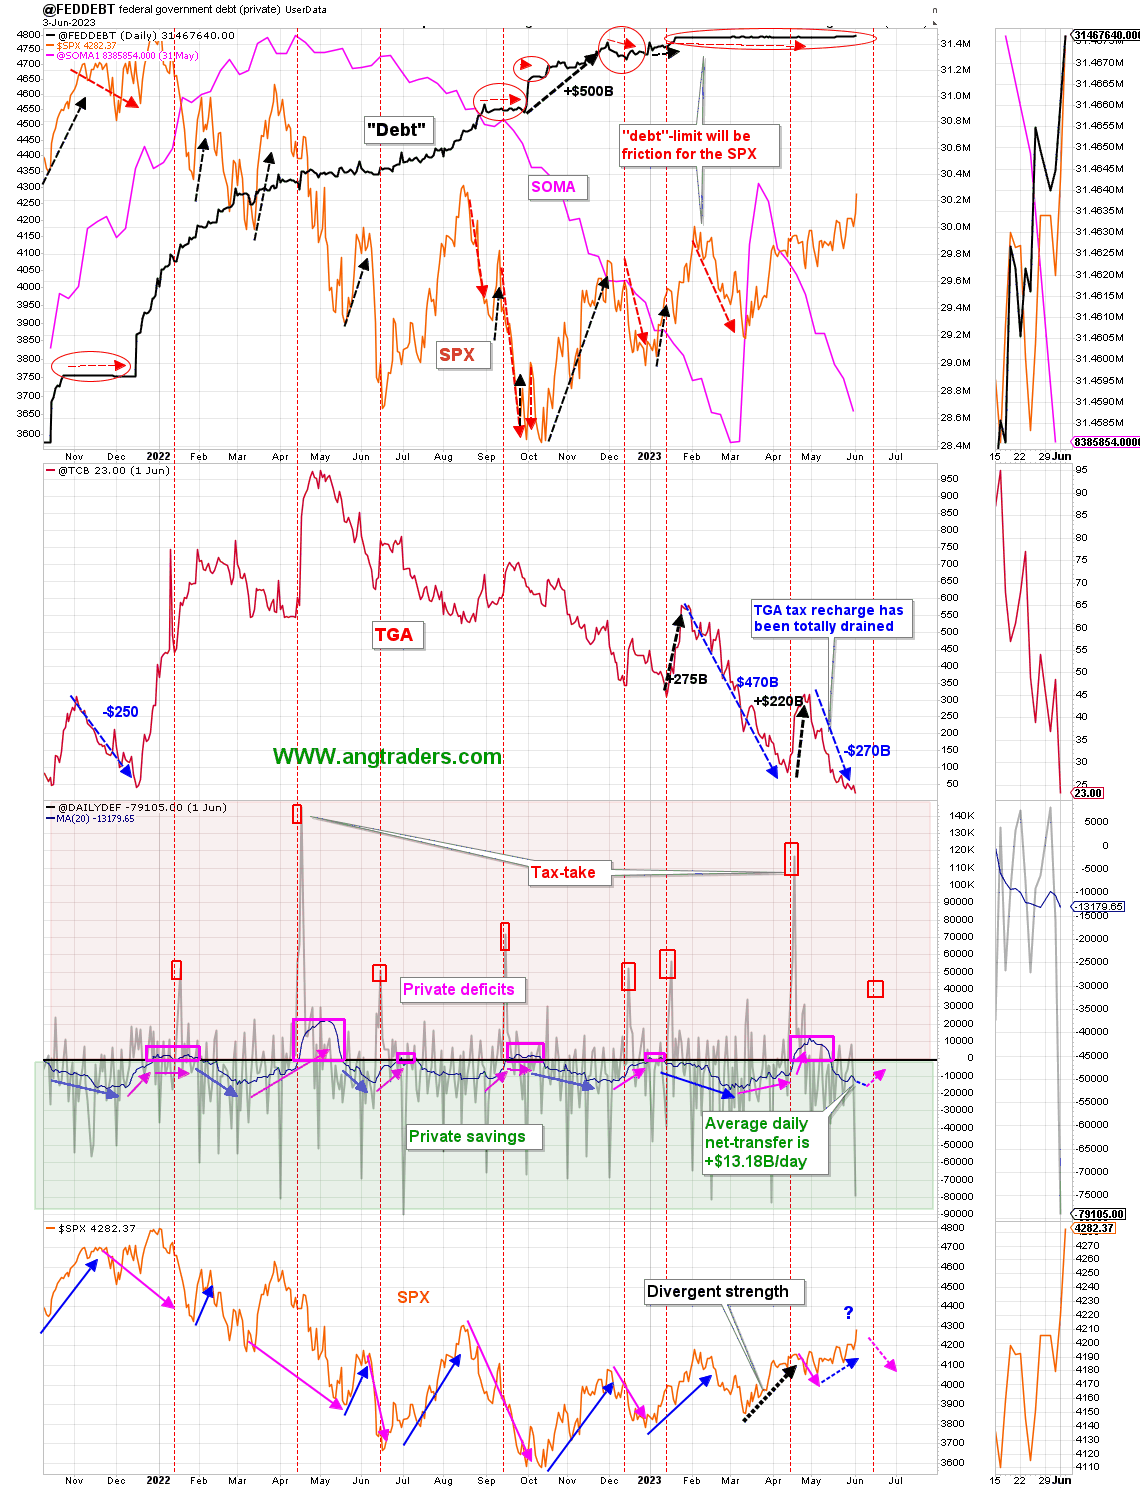
The chart below [bottom panel] shows graphically the relationship between the federal government (currency creator) and the private sector (currency user) and is from ANG Traders of the Away from the Herd SA Marketplace service. The bottom panel highlights in red and green the financial relationship between the currency creator and currency users. One's loss is the other's gain and vice versa.
The June 1st medicare and veterans benefits payments produced a one-day net-transfer of +$79B, which put the 20-day average of the daily net-transfers at +$13.18B/day. It should continue to expand until closer to the June 15 tax-drain.
The Fed's balance sheet reduction continues, but it still has not been reduced to the level it was before the bank rescue facility was implemented in March.
The Treasury general account balance is only $23B. The lowest it has been since December 2021, just before the debt-ceiling was lifted at that time also. Lifting the debt-ceiling, increases the stock of Treasures which correlates with higher SPX prices
(Source: Mr. Nick Gomez, ANG Traders, Away from the Herd SA Market Service Weekly Report for Members).
The next major milestone is the federal tax collection in mid-June and this is a negative for the private domestic sector and the markets located in it.
The above chart [top panel] shows the stock of T securities whose growth has flat-lined due to the debt limit crisis that is now thankfully resolved. Shown in the lower panel is the SPX. The most striking line on the chart is the pink SOMA [Fed balance sheet] line. After months of destructive QT, about half of it was refunded to the banking sector as part of the recent bank-run rescue and now it has reversed the trend and is being drained out again and is now nearly all gone and back to the level it was before the bank rescue.
At the White House in the last month, the debt limit crisis was thankfully resolved and the net result was that the debt limit was not raised, but even better it was suspended for two years. What this means is that the debt can rise without limit for two years with no prospect of any artificial cap being reached.
In normal household parlance, more debt is perceived as bad and must be paid back or else a day of reckoning will come. Not so with federal government debt which should be renamed to what it is: The money supply. A growing economy needs a growing money supply otherwise it cannot grow.
The money that buys the treasury bonds that in turn fill the federal government's bank account at the Fed comes from the federal government itself.
The next Fed meeting on 14-15 June coincides with the same day as the next large federal tax collection where more bad news about rate rises and QT will compound the hit to asset markets from the drainage of liquidity that the tax extraction causes.
The Fed is driving the economy into a recession and the big question is when is the recession going to come? If and when it comes it could be a German-style recession, which I cover in this recent article , whereby at the same time that the economy prints two consecutive quarters of negative growth the German stock market, the DAX, goes on to make new all-time highs. How did it happen? Read the article to find out.
The following chart may shed some light on the subject.
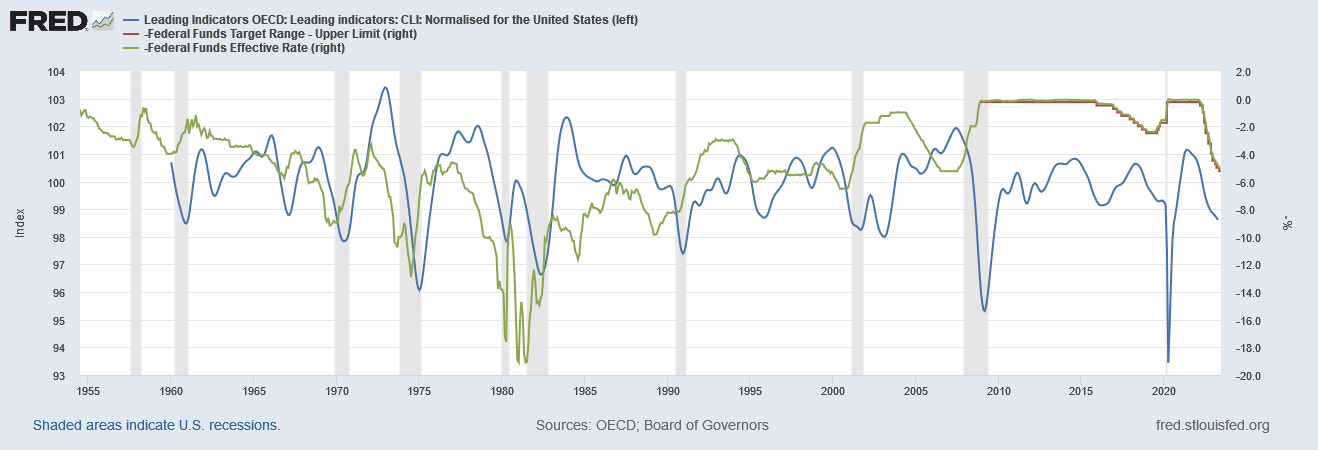
The chart above shows the leading economic indicators in blue and the Federal Funds Rate [FFR and inverted] in green and red. Note that the FFR line has been inverted so that it ''moves" in synchrony with the LEI line. The takeaways from the chart are:
1. The blue line is weakening as the leading economic indicators worsen.
2. We know that the FFR line is rising and rising at a faster rate than ever before as the Fed implements its rate-rising policy.
3. Recessions tend to come when the blue line peaks.
4. The falling LEI values are preceded by the rising FFR line.
5. Recessions tend to occur when the blue line peaks and after the FFR has peaked.
6. The FFR appears to lead both the LEI and recessions by a few months.
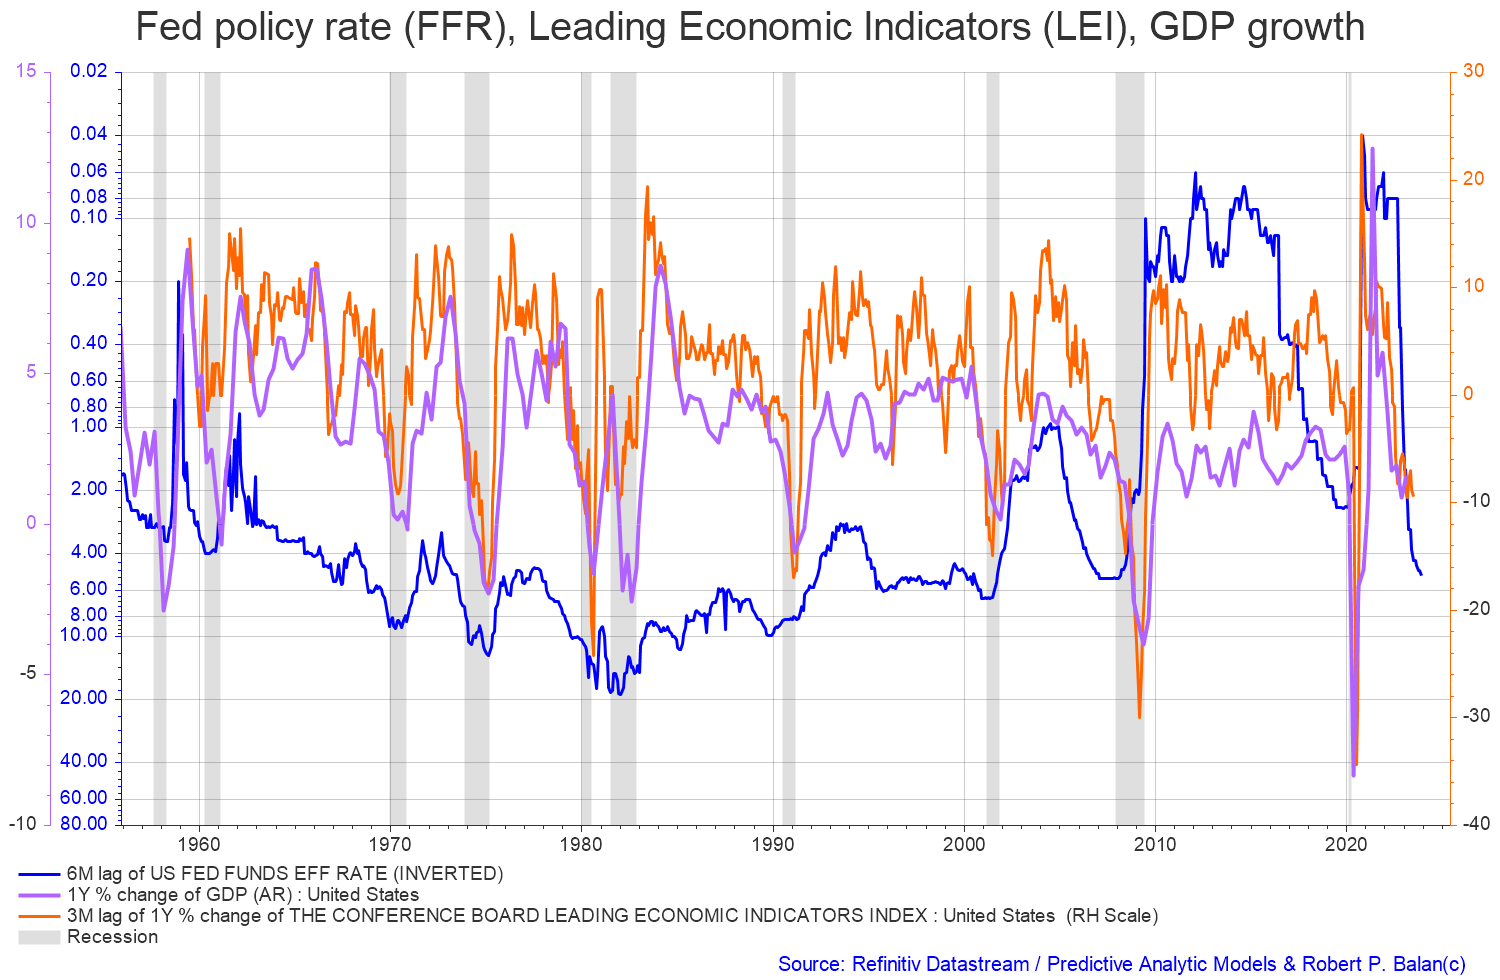
The following chart is a change rate version of the chart above and seeks to identify the length of the time lag associated with a rising FFR and falling LEI and the onset of a recession and therefore falling asset markets.
When one lines up the peaks and troughs over a long time sample it is clear that the FFR [blue line and inverted] leads movements in GDP [purple line] by six months and the LEI [orange line] by three months.
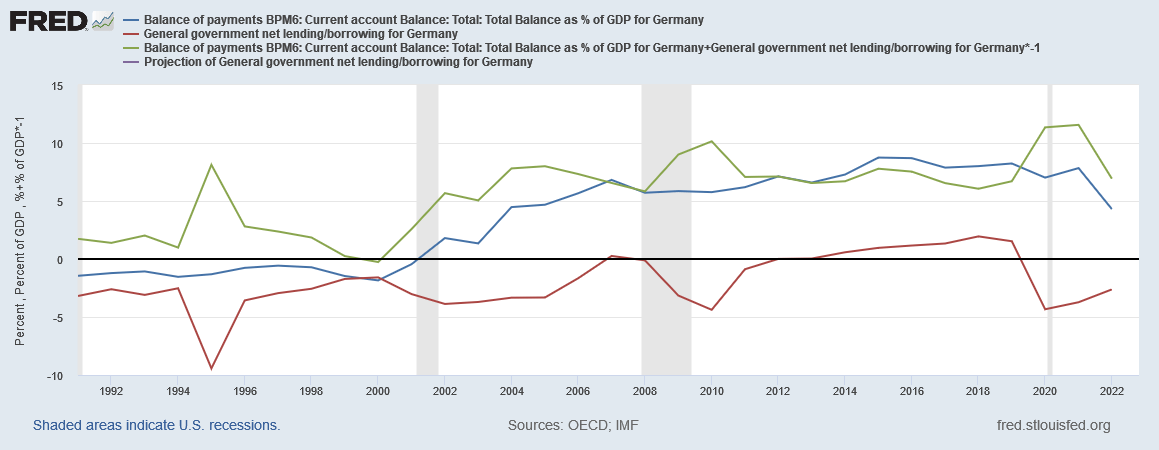
Looking at the chart it appears that in 2024 GDP will be in negative territory as will the Leading economic indicators. We are unlikely to get a German-style all-time high in the stock market, at the same time, given that the US private domestic sector balance is much weaker than the German one. The German sectoral balances are shown in the chart below. The green line is the all-important private domestic sector balance and it is firmly in surplus and is fueled by both a federal government deficit [red line] and an external sector surplus [blue line].
It is contracting however is still quite wide. As Warren Buffett would say it has a wide moat.
The chart below is for the USA sectoral balances. The all-important private domestic sector green line is barely in surplus, is contracting rapidly, and is being drained by both a large external sector deficit and an ever-smaller federal government deficit. Here there is practically no moat at all.
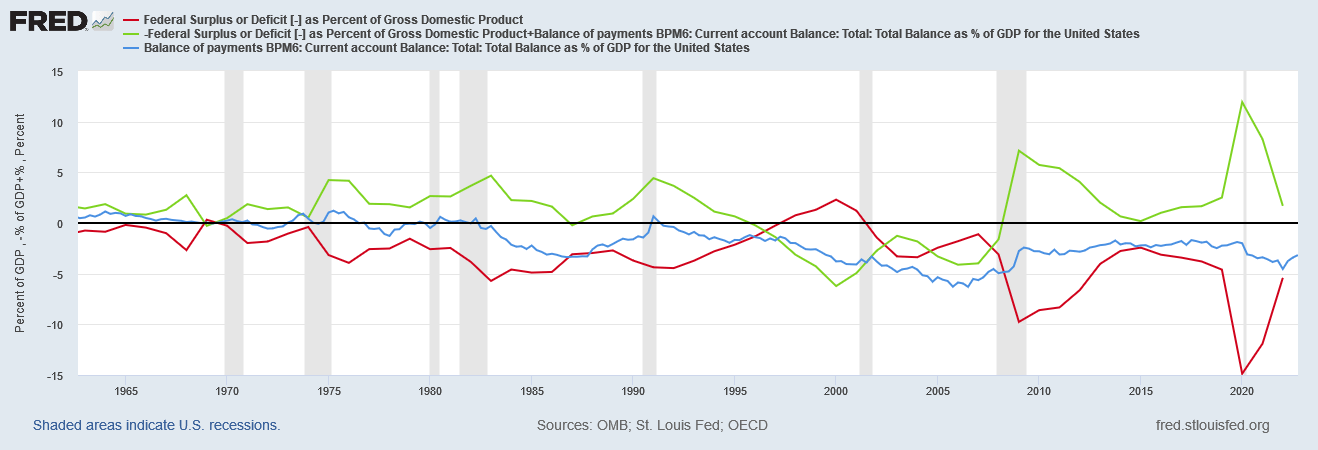
When one adds on the dead weight loss from the Fed interest rate rises the picture becomes worse still. Interest rate rises may begin with an expansionary effect on markets given that they add interest income to the private sector. A point is reached however where the interest burden becomes so great that a tipping point is reached whereupon the overall impact is contractionary as more and more gross domestic income is directed toward dead-weight interest costs that have no counterpart in productive activity. An interest rate rise costs the instigator nothing to produce, burdens the economy, and produces nothing of value. Every additional interest cost over and above the cost of production is pure rentier income, a free lunch, rent extraction, and a function of price over value.
In the immediate period after the interest rate rises, the spending responses from debtors is likely to be restrained because they have capacity to absorb the squeeze by adjusting their wealth portfolios (run down savings etc).
And, at that temporal period, the interest rate rises are likely to be inflationary as businesses pass on their increased borrowing costs in the form of higher prices, and, as noted above, landlords pass on their higher mortgage servicing costs as higher rents, which, in turn, feed into the CPI figure.
...But in the medium- to longer term, if interest rate rises move past some threshold, the impact is to slow spending and increase unemployment.
Eventually, those who benefit from the interest rate increases, who typically have a lower marginal propensity to consume (how much they spend out of every extra $ received), run out of things to buy and pocket the bonuses.
And eventually, the spending cuts from the debtors, particularly lower income mortgage holders, begins to dominate.
(Source: Professor William Mitchel l)
The US stock markets find themselves at present in the first phase of expansion due to rate increases and this will then transition to the second phase where the contraction sets in and markets fall.
On the larger world macroeconomic side, we have the G5 chart below. The chart below comes from Mr. Robert P. Balan of Predictive Analytic Models. The chart shows the level of money creation by the top five world governments (the G5) in a change rate format, along with a host of other indexes. This chart gives a sense of important inflection points and direction.
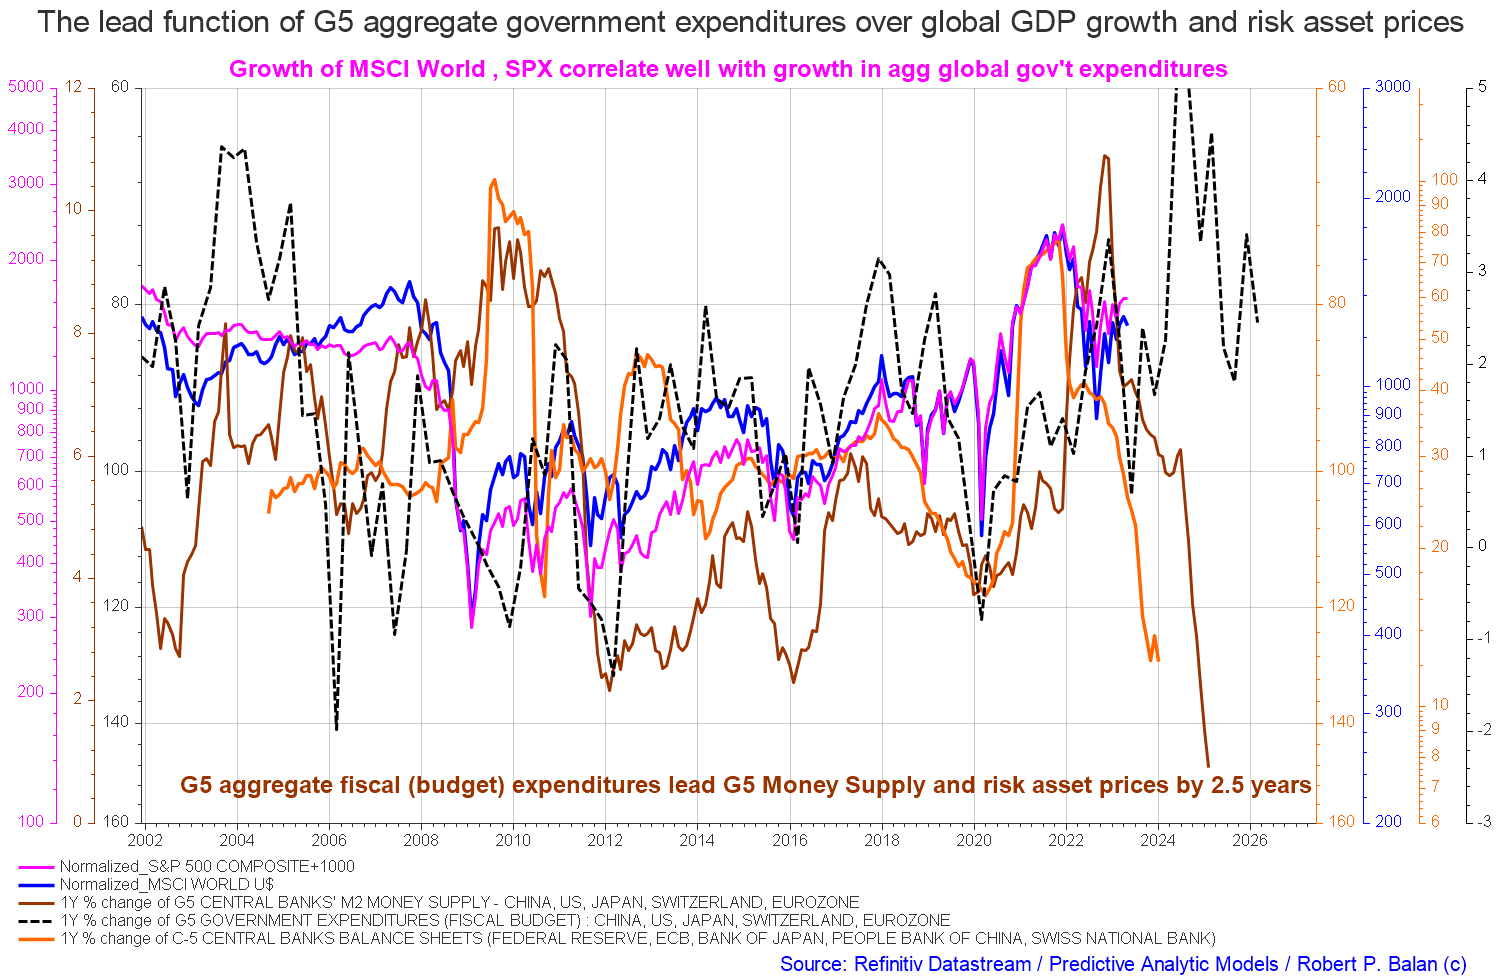
The chart above shows that central bank balance sheets and M2 [orange and brown lines] are still falling hard. The major change over last month is that the total G5 expenditure [black dotted line] has changed form as new data has come in. The line now shows a peak in expenditure in 2024 and then generally falls after that. One could say that now a semblance of co-variance has emerged, after a fairly long period of divergent data, and now all lines are moving down in synchrony. In previous editions, G5 expenditure was showing a positive and growing trend whereas M2 and central bank balance sheets were falling hard. I had often remarked that the best outcome in terms of forecasting certainty was when all lines were moving together in covariance, we have that now and sadly they are moving downwards.
The macro direction is still downwards with local rallies that should be sold.
If you are looking to make a market entry, sometime in the last quarter of 2023, the first quarter of 2024 is likely to be a good time judging by the macro tidal forces that underpin the asset markets. Best to wait now until the recession has come and gone.
For further details see:
The Private Domestic Sector Prints A $130B Surplus In May Pointing To Better Markets In June