LUMN - The Retiree's Dividend Portfolio Jane's December Update: Index-Beating Year-End Results
Summary
- Jane's retirement accounts generated a total of $3,828.20 of dividend income for December 2022 vs. $2,580.62 of dividend income for December 2021.
- Jane's Traditional IRA had a balance of $415K as of December 31, 2022, vs. $439.1K on December 31, 2021. The estimated annualized dividend yield is 5.22%.
- Jane's Roth IRA had a balance of $203.3K as of December 31, 2022, vs. $221K on December 31, 2021. The estimated annualized dividend yield is 5.96%.
- One company eliminated its dividend payment altogether.
- Five companies paid an increased dividend or issued a special dividend during the month of December.
Broadcom's Preferred Stock Series A ((AVGOP)) was recently converted to common shares on September 30th, 2022. The way the conversion worked is that seven shares were converted into 21 shares of Broadcom common shares (AVGO), and then they were given cash in lieu of $382.56 instead of fractional shares.
We purchased these shares during the initial phase of COVID when the preferred shares were selling below the PAR value of $1,000. This was a phenomenal time to purchase these shares and collect the $1240 of dividends while we waited for shares to convert.
Unfortunately, this means that the dividends received will drop from $140 per quarter for the seven shares annually down to $96 quarterly for the 21 shares of common stock. Dividend increases are likely to make it to where these shares will eventually pay more than what was being earned on the preferred stock, but that is a few years out based on the current rate of dividend increases.
Background
For those interested in John and Jane's full background, please click the following link here for the last time I published their full story. The details below are updated for 2022.
- This is a real portfolio with actual shares being traded.
- I am not a financial advisor and merely provide guidance based on a relationship that goes back several years.
- John retired in January 2018 and now only collects Social Security income as his regular source of income.
- Jane officially retired at the beginning of 2021, and she is collecting Social Security as her only regular source of income.
- John and Jane have decided to start taking draws from the Taxable Account and John's Traditional IRA to the tune of $1,000/month each. These draws are currently covered in full by the dividends generated in each account.
- John and Jane have other investments outside of what I manage. These investments primarily consist of minimal-risk bonds and low-yield certificates.
- John and Jane have no debt and no monthly payments other than basic recurring bills such as water, power, property taxes, etc.
I started helping John and Jane with their retirement accounts because I was infuriated by the fees their previous financial advisor was charging them. I do not charge John and Jane for anything that I do, and all I have asked of them is that they allow me to write about their portfolio anonymously in order to help spread knowledge and to make me a better investor in the process.
Generating a stable and growing dividend income is the primary focus of this portfolio, and capital appreciation is the least important characteristic. Providing John and Jane with as much certainty in their retirement remains the primary objective.
Dividend Decreases
One stock in Jane's Traditional or Roth IRA paid a decreased dividend or was eliminated altogether during the month of December.
- Lumen Technologies ( LUMN ).
Lumen Technologies - has always been a speculative play for Jane's portfolio but the stock received a death blow to its history as a high-yield dividend investment. With that said, LUMN will remain in the portfolio and we will likely increase the size of the position because the stock has reached a price that is very compelling from a risk/reward standpoint as the I see the stock price potentially doubling in the next year or two as the dividend investors cut their losses and take their losses. LUMN has also begun shedding non-core businesses that have been a drain on their operations. For a deeper dive into LUMN I would suggest reading the interview with the new CEO Kate Johnson during Citi's 2023 Communications, Media & Entertainment Conference.
Dividend And Distribution Increases
- Broadcom ( AVGO )
- Crown Castle International ( CCI )
- Honeywell ( HON )
- Main Street Capital ( MAIN )
- Owl Rock Capital ( ORCC ).
HON was covered in the Taxable Account update, so I will only include information about the dividend increases. Those interested in reading the summary of these three companies can check the link included at the end of the article.
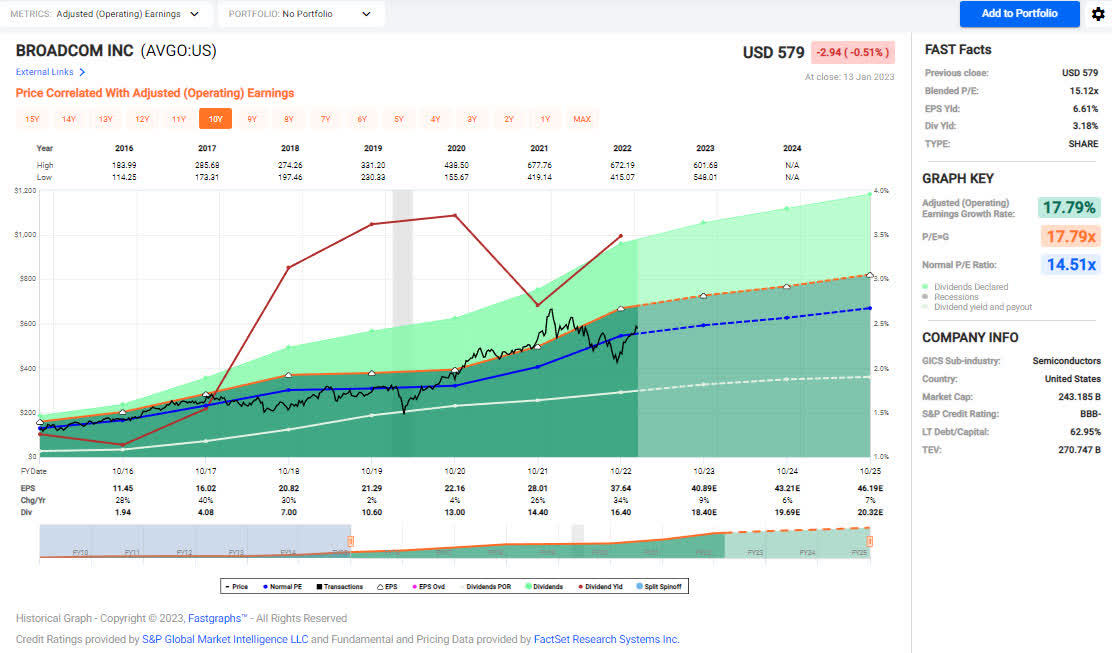
Broadcom - First, shares of AVGOP (Preferred Series A) converted over to common stock in the Traditional IRA (these shares were purchased when the common stock got pummeled during the initial phase of COVID). Common stock of AVGO has been held in the Roth IRA for several years and has performed quite well (with most shares also bought during the COVID downturn).
I don't track AVGO too closely, but the recent headlines about Apple (AAPL) moving away from some AVGO components is enough to catch my attention because AAPL is responsible for approximately 20% of Broadcom's revenue. I think the article by Michael Fitzsimmons titled Broadcom: CEO Shakedown - Hock Tan Vs. Tim Cook is a great read that gives this issue more context. My takeaway is that even if AAPL succeeds, the impact will be minimal, so there is no reason to believe that the investment thesis for AVGO will change. AVGO offers an incredible 10-year dividend CAGR of 39.4% and its five-year CAGR is 28.6%. As with any dividend stock, we expect there to be some degree of moderation to these sizeable dividend increases but these numbers are still absolutely fantastic.
AVGO - FastGraphs 2023-1 (FastGraphs)
The dividend was increased from $4.10/share per quarter to $4.60/share per quarter. This represents an increase of 12.2% and a new full-year payout of $18.40/share compared with the previous $16.40/ share. This results in a current yield of 3.16% based on the current share price of $579.00.
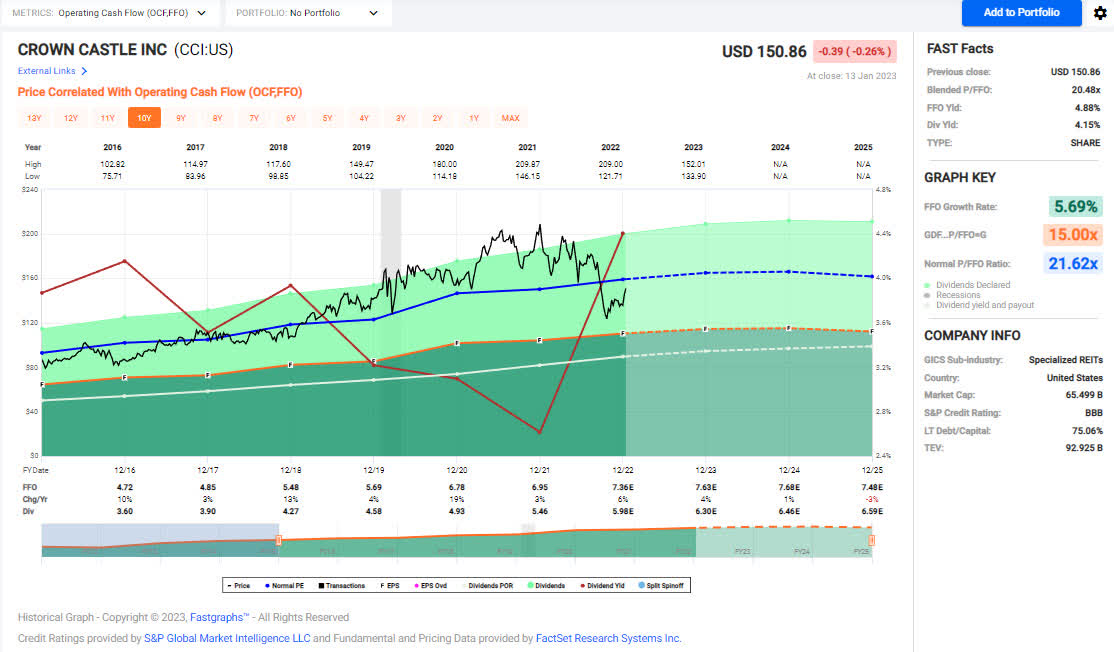
Crown Castle International - Like with many real estate investment trusts ("REITs") over the last few months, CCI's stock price cratered and we added on the drop and luckily at the bottom. Even though the stock is well off its $200/share valuation, we are sitting pretty close to the breakeven point if we sold all shares. We plan to hold CCI and potentially buy more on a decent drop or to sell some of the higher cost shares if the stock price reaches into the $170-$180/share range. CCI has continually targeted mid-high single-digit dividend increases over the last ten years but I expect those increase will moderate due to the churning of Sprint sites. Inside Towers had this to say:
In its 1Q21 reports, CCI gave the first indication of potential revenue churn if TMUS decommissions existing Sprint sites. Though negligible in the quarter, CCI expects the first meaningful Sprint churn in 2023, and less than $20 million through 2028, after which bulk churn may be realized. The company will update the Sprint churn data periodically.
CCI - FastGraphs 2023-1 (FastGraphs)
The dividend was increased from $1.47/share per quarter to $1.565/share per quarter. This represents an increase of 6.5% and a new full-year payout of $6.26/share compared with the previous $5.88/ share. This results in a current yield of 4.14% based on the current share price of $150.86.
Honeywell - The dividend was increased from $.98/share per quarter to $1.03/share per quarter. This represents an increase of 5.1% and a new full-year payout of $4.12/share compared with the previous $3.92/share. This results in a current yield of 1.92% based on the current share price of $210.04.
Main Street Capital - Between the dividend increases and supplemental dividends I have written quite a bit about MAIN over the last few months (a great problem to have if you ask me). Although the results have been excellent it is worth noting that its private loan portfolio saw volume drop from $269.9 million to $44.2 million (Q3-2022 to Q4-2022). This isn't necessarily anything to be alarmed about especially when the risk of recession seems like it could be waiting to strike at any moment. Management continues to deliver and I believe that MAIN is one of the most well-run companies an investor can buy and I truly believe that there is great alignment between management objectives and shareholder returns.
Ares Capital ( ARCC ) is another commonly cited business development company ("BDC") with a long track record and currently pays a 10% dividend yield. Although the dividend yield of ARCC is more compelling, MAIN has offered true capital appreciation while ARCC's share price has been relatively flat over a 10-year period. MAIN is currently ranked as a hold but we would consider adding more if the stock price dropped below $35/share.
The dividend was increased from $.220/share per month to $.225/share per month. This represents an increase of 2.3% and a new full-year payout of $2.70/share compared with the previous $2.64/ share. This results in a current yield of 7.01% based on the current share price of $38.51.
MAIN also paid a special supplemental dividend of $.10/share during the month of December.
Owl Rock Capital - I previously wrote an article about ORCC , "Owl Rock Capital - Build A Position Before Q3 2022 For Maximum Upside," at the time we added it to Jane's Retirement portfolio and noted that the rising LIBOR rates were finally going to exceed to minimum floor rates which means that ORCC is going to be generating more interest income. Although the stock price hasn't done a lot, the company's earnings have improved similar to what I expected. Management has decided to push the extra NII to shareholders with a dividend increase by also paying a special dividend in the month of December. ORCC isn't as time-tested as MAIN but the discount to NAV and results so far make it a much more compelling investment option since you don't have to pay a major premium like you would with MAIN.
Investors that focus on purchasing shares at or close to $12.00/share will lock in the highest upside potential with a very minimal downside risk of capital loss.
The dividend was increased from $.31/share per quarter to $.33/share per quarter. This represents an increase of 6.5% and a new full-year payout of $1.32/share compared with the previous $1.24/ share. This results in a current yield of 10.25% based on the current share price of $12.88.
ORCC also paid a special supplemental dividend of $.03/share during the month of December.
Retirement Account Positions
There are currently 38 different positions in Jane's Traditional IRA and 22 different positions in Jane's Roth IRA. While this may seem like a lot, it is important to remember that many of these stocks cross over in both accounts and are also held in the Taxable Portfolio.
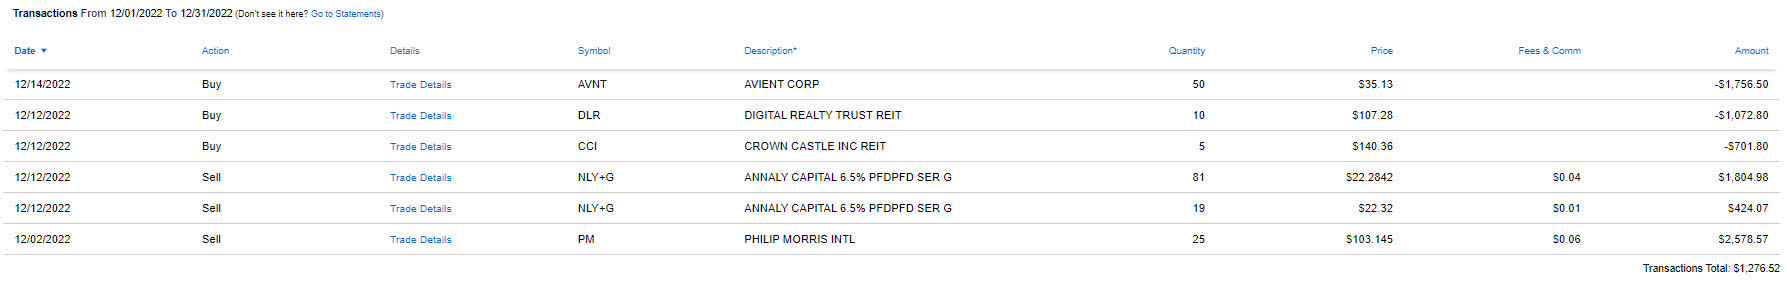
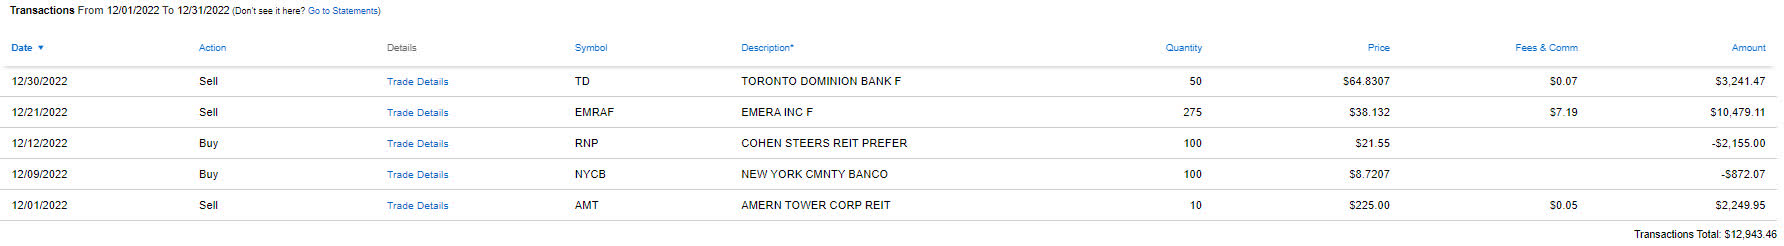
Below is a list of the trades that took place in the Traditional IRA during the month of December.
Traditional IRA - 12-2022 - Trades (Charles Schwab) Roth IRA - 12-2022 - Trades (Charles Schwab)
For a more details discussion look for my article coming up regarding the trades that took place during the month of December.
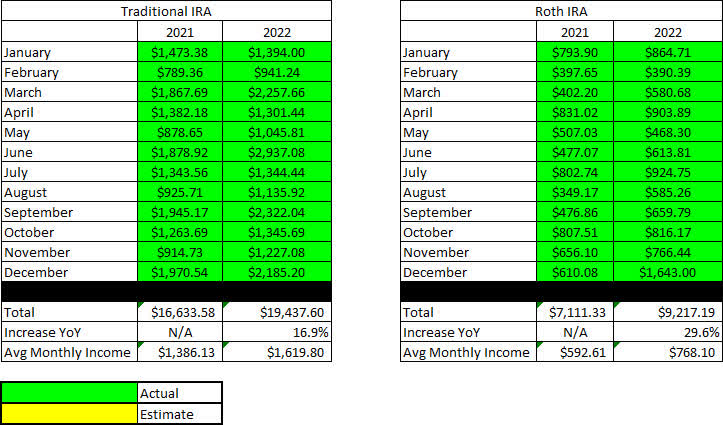
December Income Tracker - 2021 Vs. 2022
Income for the month of December was up modestly year-over-year for Jane's Traditional IRA and up significantly for her Roth IRA.
- The average monthly income for the Traditional IRA in 2022 (compared to 2021) was up 16.9% YoY.
- The average monthly income for the Roth IRA in 2022 (compared to 2021) was up 29.6% YoY.
This means the Traditional IRA generated an average monthly income of $1,619.80/month and the Roth IRA generated an average income of $768.10/month. This compares with 2021 figures of $1,386.13/month and $592.61/month, respectively.
SNLH = Stocks No Longer Held - Dividends in this row represent the dividends collected on stocks that are no longer held in that portfolio. We still count the dividend income that comes from stocks no longer held in the portfolio even though it is non-recurring.
All images below come from Consistent Dividend Investor, LLC. (Abbreviated to CDI).
Traditional IRA - 2021 V 2022 - December Dividends ((CDI)) Roth IRA - 2021 V 2022 - December Dividends ((CDI))
Here is a graphical illustration of the dividends received on a monthly basis for the Traditional and Roth IRAs.
Retirement Projections - 2022 - December - Monthly Dividends (Bar Graph) ((CDI))
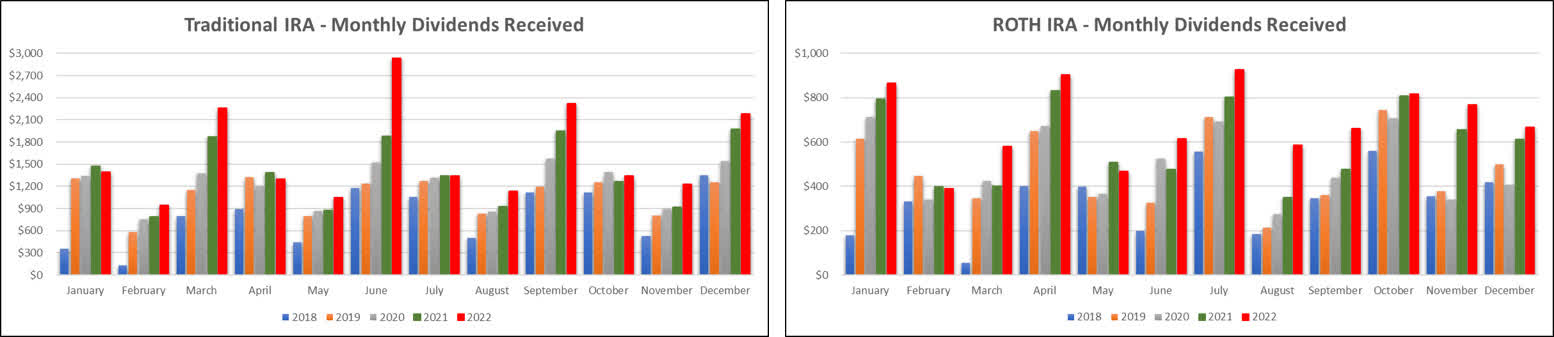
The table below represents the actual full-year results for 2022 and the prior year.
Retirement Projections - 2022 -December ((CDI))
Below is an expanded table that shows the full dividend history since inception for both the Traditional IRA and Roth IRA.
Retirement Projections - 2022 - December - 5 YR History ((CDI))
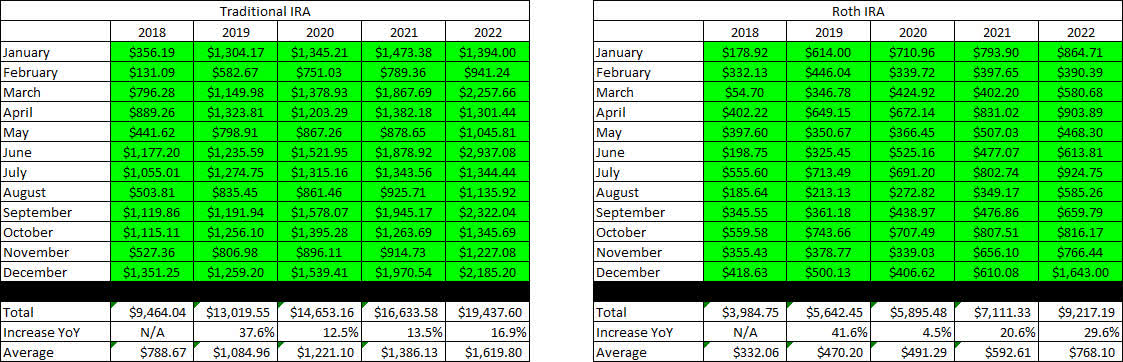
I have included line graphs that better represent the trends associated with Jane's monthly dividend income generated by her retirement accounts. The images below represent the Traditional IRA and Roth IRA, respectively.
Retirement Projections - 2022 - December - Monthly Dividends ((CDI))
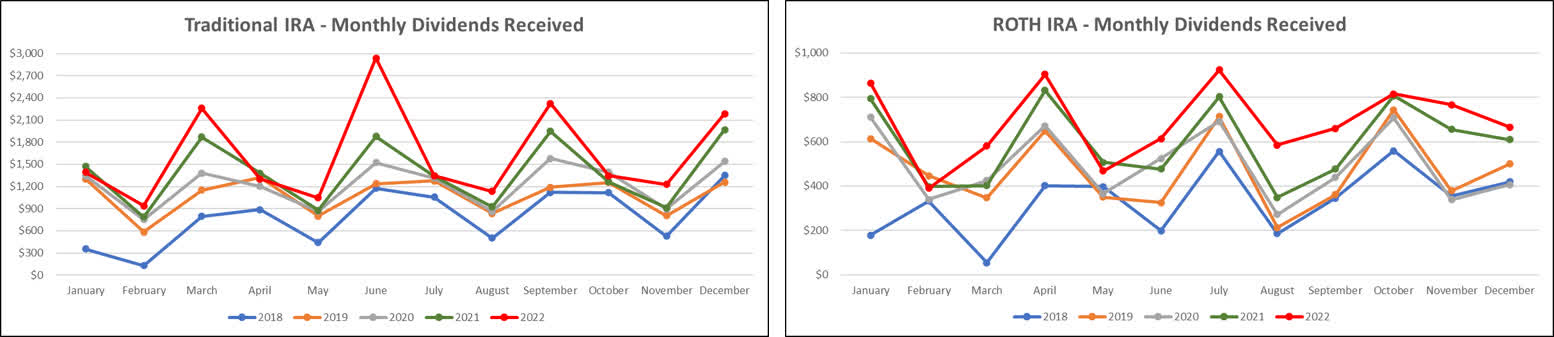
Here is a table to show how the account balances stack up year over year (I previously used a graph but believe the table is more informative).
It is worth noting that with John and Jane Retired, there will be no additional contributions to these accounts. In fact, they have already begun to take regular distributions from the Taxable Account and John's Traditional IRA.
Retirement Account Balances - 2022 - December ((CDI))
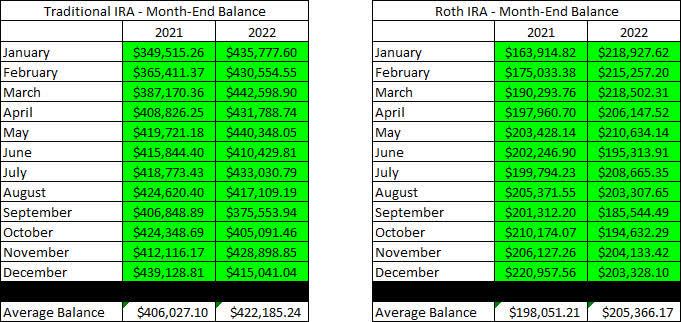
The next images are the tables that indicate how much cash Jane had in her Traditional and Roth IRA Accounts at the end of the month as indicated on their Charles Schwab statements.
Retirement Projections - 2022 - December - Cash Balances ((CDI))
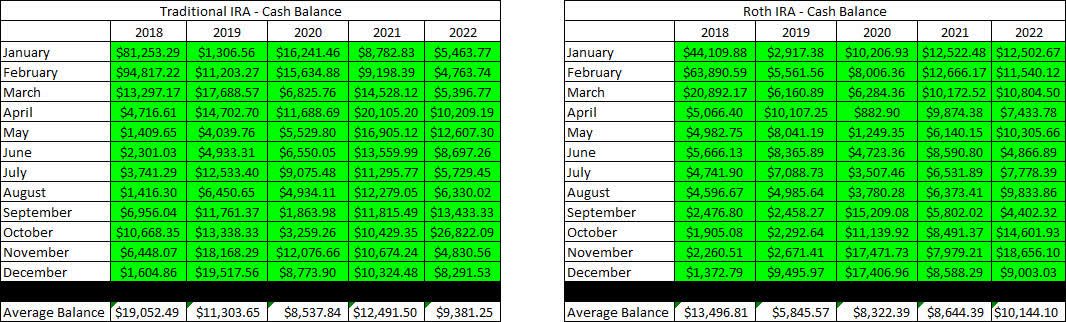
The next image provides a history of the unrealized gain/loss at the end of each month in the Traditional and Roth IRAs going back to the beginning in January of 2018.
Retirement Projections - 2022 - December - Unrealized Gain-Loss ((CDI))
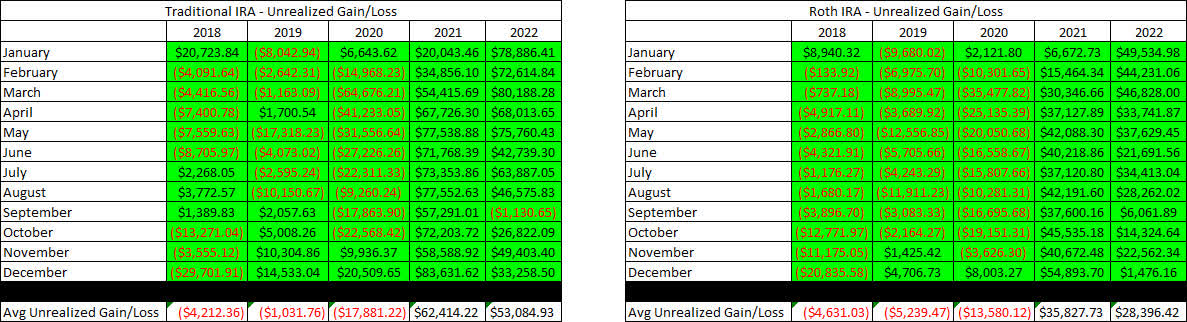
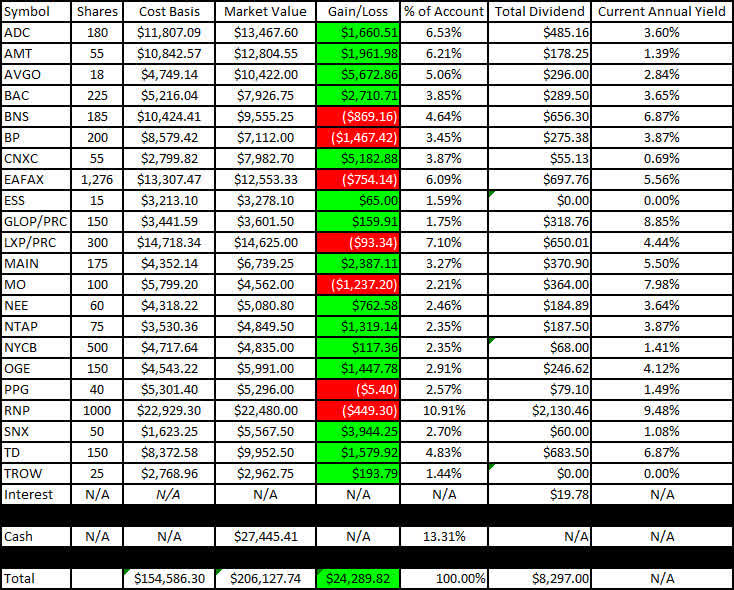
I like to show readers the actual unrealized gain/loss associated with each position in the portfolio because it is important to consider that in order to become a proper dividend investor, it is necessary to learn how to live with volatility. The market value and cost basis below are accurate at the market close on December 13th.
Here is the unrealized gain/loss associated with Jane's Traditional and Roth IRAs.
Traditional IRA - 2022 - December - Gain-Loss ((CDI)) Roth IRA - 2022 - December - Gain-Loss ((CDI))
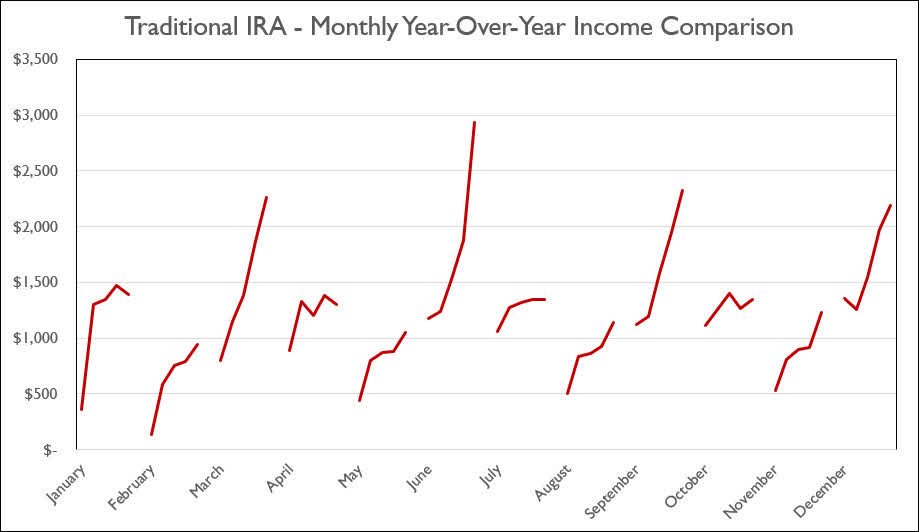
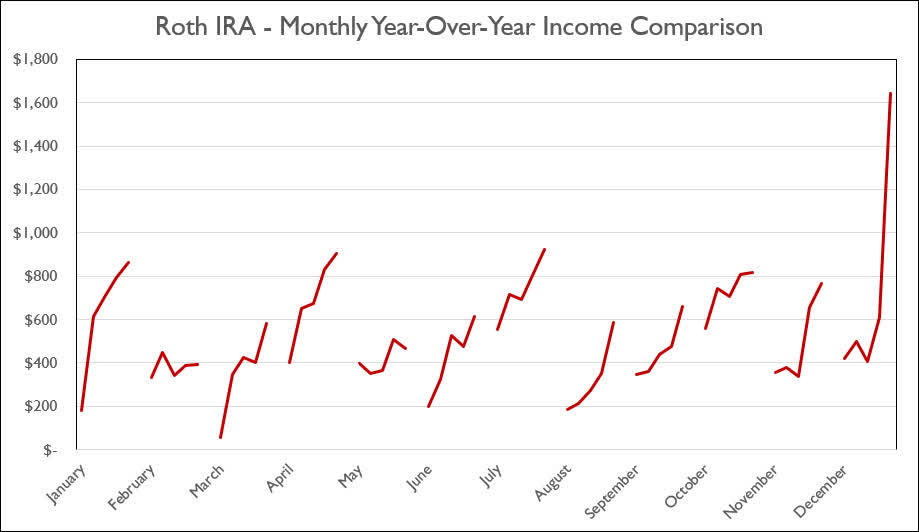
The last two graphs show how dividend income has increased, stayed the same, or decreased in each respective month on an annualized basis.
Traditional IRA - 2022 - December - Monthly Year-Over-Year Comparison ((CDI)) Roth IRA - 2022 - December - Monthly Year-Over-Year Comparison ((CDI))
Conclusion
As with the Taxable Account article, I want to look at how the stock performed from the beginning of the year to the end of the year. The main difference is that there were no withdrawals taken from the Traditional or Roth IRA so I won't be adding that back into the results.
We always use the three primary indexes as a baseline to compare against to determine how the account performed during this time.
Traditional IRA
- The closing balance of $439,128.81 on December 31, 2021.
- The closing balance of $415,041.04 on December 31, 2022.
This means that the account balance is down -5.49% FY-2022.
Roth IRA
- The closing balance of $220,957.56 on December 31, 2021.
- The closing balance of $203,328.10 on December 31, 2022.
This means that the account balance is down -7.98% FY-2022.
Performance Comparisons
The Taxable Account (when we take into account the $12,000 withdrawn) was only down -2.86% which is considerably better than the Traditional IRA results of -5.49% and Roth IRA results of -7.98%. So the question is, why are the results so different?
- The Traditional and Roth IRAs have more exposure to tech-related companies which have suffered the most during this time.
- The Traditional and Roth IRAs have more exposure to REITs that have taken a hit over the last year (in many cases, falling from the 52-week-high to a 52-week-low).
- We have also seen a drop in some companies that have historically been solid dividend stocks. The primary example of this is 3M ( MMM ).
The chart below represents some of the most interesting culprits in the portfolio that have seen substantial drops in share price.
The real question is whether or not this is something that needs to be addressed as we begin 2023 and the answer is no. Other than LUMN, the impact of lower share prices represent buying opportunities to get shares at a substantial discount. For most of these companies, there is nothing broken or wrong with their business model and we have even seen improvement in share price for some of these companies over the last three months.
Overall we have happy with the results of the Traditional and Roth IRAs because the account has outperformed all three major indexes over the same time frame in FY-2022. Just like the Taxable Account article, I wanted to show how some major ETFs performed during the same time frame (I feel like a common criticism I hear is that John and Jane should put their funds into ETFs because those would have performed much better).
This means that the portfolio was able to preserve capital better than the comparable ETFs would have because even if we threw all of the money from Jane's accounts into SPDR Dow Jones Industrial Avg ETF ( DIA ) both the Traditional and Roth IRAs would still have performed better and would have still lacked the diversification seen in the portfolio now while also generating a dividend yield that is substantially lower.
- DIA Current Dividend Yield - 1.87%
- SPY Current Dividend Yield - 1.59%
- QQQ Current Dividend Yield - .76%
These compare to the current yields of 5.22% and 5.96% for the respective Traditional and Roth IRAs.
December Articles
I have provided the link to the December 2022 Taxable Account below.
The Retirees' Dividend Portfolio: John And Jane's December Taxable Account Update .
In Jane's Traditional and Roth IRAs, she is currently long the following mentioned in this article: AbbVie ( ABBV ), Agree Realty ( ADC ), Agree Realty Preferred Series A ( ADC.PA ), Archer-Daniels-Midland ( ADM ), Broadcom ( AVGO ), Avient ( AVNT ), Bank of America ( BAC ), BlackRock Health Sciences Trust ( BME ), Bank of Nova Scotia ( BNS ), BP ( BP ), British American Tobacco ( BTI ), Canadian Imperial Bank of Commerce ( CM ), Cummins ( CMI ), Concentrix ( CNXC ), Digital Realty ( DLR ), Eaton Vance Floating-Rate Advantage Fund A ( EAFAX ), Enbridge ( ENB ), EPR Properties Preferred Series E ( EPR.PE ), Eaton Corporation ( ETN ), East West Bancorp ( EWBC ), General Mills ( GIS ), GasLog Partners Preferred C ( GLOP.PC ), Honeywell ( HON ), International Business Machines ( IBM ), Iron Mountain ( IRM ), Lexington Realty Preferred Series C ( LXP.PC ), Lumen Technologies ( LUMN ), LyondellBasell ( LYB ), Main Street Capital ( MAIN ), 3M ( MMM ), Altria ( MO ), Annaly Capital Preferred Series G ( NLY.PG ), NextEra Energy ( NEE ), NetApp ( NTAP ), New York Community Bank ( NYCB ), Realty Income ( O ), OGE Energy Corp. ( OGE ), Oxford Lane Capital Corp. 6.75% Cum Red Pdf Shares Series 2024 ( OXLCM ), Philip Morris ( PM ), PPG Industries ( PPG ), PIMCO Corporate & Income Opportunity Fund ( PTY ), Cohen & Steers REIT & Preferred Income Fund ( RNP ), Royal Bank of Canada ( RY ), TD SYNNEX Corp. ( SNX ), STORE Capital ( STOR ), Toronto-Dominion Bank ( TD ), Unilever ( UL ), UMH Properties ( UMH ), Verizon ( VZ ), Williams Companies ( WMB ), W. P. Carey ( WPC ).
For further details see:
The Retiree's Dividend Portfolio, Jane's December Update: Index-Beating Year-End Results