PEP - The Retiree's Dividend Portfolio John's February Update: Opportunities In Energy Stocks
2023-03-25 09:00:00 ET
Summary
- John's retirement accounts generated a total of $1,312.50 of dividend income for February 2023 vs. $1,188.66 of dividend income for February 2022.
- John's Traditional IRA had a balance of $357.3K as of February 28, 2023, vs. $356.8K on February 28, 2022. The estimated annualized yield is 4.99%.
- John's Roth IRA had a balance of $209.1K as of February 28, 2023, vs. $215K on February 28, 2022. The estimated annualized yield is 5.23%.
- There was one company that paid an increased dividend during the month of February.
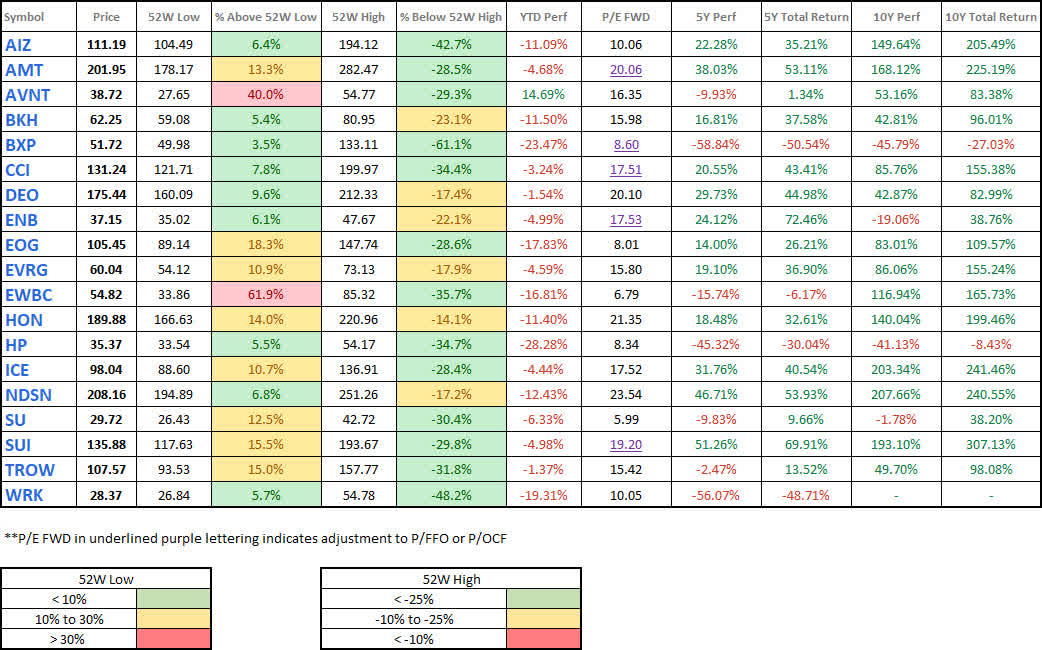
Watchlist
The last update was all about the chaos of the financial sector, and since then we have seen weakness in another industry that has been performing exceptionally well in recent months: Energy.
Crude oil reached a 15-month low last week, which is notable because 15 months ago the energy markets were in shambles with many prominent energy names trading at substantially lower prices than we see today. This begs the question of whether or not the current share price of well-known oil companies is justified. Schlumberger Limited ( SLB ) is a different animal in the sense that it provides support services that improve the efficiency of oil field operations while the other three function as producers of oil and gas.
All of the companies shown are currently owned by John and Jane in one of their portfolios, and all of them have benefitted greatly from the improved crude oil prices as energy demand skyrocketed after governments began to reduce COVID-19 restrictions. One of the largest ETFs, SPDR Energy Select Sector ( XLE ), demonstrates the connection to brent crude oil spot price (although that relationship has deviated significantly in the first three months of 2023).
There are two companies I have decided to add to the watchlist, neither of which are mentioned above.
The reason for adding SU is that it represents a fairly valued company with very stable reserves that makes them a low-cost producer. Additionally, SU is trading near its 52-week low while many of the names listed above in John and Jane's portfolio continue to fall from their 52-week highs.
EOG is one of the larger oil exploration and production companies in the U.S., but it gets overlooked in a sea of giants like Exxon Mobil Corporation ( XOM ) and Chevron Corporation ( CVX ). What makes EOG different is that it has extremely low break-even costs which means more profit when prices are high and the ability to outlast the competition when times are difficult (which has been a major theme of energy companies that have survived over the last five years). The result of efficient operations is that the company has begun to generate massive cash flow and is returning a good chunk of it to shareholders. The dividend was recently increased by 10% and the company has adopted a special dividend policy that sweetens the deal for shareholders.
For this watchlist update, we decided to remove two of the recently added financials, First Republic Bank ( FRC ) and PacWest Bancorp ( PACW ). The reason for adding these was mainly because the market was moving so quickly on the limited information available that we wanted to keep these in mind in case the panic was a complete overreaction. From what I gather so far, there seems to be practically no upside for FRC common shares even in a best-case scenario. PACW has more upside potential than FRC, but my concern really has to do with the complicated relationship between venture capitalists and their confidence in PACW. In an effort to keep the watchlist a reasonable length, my goal is to limit it to around 20 items (although I will go higher if it makes sense).
Valuation
Dividends
Watchlist - Dividend - 2023-3-20 (Seeking Alpha)
Debt Profile
Watchlist - Debt Metrics - 2023-3-20 (Seeking Alpha)
Watchlist Conclusion
Look for challenges in the energy sector that will create opportunities to pick up shares like EOG or SU. We recently established a position in EOG in Jane's Retirement Portfolio.
The dividend table above states that EOG is not paying a higher yield than the 4 Year Average but keep in mind that this does not include the special dividend being paid out which pushes the yield well above its 4 Year Average.
Background
For those interested in John and Jane's full background, you can find at least three articles a month published for the last five years detailing the performance of their portfolio. I have continued to evolve the report over time by adding and removing information/images to make the updates more useful to the average investor. Here are the key details that should be understood when reading these updates.
- This is a real portfolio with actual shares being traded. This is not a practice portfolio which is why I include screenshots from Charles Schwab to document every change that is made.
- I am not a financial advisor and merely provide guidance based on a relationship that goes back several years.
- John retired in January 2018 and has collected Social Security income as his regular source of income. John also currently withdraws $1,000/month from his Traditional IRA.
- Jane retired at the beginning of 2021 and decided to begin collecting Social Security early and has not made any withdrawals from her retirement accounts yet.
- John and Jane began drawing funds from the Taxable Account in 2022 at $1,000/month. After speaking with them this amount has been increased to $1,700/month. This withdrawal is still covered entirely by dividend and interest income.
- John and Jane have other investments outside of what I manage. These investments primarily consist of minimal-risk bonds and low-yield certificates.
- John and Jane have no debt or monthly payments other than basic recurring bills such as water, power, property taxes, etc.
The reason why I started helping John and Jane with their retirement accounts is that I was infuriated by the fees they were being charged by their previous financial advisor. I do not charge John and Jane for anything that I do .
The only request I have made of John and Jane is that they allow me to publish their portfolio anonymously because I want to help as many people as I can while holding myself accountable and improving my thought process.
I started this series to address issues I have had when reading other authors with similar types of updates (I am not saying they are wrong, but I found myself questioning their actual performance because they never provided enough information to cover loose ends).
Here is my promise to readers:
- I aim to give as much information as needed so readers can feel confident that what I do is real.
- Even if you agree the results are real this does not mean I expect you to agree with me and I will always answer constructive criticism whenever possible. I will respond with the same genuine intent that the question was asked with.
- I am very transparent about the portfolio and consistency is a significant goal of mine. All of my data points (unless noted otherwise) are derived from month-end statements from Charles Schwab. Even when things aren't looking great (Spring 2020 for example) you will know because I provide enough information that it would be impossible for me to manipulate.
- This article is not intended to be advice or a call to action and is for informational purposes only (I am not a financial advisor and I don't claim to be one). My goal is to challenge conventional thinking and empower you to take control of your investments (if that's something you want to do).
While many authors require paid subscriptions to see their portfolio I do not want to go that route and will continue to publish this series for free as long as there is enough interest to make it worth my time (and I spend A LOT of time on these articles).
Generating a stable and growing dividend income with an emphasis on capital preservation has become the primary focus of this portfolio. I am least concerned about capital appreciation which is why the decisions made will seem pretty conservative most of the time. I may measure the performance of the portfolio relative to indexes and ETFs but the key metric I am focused on is delivering a more stable source of cash flow to John and Jane over time that allows them to live a comfortable retirement that includes minimal stress related to finances.
Dividend Decreases
No companies in John's Traditional and Roth IRA accounts eliminated or reduced their dividend during the month of February.
Dividend Increases
One company paid increased dividends/distributions or a special dividend during the month of February.
- STAG Industrial, Inc. ( STAG ).
STAG Industrial - STAG's most recent earnings report conference call was a review of its steadily growing business with annual rental increases for leases over the last 12 months averaging 3%. The company is off to a quick start addressing 61.5% of the leases that are coming due for renewal in 2023. STAG properties carry average annual rent escalators of 2.5% across the entire portfolio so the company is well-positions to continue offering steady returns. Heading into the end of 2022 STAG achieved an occupancy rate of 99% across the portfolio even though their guidance includes an estimated 50 basis points of occupancy loss.
Since February 1st, STAG's stock price has been in-line with the losses seen by Vanguard Real Estate ETF ( VNQ ), and only recently does it look like STAG is stabilizing even as VNQ continues to move lower. Over the last five months, we have seen the price stabilize above $31/share so investors may want to consider adding. STAG's price has really only dropped below this mark for very short periods of time and it's usually due to event-driven situations such as COVID or the chain of interest rate increases from mid-2022 through the end of the year. The stock has typically been a compelling purchase at a yield of 4.5% and a very strong buy at 4.75%.
The dividend was increased from $.1217/share per month to $.1225/share per month. This represents an increase of .7% and a new full-year payout of $1.47/share compared with the previous $1.46/ share. This results in a current yield of 4.63% based on the current share price of $31.86.
Retirement Account Positions
There are currently 39 different positions in John's Traditional IRA and 23 different positions in John's Roth IRA. While this may seem like a lot, it is important to remember that many of these stocks cross over in both accounts and are also held in the Taxable Portfolio.
Below is a list of the trades that took place in the Traditional IRA during the month of February.
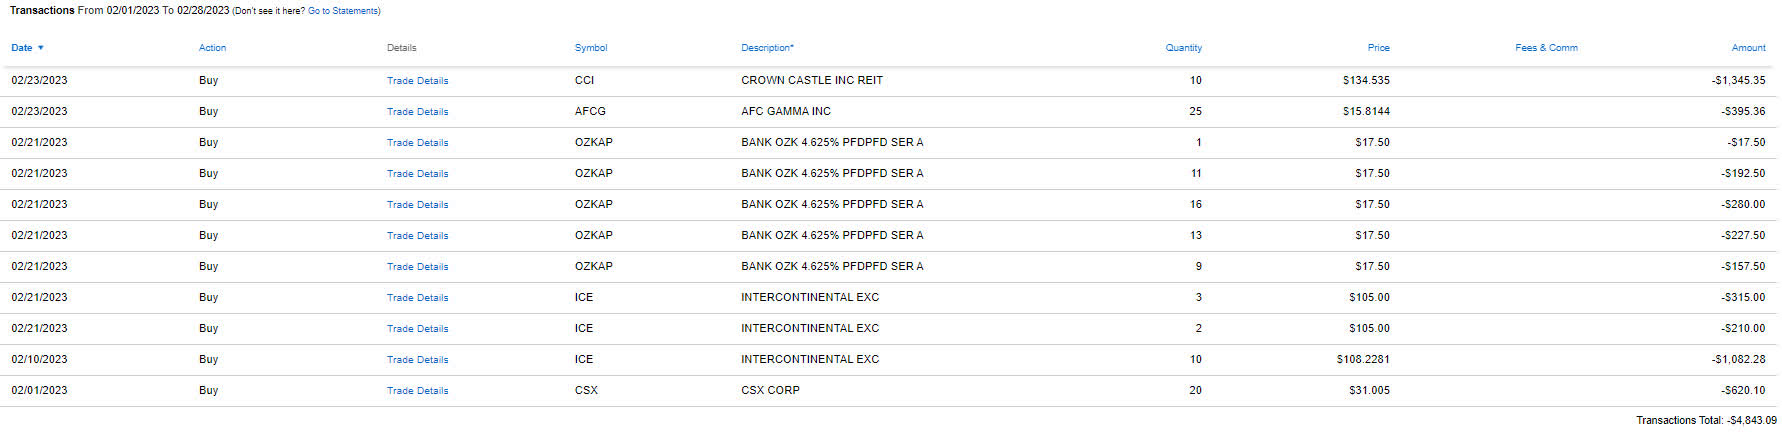
Below is a list of the trades that took place in the Roth IRA during the month of February.
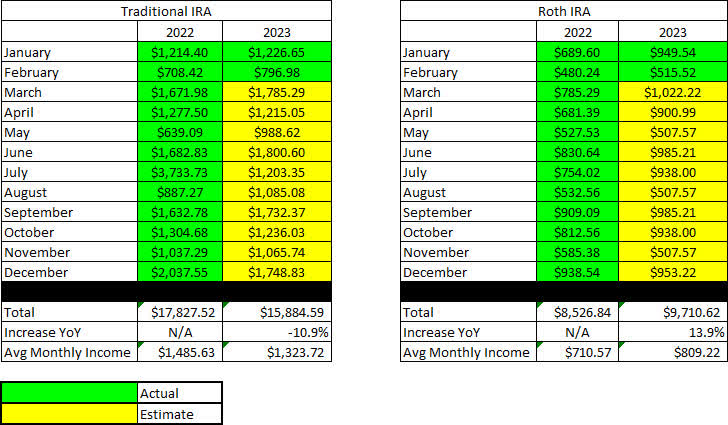
February Income Tracker - 2022 Vs. 2023
We are starting with a clean slate for 2023, and with all of the expected dividends (based on currently owned shares and announced dividend payments) the account is set for a large decrease in the Traditional IRA and a large increase in the dividend income generated by the Roth IRA. The reason for the large decrease in the Traditional IRA was the special dividend paid by Healthcare Trust of America ((HTA)) when it was acquired by Healthcare Realty ( HR ) - This can also be seen in the huge growth in 2022 dividends which came in at a whopping 35.3%. If this dividend is removed then the growth year-over-year is trending as flat overall. While it's possible we could see more special dividends in 2023 I think it's more likely that executive management will focus on deleveraging or stock buybacks in most cases.
The Traditional IRA is expected to generate an average of $1,323.72/month of dividend income in 2023 compared to the average monthly income of $1,485.63 generated in FY-2022. The Roth IRA is expected to generate an average of $809.22/month of dividend income in 2023 compared to the average monthly income of $710.57 generated in FY-2022.
Once dividend increases are factored in and the additional interest income from CDs I expect we will see a very light increase in dividend income of 3-4%. (In this assumption I am also factoring out the large special dividend from the HTA acquisition but if I leave that in then I estimate we will see an overall negative combined dividend yield growth of 1-2%.)
John plans to continue collecting $1,000/month from his Traditional IRA which matches the amount he withdrew monthly in 2022.
SNLH = Stocks No Longer Held - Dividends in this row represent the dividends collected on stocks that are no longer held in that portfolio. We still count the dividend income from stocks no longer held in the portfolio, even though it is non-recurring. All images below come from Consistent Dividend Investor, LLC. ((also referred to as CDI as the source below)).
The tables below represent which companies paid dividends in February and how that income source has changed since February of the previous year.
Traditional IRA - February - 2022 V 2023 Dividend Breakdown (CDI) Roth IRA - February - 2022 V 2023 Dividend Breakdown (CDI)
The table below represents all income generated in 2022 and collected/expected dividends in 2023.
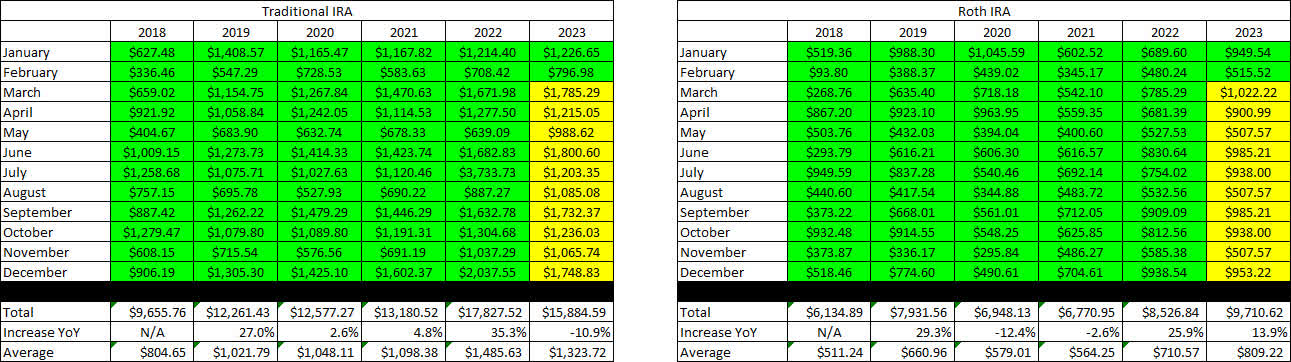
Below gives an extended look back at the dividend income generated when I first began writing these articles. I find this table to be most useful when comparing how dividend income has improved for a specific month over the course of six years.
Retirement Projections - February 2023 - Full Dividend History (CDI)
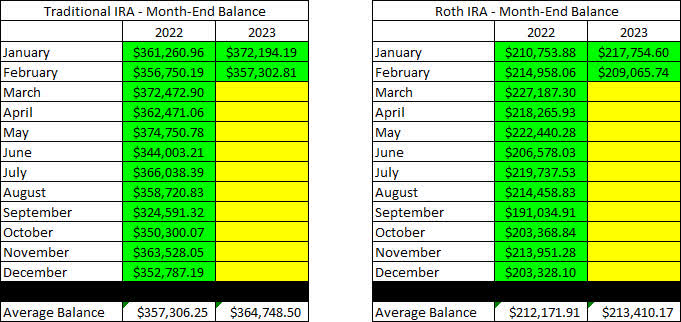
The balances below are from February 28, 2023, and all previous month's balances are taken from the end-of-month statement provided by Charles Schwab.
Retirement Account - Month End Balances - February 2023 (CDI)
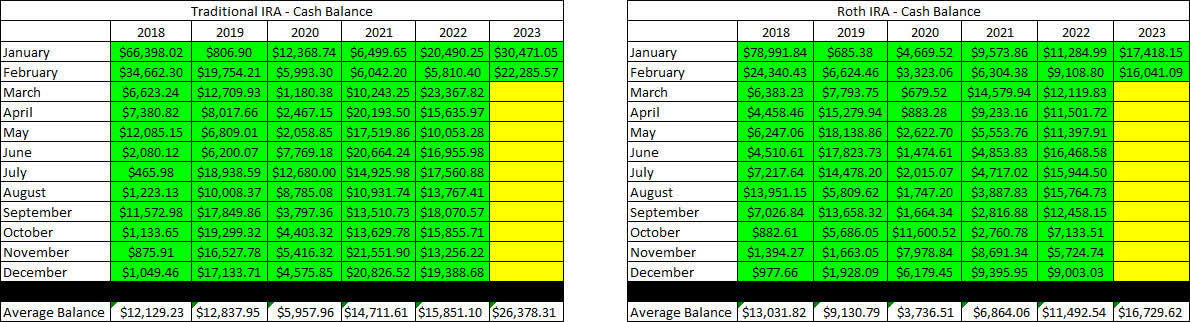
The next image is also pulled from the end-of-month statement provided by Charles Schwab which shows the cash balance of the account.
**Please note that cash balances may fluctuate based on CD renewal dates because I only count the cash that is 100% liquid. There were larger fluctuations in 2019 and 2020 that we the result of deposits and withdrawals being made. There will be no contributions made into either account in 2023 because John is no longer working.
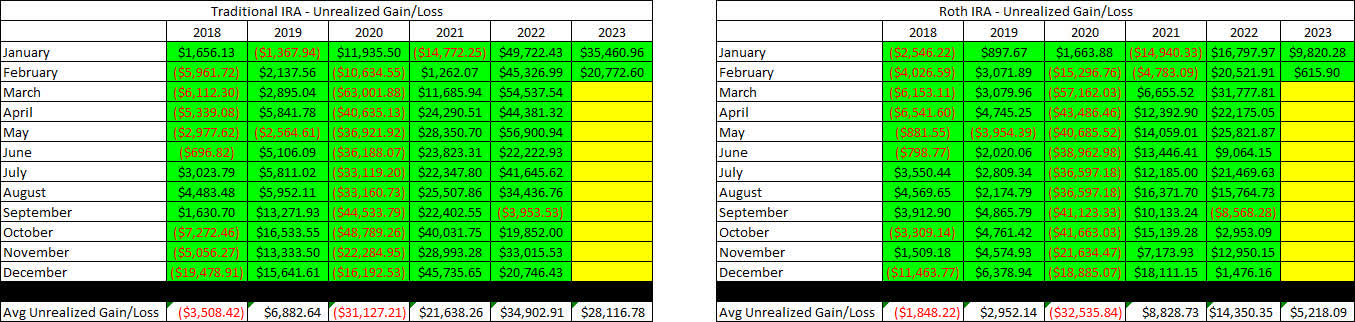
The next image provides a history of the unrealized gain/loss at the end of each month going back to the beginning of January 2018.
Retirement Accounts - February 2023 - Unrealized Gain-Loss (CDI)
I think the table above is one of the most important for readers to understand because it paints a story of volatile markets and why we employ the strategy of generating consistent cash flows to overcome the uncertainty of the market. If we were dependent on selling shares to generate income for John and Jane's retirement they would have to be much more considerate of when they withdraw and how much they choose to withdraw.
For example, a withdrawal in 2020 where shares must be sold would destroy more value by locking in losses or poor performance by stocks being sold compared to selling the same shares and withdrawing funds in 2021.
In an effort to be transparent about John's Account, I like to include an unrealized Gain/Loss summary. The numbers used are based on the closing prices from March 23, 2023.
Traditional IRA - February 2023 - Gain-Loss (CDI) Roth IRA - February 2023 - Gain-Loss (CDI)
It is worth noting in the table above that the yield column is most accurate at the start of the year, but if I reduce the size of positions it may inflate the yield because it is based on how much dividend income is collected. At the same time, it may report excessively low dividends for positions added or significantly increased at the end of the year.
The last image represents the withdrawals being made from John's Traditional IRA, as this is the only account he is currently withdrawing funds from. As mentioned before, he continues to withdraw $1,000/month.
Traditional IRA Withdrawals - February 2023 (CDI)
Conclusion
The Gain-Loss tables demonstrate how fast the market can swing especially when compared to the previous month's article which uses figures pulled from the market close on March 1st.
- Traditional IRA - Unrealized Gain-Loss tables show the value is down $23K.
- Roth IRA - Unrealized Gain-Loss tables show the value is down $20K.
There are a few stocks that have taken a major hit in particular, specifically PacWest Bancorp which was included with a number of other financial institutions during the Silicon Valley Bank ( SIVB ) situation. We fully expect that PACW will suspend its dividend in order to maintain maximum liquidity. We aren't looking to sell shares because I think there is strong enough support from multiple sources to maintain liquidity. The news story
PacWest stock falls after deposits drop 20% YTD, gets $1.4B from Apollo's Atlas SP (updated)" covers this:
Instead, it borrowed $3.7B from the Federal Home Loan Bank, $10.5B from the Federal Reserve's discount window, and $2.1B from the Fed's Bank Term Funding Program. In addition, it received $1.4B of fully funded cash proceeds from Apollo's (NYSE: APO ) Atlas SP Partners through a new senior asset-backed financing facility, the company said.
"Consistent with its announcement on March 17, 2023, the bank continues to benefit from solid liquidity and stabilized deposit balances, with over $11.4B in available cash as of March 20, 2023, which exceeds total uninsured deposits of $9.5B as of March, 20, 2023," the company said in a business update on its liquidity.
Buying bank stocks right now is definitely a high-risk investment choice and we have no plans to add financials unless we are talking about some of the largest players like JPMorgan Chase ( JPM ) or Bank of America ( BAC ).
Investors would benefit from considering the sale of lower-yield assets to short-term CDs or short-term duration bonds. At the end of 2022 we reduced some of our positions in strong companies like Aflac ( AFL ) and PepsiCo ( PEP ), to name a couple, because the stocks appeared fully valued. AFL has since fallen considerably making the yield and potential upside for future gains more attractive again. It can be difficult to sell core holdings like AFL and PEP and some investors would choose to avoid selling based on philosophy but there is always a price you should be willing to sell at especially when you are a retiree looking for safety in your income.
February articles
I have provided the links to February Taxable and Jane's February Retirement articles below.
The Retirees' Dividend Portfolio: John And Jane's February 2023 Taxable Account Update
The Retiree's Dividend Portfolio, Jane's February Update: SVB's Failure Presents Opportunity
In John's Traditional and Roth IRAs, he is currently long the following mentioned in this article: AFC Gamma ( AFCG ), Aflac ( AFL ), Apple Hospitality REIT ( APLE ), Avista ( AVA ), BP plc ( BP ), Brixmor Property Group ( BRX ), Crown Castle ( CCI ), Canadian Utilities ( OTCPK:CDUAF ), Chatham Lodging Trust ( CLDT ), Columbia Banking System ( COLB ), Chevron ( CVX ), CSX ( CSX ), Dominion Energy ( D ), Deere ( DE ), Digital Realty Preferred Series J ( DLR.PJ ), Duke Energy ( DUK ), Eaton Vance Floating-Rate Advantage Fund ( EAFAX ), EPR Properties ( EPR ), EPR Properties Preferred Series G ( EPR.PG ), Healthcare Realty ( HR ), Intercontinental Exchange ( ICE ), Iron Mountain ( IRM ), Kinder Morgan ( KMI ), Kite Realty Group ( KRG ), Lowe's ( LOW ), Main Street Capital ( MAIN ), Masco ( MAS ), Altria ( MO ), New Residential Investment Corp. Preferred Series B (NRZ.PB), Realty Income ( O ), Oshkosh ( OSK ), Occidental Petroleum Corp. ( OXY ), Bank OZK ( OZK ), Bank OZK Preferred Series A ( OZKAP ), PacWest Bancorp ( PACW ), PepsiCo ( PEP ), iShares Preferred and Income Securities ETF ( PFF ), VanEck Vectors Preferred Securities ex Financials ETF ( PFXF ), Pinnacle West ( PNW ), PIMCO Income Fund Class A ( PONAX ), Nuveen Nasdaq 100 Dynamic Overwrite Fund ( QQQX ), Global X Funds Nasdaq 100 Covered Call ETF ( QYLD ), STAG Industrial ( STAG ), Sun Communities ( SUI ), Southwest Gas ( SWX ), AT&T ( T ), Toronto-Dominion Bank ( TD ), Truist Financial ( TFC ), T. Rowe Price ( TROW ), Cohen & Steers Infrastructure Fund ( UTF ), Valero ( VLO ), Ventas ( VTR ), WestRock ( WRK ), Warner Bros. Discovery ( WBD ), and W. P. Carey ( WPC ).
For further details see:
The Retiree's Dividend Portfolio, John's February Update: Opportunities In Energy Stocks