PACWP - The Retiree's Dividend Portfolio John's January Update: 2023 Dividend Projections
2023-03-04 09:00:00 ET
Summary
- John's retirement accounts generated a total of $2,176.19 of dividend income for January 2023 vs. $1,904.00 of dividend income for January 2022.
- John's Traditional IRA had a balance of $372.2K as of January 31, 2023, vs. $361.3K on January 31, 2022. The estimated annualized yield is 5.09%.
- John's Roth IRA had a balance of $217.8K as of January 31, 2023, vs. $210.8K on January 31, 2022. The estimated annualized yield is 5.30%.
- There were nine companies that paid an increased dividend during the month of January.
Dividend projections have been updated for John's Traditional and Roth IRAs for 2023 based on the current dividends being paid and the holdings that are in the account. These numbers will obviously change if and when shares are purchased, sold, etc.
My plan is to implement the "Watchlist" section to my articles starting in March now that I am getting caught back up after returning from vacation.
Background
For those interested in John and Jane's full background, you can find at least three articles a month published for the last five years detailing the performance of their portfolio. I have continued to evolve the report over time by adding and removing information/images to make the updates more useful to the average investor. Here are the key details that should be understood when reading these updates.
- This is a real portfolio with actual shares being traded. This is not a practice portfolio which is why I include screenshots from Charles Schwab to document every change that is made.
- I am not a financial advisor and merely provide guidance based on a relationship that goes back several years.
- John retired in January 2018 and has collected Social Security income as his regular source of income. John also currently withdraws $1,000/month from his Traditional IRA.
- Jane retired at the beginning of 2021 and decided to begin collecting Social Security early and has not made any withdrawals from her retirement accounts yet.
- John and Jane began drawing funds from the Taxable Account in 2022 at $1,000/month. After speaking with them this amount has been increased to $1,700/month. This withdrawal is still covered entirely by dividend and interest income.
- John and Jane have other investments outside of what I manage. These investments primarily consist of minimal-risk bonds and low-yield certificates.
- John and Jane have no debt or monthly payments other than basic recurring bills such as water, power, property taxes, etc.
The reason why I started helping John and Jane with their retirement accounts is that I was infuriated by the fees they were being charged by their previous financial advisor. I do not charge John and Jane for anything that I do .
The only request I have made of John and Jane is that they allow me to publish their portfolio anonymously because I want to help as many people as I can while holding myself accountable and improving my thought process.
I started this series to address issues I have had when reading other authors with similar types of updates (I am not saying they are wrong but I found myself questioning their actual performance because they never provided enough information to cover loose ends.
Here is my promise to readers:
- I aim to give as much information as needed so readers can feel confident that what I do is real.
- Even if you agree the results are real this does not mean I expect you to agree with me and I will always answer constructive criticism whenever possible. I will respond with the same genuine intent that the question was asked with.
- I am very transparent about the portfolio and consistency is a significant goal of mine. All of my data points (unless noted otherwise) are derived from month-end statements from Charles Schwab. Even when things aren't looking great (Spring 2020 for example) you will know because I provide enough information that it would be impossible for me to manipulate.
- This article is not intended to be advice or a call to action and is for informational purposes only (I am not a financial advisor and I don't claim to be one). My goal is to challenge conventional thinking and empower you to take control of your investments (if that's something you want to do).
While many authors require paid subscriptions to see their portfolio I do not want to go that route and will continue to publish this series for free as long as there is enough interest to make it worth my time (and I spend A LOT of time on these articles).
Generating a stable and growing dividend income with an emphasis on capital preservation has become the primary focus of this portfolio. I am least concerned about capital appreciation which is why the decisions made will seem pretty conservative most of the time. I may measure the performance of the portfolio relative to indexes and ETFs but the key metric I am focused on is delivering a more stable source of cash flow to John and Jane over time that allows them to live a comfortable retirement that includes minimal stress related to finances.
Dividend decreases
No companies in John's Traditional and Roth IRA accounts eliminated or reduced their dividend during the month of January.
Dividend increases
Nine companies paid increased dividends/distributions or a special dividend during the month of January.
- Apple Hospitality ( APLE )
- Brixmor Realty ( BRX )
- Chatham Lodging Trust ( CLDT )
- Kite Realty Group ( KRG )
- Main Street Capital ( MAIN )
- Realty Income ( O )
- Bank OZK ( OZK )
- Toronto-Dominion Bank ( TD )
- W. P. Carey ( WPC )
O and WPC were covered in the Taxable Account update while MAIN and TD were covered in Jane's Retirement Account update so I will only include information about the dividend increases associated with these. Those of you who are interested in reading the summary of these two companies can check the links included at the end of the article.
Apple Hospitality - APLE has turned up its dividend payments in 2022 and the special dividend is a great sign that we are getting back to pre-pandemic levels. Using Q4-2022 FFO the dividend was well supported with a payout ratio of 73% using the $.08/month dividend payout moving forward. APLE has performed better than Chatham Hotels (which is currently held in the portfolio and will be reviewed below) and Park Hotels ( PK ) which was a holding that we eliminated from John's Retirement Portfolio back in 2021.
APLE is reasonably priced at current levels although a prospective investor looking for the best entry point could reasonably wait for shares to drop below $16/share.
APLE paid a special supplemental dividend of $.08/share during the month of January.
Brixmor Realty - Other than the impact from the pandemic, BRX has traditionally paid an increased dividend in the month of January. The most recent increase really demonstrates the strength of BRX's business model. Based on 2023 estimates, BRX's dividend coverage is exceptionally strong with the low end of FFO estimates coming in at $1.95/share compared with $1.04/share of dividend income for an estimated payout ratio of 53.3%. In addition to increased leasing activity and same property NOI growth BRX saw "total leased occupancy hit a record 93.8%, anchor leased occupancy increased to 95.9%, and small shop leased occupancy rose to a record 89.2%."
According to FastGraphs the stock is currently trading at fair value and with recent results and the dividend increase I don't think we are going to see many opportunities under $22/share. We are using the five-year FastGraphs to reduce the distortion from the pandemic because the ten-year chart was showing shares as having been vastly overvalued.
The dividend was increased from $.24/share per quarter to $.26/share per quarter. This represents an increase of 8.3% and a new full-year payout of $1.04/share compared with the previous $.96/ share. This results in a current yield of 4.62% based on the current share price of $22.65.
Chatham Lodging Trust - Prior to the pandemic CLDT was paying a $.11/month dividend and had a fairly stable track record of being able to pay monthly dividends that have been consistent back to 2013 (and prior to 2013 the dividend was paid quarterly). The recent announcement to resume the quarterly dividend is similar to the approach that APLE took where it began paying a quarterly dividend of $.01/share and has since moved back to a monthly dividend payer.
The most encouraging part about the Q4-2022 earnings call is just how much management has focused on refinancing existing credit facilities to improve liquidity and also focusing on deleveraging. CEO Jeff Fisher noted that "we've reduced our net debt by $82 million. And we reduced our overall leverage ratio from 31% at the beginning of the year to 26% at year-end. Our net debt reduction is second best among all the lodging REITs since the start of the pandemic."
We have held on to CLDT with expectations of a turnaround and it feels like the current environment is good enough to support that management's focus on improving the financial health of the company making CLDT a much more compelling buy than it was a year ago. At this point, I would still consider CLDT a more speculative buy (this is not a sleep-well-at-night kind of investment) that has the potential to offer strong gains and has built a strong floor price over the last two years of $12/share.
The dividend was reinstated at from $.07/share per quarter. This is less than the original dividend prior to the cut of $.11/share per month. This represents a new full-year payout of $.28/share and results in a current yield of 2.24% based on the current share price of $12.45.
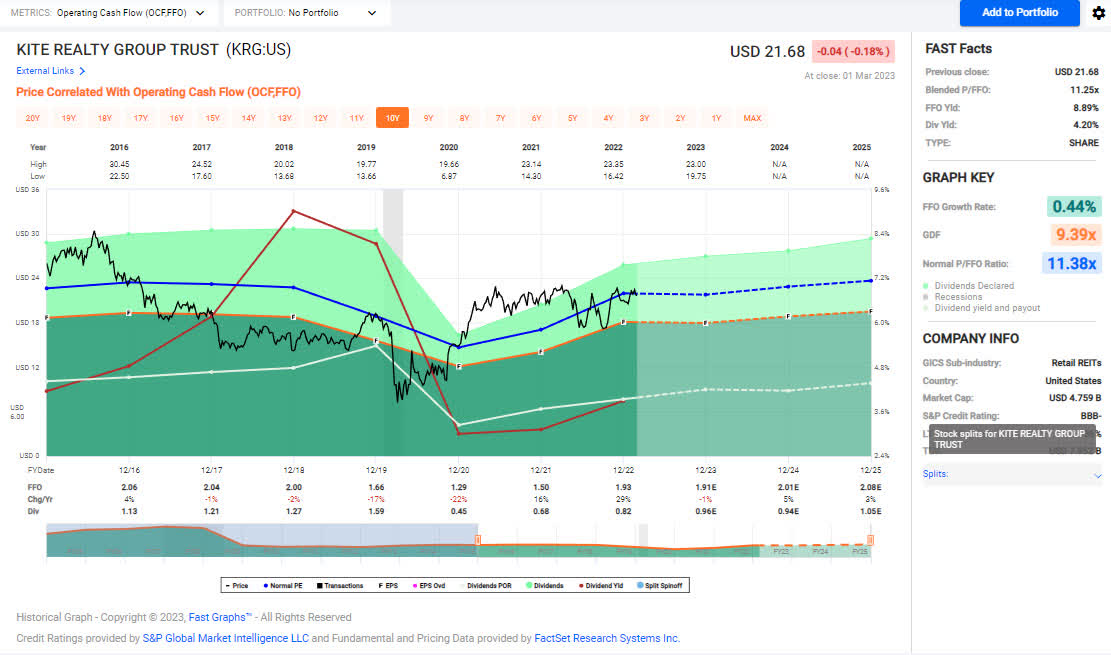
Kite Realty Group - Since cutting the dividend during the pandemic and then refocusing its real estate portfolio, KRG has covered some serious ground in just a couple of years. In fact, KRG gets my nod as one of the fastest-transforming retail REITs available. Here are the key points I am referring to when I use the word transformation:
- Lowest net debt to EBITDA - Currently at 5.2X compared to 6.8X in 2020.
- Annual Basic Rent ((ABR)) per square foot at $20.02 but all new leases in 2022 average $27 per square ft.
- 2023 FFO Guidance of $1.89 - $1.95/share.
In those 2023 projections management has already factored in concerns with Bed Bath & Beyond ( BBBY ), Party City ( OTCPK:PRTYQ ), and one lease they had with Regal Cinemas ((RGC)).
At the current dividend payout, there is still plenty of room for growth over this next year. It's tough to recommend a buy at this point because it is sitting on the upper end of its historical high but this is a situation where historical pricing doesn't tell a good story. The FastGraphs chart below shows how even though it has been stuck in a tighter share price range since 2021 the difference is that the stock is now fairly valued after a 16% jump in FFO in 2021 and a 29% jump in 2022. It's not realistic to suggest that the FFO will jump again (basically flat in 2023) but I think that the foundation set by KRG is really worth buying at the current price and adding on any pullbacks.
The dividend was increased from $.22/share per quarter to $.24/share per quarter. This represents an increase of 9.1% and a new full-year payout of $.96/share compared with the previous $.88/ share. This results in a current yield of 4.43% based on the current share price of $21.68.
Main Street Capital - The dividend was increased from $.22/share per month to $.225/share per month. This represents an increase of 2.3% and a new full-year payout of $2.70/share compared with the previous $2.64/ share. This results in a current yield of 6.35% based on the current share price of $41.92.
Realty Income - The dividend was increased from $.248/share per month to $.2485/share per month. This represents an increase of .2% and a new full-year payout of $2.982/share compared with the previous $2.976/ share. This results in a current yield of 4.78% based on the current share price of $63.52.
Bank OZK - During the pandemic, OZK resorted to dropping their quarterly increases from approximately 3% or $.01/share per quarter to as little as $.0025/share per quarter. Fortunately, OZK was able to restart its dividend growth as conditions improved because we now have over a year of quarterly dividend increases of $.01/share which means annualized growth is back to 12% and is well supported by increasing interest rates. I think it's safe to say we will see a slowdown or reduction in the Real Estate Specialties Group (RESG) portfolio based on current market conditions but even then the dividend is very well covered by earnings.
I used the five-year FastGraphs to reduce the distortion created by the pandemic (the ten-year FastGraphs would show that the company is extremely undervalued) so this makes more sense because shares are fully valued in my opinion around $50/share.
For investors more concerned/interested in income I would suggest looking at the preferred shares of OZK ( OZKAP ) as they carry a 6.35% yield and trade well under PAR. It should also be noted that SA Author Herding Value noted in his article Bank OZK : The Preferred Offers A Safe 6.45% Yield that OZKAP can be held in a Taxable Account at the qualified tax rate of 15%.
The dividend was increased from $.33/share per quarter to $.34/share per quarter. This represents an increase of 3% and a new full-year payout of $1.36/share compared with the previous $1.32/ share. This results in a current yield of 2.95% based on the current share price of $45.52.
Toronto-Dominion Bank - The dividend was increased from $.89/share CAD per quarter to $.96/share CAD per quarter. This represents an increase of 7.9% and a new full-year payout of $3.86/share CAD compared with the previous $3.58/ share CAD. This results in a current yield of 4.13% based on the current share price of $66.62.
W. P. Carey - The dividend was increased from $1.061/share per quarter to $1.065/share per quarter. This represents an increase of .4% and a new full-year payout of $4.26/share compared with the previous $4.244/ share. This results in a current yield of 5.25% based on the current share price of $80.27.
Retirement account positions
There are currently 39 different positions in John's Traditional IRA and 23 different positions in John's Roth IRA. While this may seem like a lot, it is important to remember that many of these stocks cross over in both accounts and are also held in the Taxable Portfolio.
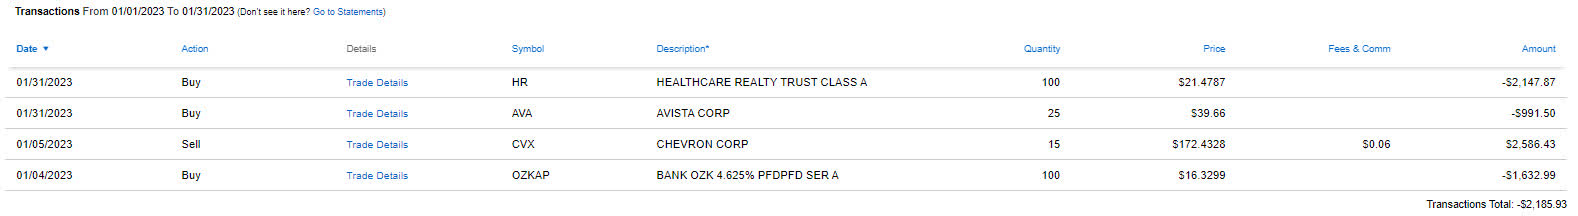
Below is a list of the trades that took place in the Traditional IRA during the month of January.
Below is a list of the trades that took place in the Roth IRA during the month of January.
I will be working on an article soon to discuss some of these trades in the next few weeks.
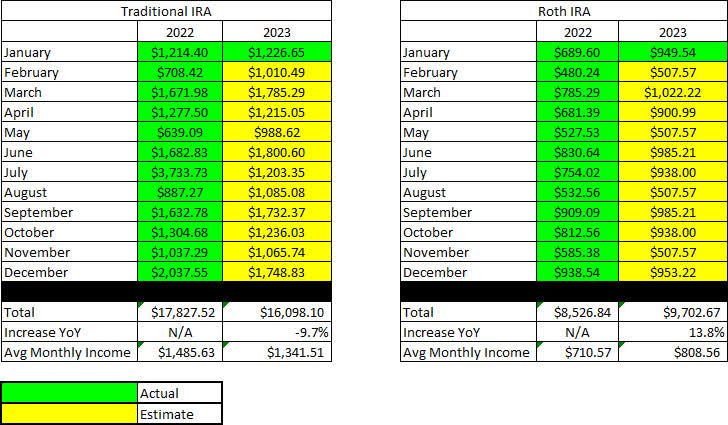
January income tracker - 2022 Vs. 2023
We are starting with a clean slate for 2023 and with all of the expected dividends (based on currently owned shares and announced dividend payments) the account is set for a large decrease in the Traditional IRA and a large increase in the dividend income generated by the Roth IRA. The reason for the large decrease in the Traditional IRA was the special dividend paid by Healthcare Trust of America (HTA) when it was acquired by Healthcare Realty ( HR ) - This can also be seen in the huge growth in 2022 dividends which came in at a whopping 35.3%. If this dividend is removed then the growth year-over-year is trending as flat overall. While it's possible we could see more special dividends in 2023 I think it's more likely that executive management will focus on deleveraging or stock buybacks in most cases.
The Traditional IRA is expected to generate an average of $1,341.51/month of dividend income in 2023 compared to the average monthly income of $1,485.63 generated in FY-2022. The Roth IRA is expected to generate an average of $808.56/month of dividend income in 2023 compared to the average monthly income of $710.57 generated in FY-2022.
Once dividend increases are factored in and the additional interest income from CDs I expect we will see a very light increase in dividend income of 3-4%. (In this assumption I am also factoring out the large special dividend from the HTA acquisition but if I leave that in then I estimate we will see an overall negative combined dividend yield growth of 1-2%.)
John plans to continue collecting $1,000/month from his Traditional IRA which matches the amount he withdrew monthly in 2022.
SNLH = Stocks No Longer Held - Dividends in this row represent the dividends collected on stocks that are no longer held in that portfolio. We still count the dividend income from stocks no longer held in the portfolio, even though it is non-recurring. All images below come from Consistent Dividend Investor, LLC. (also referred to as CDI as the source below).
The tables below represent which companies paid dividends in January and how that income source has changed since January of the previous year.
Traditional IRA - January - 2022 V 2023 Dividend Breakdown ((CDI))
Roth IRA - January - 2022 V 2023 Dividend Breakdown ((CDI))
The table below represents all income generated in 2022 and collected/expected dividends in 2023.
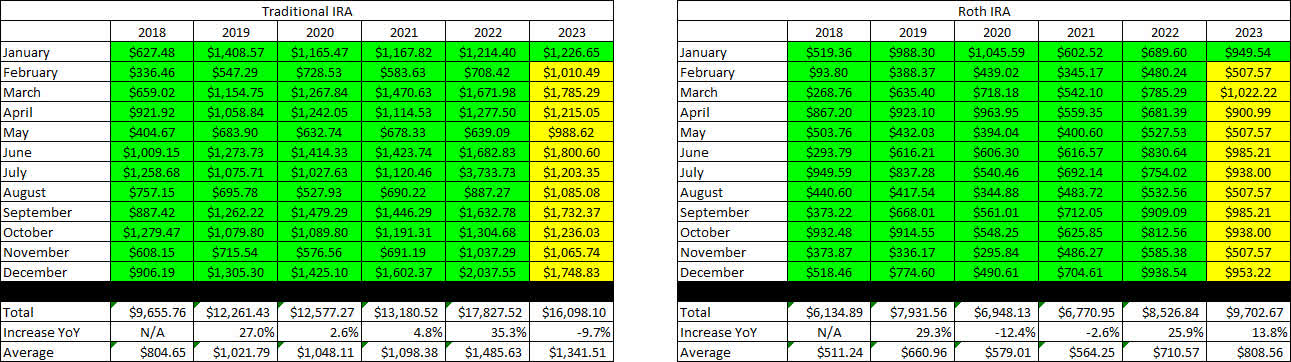
Below gives an extended look back at the dividend income generated when I first began writing these articles. I find this table to be most useful when comparing how dividend income has improved for a specific month over the course of six years.
Retirement Projections - January 2023 - Full Dividend History ((CDI))
The balances below are from January 31, 2023, and all previous month's balances are taken from the end-of-month statement provided by Charles Schwab.
Retirement Account - Month End Balances - January 2023 ((CDI))
The next image is also pulled from the end-of-month statement provided by Charles Schwab which shows the cash balance of the account.
**Please note that cash balances may fluctuate based on CD renewal dates because I only count the cash that is 100% liquid. There were larger fluctuations in 2019 and 2020 that we the result of deposits and withdrawals being made. There will be no contributions made into either account in 2023 because John is no longer working.
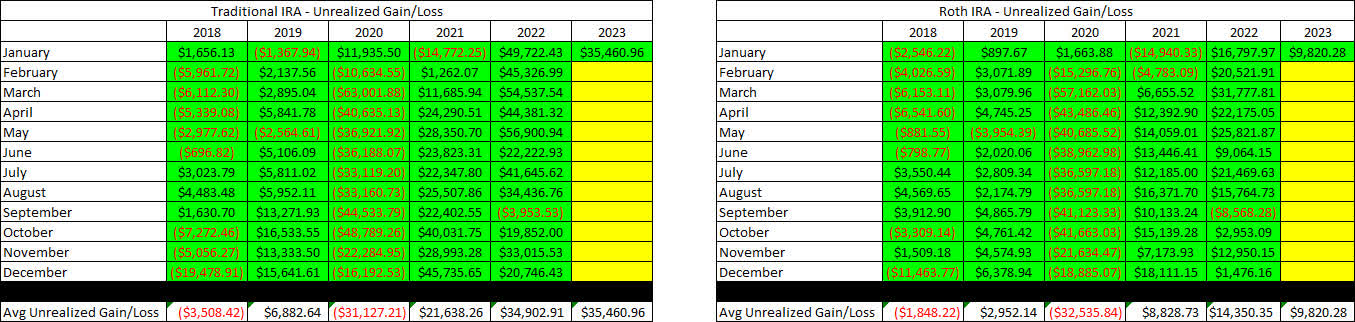
The next image provides a history of the unrealized gain/loss at the end of each month going back to the beginning of January 2018.
Retirement Accounts - January 2023 - Unrealized Gain-Loss ((CDI))
I think the table above is one of the most important for readers to understand because it paints a story of volatile markets and why we employ the strategy of generating consistent cash flows to overcome the uncertainty of the market. If we were dependent on selling shares to generate income for John and Jane's retirement they would have to be much more considerate of when they withdraw and how much they choose to withdraw.
For example, a withdrawal in 2020 where shares must be sold would destroy more value by locking in losses or poor performance by stocks being sold compared to making the same withdrawal in 2021.
In an effort to be transparent about John's Account, I like to include an unrealized Gain/Loss summary. The numbers used are based on the closing prices from March 1, 2023.
Traditional IRA - January 2023 - Gain-Loss ((CDI))
Roth IRA - January 2023 - Gain-Loss ((CDI))
It is worth noting in the table above that the yield column is most accurate at the start of the year but if I reduce the size of positions it may inflate the yield because it is based on how much dividend income is collected. At the same time, it may report excessively low dividends for positions added or significantly increased at the end of the year.
Conclusion
As mentioned above we can see that the dividend income is down on the Traditional IRA but this is attributed to the large special dividend paid out from the Healthcare Trust of America (HTA) being acquired by Healthcare Realty. Overall, John's accounts are going to be generating a level of dividend income that is reasonable to continue supporting his current payouts especially when we factor in the number of dividend increases that haven't occurred.
There is also a fair amount of trading that takes place throughout the year and while the goal is not to trade our way to profit we do use trading to solidify a position or to reduce risk. During the month of January, there were almost exclusively buying opportunities which works out well considering we have built a strong cash position in both the Traditional and Roth IRAs.
I am looking forward to the introduction of the Watchlist section that I will include in the Taxable Account article for the February review. There are a couple of notable changes that recently occurred in the account.
- Umpqua Bank (UMPQ) is now Columbia Banking System ( COLB ) after its merger with Columbia Bank.
- We recently added Intercontinental Exchange ( ICE ) to the portfolio and it will also appear in the watchlist unveiled next month.
January articles
I have provided the links to the 2022 Year-End Review Article and January 2023 Taxable Account below.
T he Retiree's Dividend Portfolio : Complete 2022 Review - Cash Flow Is King
The Retirees' Dividend Portfolio : John And Jane's January 2023 Taxable Account Update
The Retiree's Dividend Portfolio , Jane's January Update: 2023 Dividend Projections
In John's Traditional and Roth IRAs, he is currently long the following mentioned in this article: AFC Gamma ( AFCG ), Aflac ( AFL ), Apple Hospitality REIT ( APLE ), Avista ( AVA ), BP plc ( BP ), Brixmor Property Group ( BRX ), Crown Castle ( CCI ), Canadian Utilities ( OTCPK:CDUAF ), Chatham Lodging Trust ( CLDT ), Columbia Banking System ( COLB ), Chevron ( CVX ), CSX ( CSX ), Dominion Energy ( D ), Deere ( DE ), Digital Realty Preferred Series J ( DLR.PJ ), Duke Energy ( DUK ), Eaton Vance Floating-Rate Advantage Fund ( EAFAX ), EPR Properties ( EPR ), EPR Properties Preferred Series G ( EPR.PG ), Healthcare Realty ( HR ), Intercontinental Exchange ( ICE ), Iron Mountain ( IRM ), Kinder Morgan ( KMI ), Kite Realty Group ( KRG ), Lowe's ( LOW ), Main Street Capital ( MAIN ), Masco ( MAS ), Altria ( MO ), New Residential Investment Corp. Preferred Series B (NRZ.PB), Realty Income ( O ), Oshkosh ( OSK ), Occidental Petroleum Corp. ( OXY ), Bank OZK ( OZK ), Bank OZK Preferred Series A ( OZKAP ), PacWest Bancorp ( PACW ), PepsiCo ( PEP ), iShares Preferred and Income Securities ETF ( PFF ), VanEck Vectors Preferred Securities ex Financials ETF ( PFXF ), Pinnacle West ( PNW ), PIMCO Income Fund Class A ( PONAX ), Nuveen Nasdaq 100 Dynamic Overwrite Fund ( QQQX ), Global X Funds Nasdaq 100 Covered Call ETF ( QYLD ), STAG Industrial ( STAG ), Sun Communities ( SUI ), Southwest Gas ( SWX ), AT&T ( T ), Toronto-Dominion Bank ( TD ), Truist Financial ( TFC ), T. Rowe Price ( TROW ), Cohen & Steers Infrastructure Fund ( UTF ), Valero ( VLO ), Ventas ( VTR ), WestRock ( WRK ), Warner Bros. Discovery ( WBD ), and W. P. Carey ( WPC ).
For further details see:
The Retiree's Dividend Portfolio, John's January Update: 2023 Dividend Projections