NDSN - The Retirees' Dividend Portfolio: John And Jane's December Taxable Account Update
Summary
- The Taxable Account generated $2,169.46 of dividend income for December 2022 compared with $1,766.60 of dividend income for December 2021.
- The Taxable Account had a balance of $527.2K as of December 31, 2022, vs. $533.2K on December 31, 2021. The annualized cost basis yield is 5.40%.
- Seven companies in the Taxable portfolio paid increased dividends or paid a special dividend during the month of December.
- The Taxable Account had a cash balance of $46.6K as of December 31, 2022, vs. $51.6K as of December 31, 2021.
- The Taxable Account had an unrealized gain/loss of $102.5K as of December 31, 2022, vs. $114.7K as of December 31, 2021.
The end of the year has always been eventful and in many ways more volatile because there are motives that may incentivize borrowers to lock in gains and losses among the plethora of other reasons for making last-minute changes.
The first image below represents the S&P 500, Nasdaq, and DJIA performance for the month of December 2021 and the second image represents the same indexes but for December 2022. While there are no specific trends that can be easily drawn between the two graphs I think it is worth noting that the account balances for the account (even with the $12K of withdrawals made and no funds being added to the account) ended with similar levels to year-end numbers for 2021. This means that even though the month on December 2022 was terrible the account was able to maintain its value better than any of the major indexes.
Taking this a step further, let's consider where the portfolio ended for the year because that matters more than what happened on a month-to-month basis. We will get into the numbers but at first glance, I am happy to say that the portfolio clearly performed better than all three indexes which got crushed in FY-2022. The image below shows the staggering losses that negatively impacted investors' portfolios in 2022.
Taxable Performance - Account Balance
Let's dig into the numbers so we can quantify how John and Jane's Taxable Account actually performed.
- Account balance on December 31, 2021 = $533,168.77
- Account balance on December 31, 2022 = $527,171.23
We will want to first add back the $12,000 that was withdrawn from the account by the retirees and then factor in the $21,511.40 of dividends that were received in total. I am doing this to establish a baseline that demonstrates even if the market ended exactly flat we would then expect that the account value would have increased by the difference between the dividends received and the withdrawals made. In other words, even in a completely flat market, we would have expected the account balance at the end of 2022 to be $533,168.77 + ($21,511.40 - $12,000) = $542,680.17.
Now, that we have explored the hypothetical "flat performance" scenario we can look at what really happened because at best we can say that the market was down at least 10.6% (this was the performance shown by the DJIA), and for many investors, it's going to be much worse because the -10.6% was one of the better performances of all the major indexes. Assuming that the portfolio was down -10.6% we would expect that the $542,680.17 balance would get clipped by -$57,524.10 resulting in a balance of $485,156.07. So just to be clear, the $485,156.07 is what I would expect to see the portfolio end at after dividends and withdrawals if it had followed the performance of the best-performing index in 2022 which was the DJIA.
This means that the actual ending balance after dividends were received, funds were withdrawn, etc of $527,171.23 represents a portfolio that is only down -2.86% from our flat performance benchmark of $542,680.17.
So the question is, do I think the portfolio performed well given the circumstances? The answer is yes, I think the portfolio held up exceptionally well compared to the major indexes.
Now, because I can just hear the comments complaining that the indexes aren't the best measurement I included the graph below to show that three of the largest ETFs that represent those indexes demonstrated almost the exact same performance.
I've said this before and I'll say it again. None of what I write is intended to imply how much better I am at this because I don't claim to be smarter than anyone else who writes for SeekingAlpha. I am just an average person who believes in the methods I use and have generated five years of exhaustive history that shows the results have at least been an overall net positive for John and Jane.
I have a few set rules that I follow (most of which aren't considered controversial). The main aspect of my strategy is that we rotate capital and buy more shares when a company looks undervalued and sell some of the shares when it looks fully valued or overvalued. Shifting funds to less attractive sectors has been at the heart of my strategy and has made a huge impact on the portfolio by reducing the overall cost-basis of existing positions.
Background
For those who are interested in John and Jane's full background, please click the following link here for the last time I published their full story. The details below are updated for 2022.
- This is a real portfolio with actual shares being traded.
- I am not a financial advisor and merely provide guidance based on a relationship that goes back several years.
- John retired in January 2018 and now only collects Social Security income as his regular source of income.
- Jane officially retired at the beginning of 2021, and she is collecting Social Security as her only regular source of income.
- John and Jane have decided to start taking draws from the Taxable Account and John's Traditional IRA to the tune of $1,000/month each. These draws are currently covered in full by the dividends generated in each account.
- John and Jane have other investments outside of what I manage. These investments primarily consist of minimal-risk bonds and low-yield certificates.
- John and Jane have no debt and no monthly payments other than basic recurring bills such as water, power, property taxes, etc.
The reason why I started helping John and Jane with their retirement accounts is that I was infuriated by the fees they were being charged by their previous financial advisor. I do not charge John and Jane for anything that I do, and all I have asked of them is that they allow me to write about their portfolio anonymously in order to help spread knowledge and to make me a better investor in the process.
Generating a stable and growing dividend income is the primary focus of this portfolio, and capital appreciation is the least important characteristic. My primary goal was to give John and Jane as much certainty in their retirement as I possibly can because this has been a constant point of stress over the last decade.
Dividend Decreases
No companies in the Taxable account eliminated or reduced their dividend during the month of December.
Dividend Increases
Seven companies paid increased dividends/distributions or a special dividend during the month of December in the Taxable Account.
- Emerson Electric ( EMR )
- Honeywell ( HON )
- Helmerich & Payne ( HP )
- McDonald's ( MCD )
- Simon Property Group ( SPG )
- V.F. Corp ( VFC )
- Exxon Mobil ( XOM )
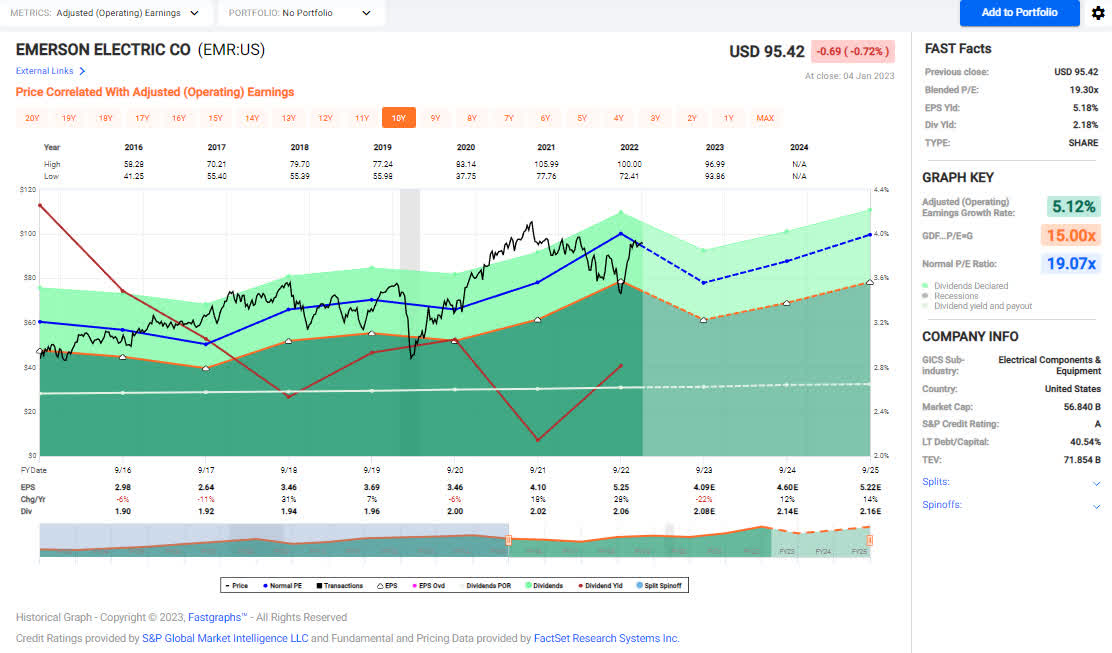
Emerson Electric - Let's address the elephant in the room by acknowledging that EMR's recent dividend increases have been rather pathetic. The average dividend increase over the last 10 years is 2.52% and the average increase over the last five years is 1.41%. This is important for dividend investors to consider because even with a great track record EMR's dividend is not growing in a way that would create an amazing income stream. What makes EMR unique is that it is a dividend king with 66 years of consecutive dividend increases in the payout ratio that is sitting at a reasonable 45%.
The reason for the limited increases is that the company has pushed all of its resources into building a sophisticated "automation pure-play" by selling off aspects of its business such as InSinkErator Garbage Disposals and buying companies that will further its push into industrial-automation services. EMR is currently using funds that would've normally gone towards dividends and stock buybacks to accelerate its future earnings potential. This is crucial because EMR is reinventing itself because the alternative would be to pay out a larger dividend but slowly die off.
UBS recently downgraded EMR from a Buy to Neutral over the slowing global economy and I agree with this analysis and would recommend that investors avoid purchasing shares near the current price. John and Jane's position was secured under $60/share in early 2020 but those interested in building a position should find the stock much more interesting when trading under $75/share.
The dividend was increased from $.515/share per quarter to $.52/share per quarter. This represents an increase of 1% and a new full-year payout of $1.08/share compared with the previous $2.06/ share. This results in a current yield of 2.16% based on the current share price of $95.42.
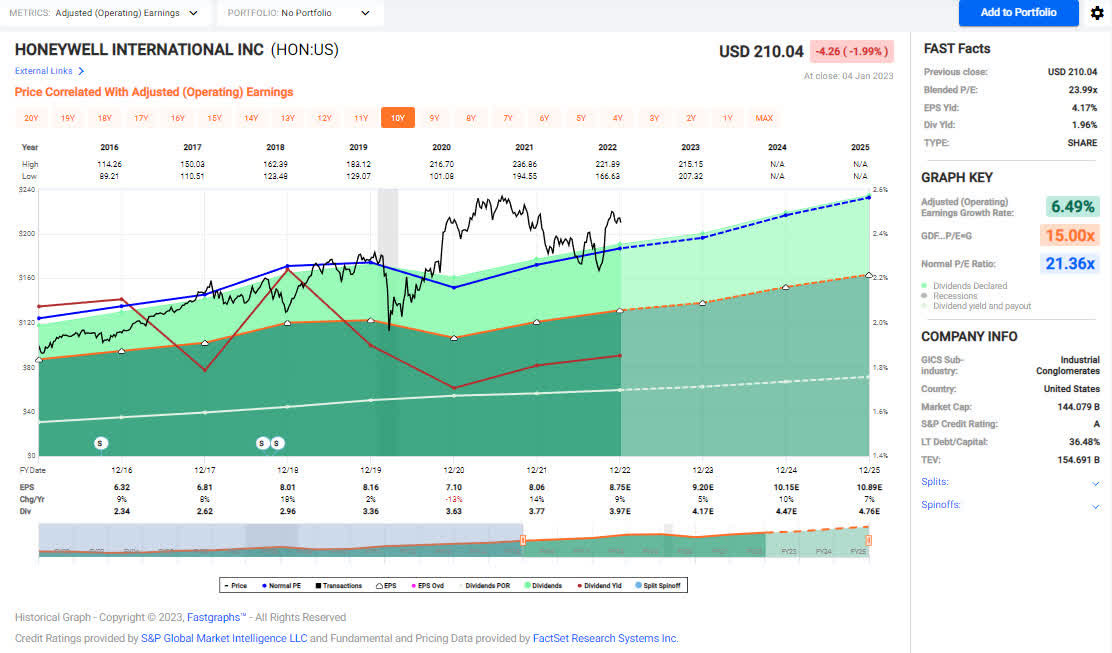
Honeywell - UBS recently downgraded HON to a sell (I typically don't rely on analysts much but I think UBS has been making very well-reasoned calls) and analyst Chris Snyder noted that their current "$29 billion backlog into the 2023 slowdown will likely protect near-term results." We aren't looking to sell any shares in the Taxable Account but may consider trimming the position slightly in Jane's Traditional IRA where the majority of HON shares are held. Even then, the downgrade price target of $193/share suggests that it's a stronger hold than the downgrade implies.
Dividend growth has slowed in recent years with a 3YR CAGR of 5.72% and a 5YR CAGR of 6.35%. This makes sense considering their payout ratio is at 47% which would be close to the higher end of what we would want to see for an industrial powerhouse like HON.
We would look at adding additional shares under $180/share and would really increase the position if the stock price fell below $170/share.
The dividend was increased from $.98/share per quarter to $1.03/share per quarter. This represents an increase of 5.1% and a new full-year payout of $4.12/share compared with the previous $3.92/ share. This results in a current yield of 1.92% based on the current share price of $210.04.
Helmerich & Payne - The last time I was talking about dividends for HP was when the dividend was cut by 65% to $.25/quarter which is where the dividend has stayed since September 2020. This is why the announcement of a supplemental dividend of $.235 per quarter is substantial and represents a return to some level of normalcy for HP. Still, the funds being used to pay the supplemental dividend represents "50% of H&P's cash flow generation in FY23 after capital expenditures and base annual dividend." Management has also stated that it may choose to "use remaining cash flow to fund additional supplemental dividends or buy back stock."
HP is currently fully valued and I would be hesitant to suggest added shares in the near term with oil prices cooling off from recent record highs.
On October 17, 2022, the Board of Directors of the Company declared a quarterly cash supplemental dividend of $0.235 per share, payable on December 1, 2022, to stockholders of record at the close of business on November 15, 2022.
McDonald's - My wife and I recently stopped at a MCD and hoped we could just walk into the lobby and avoid the obnoxiously long drive-thru line. Unfortunately, staffing continues to be a huge issue (there isn't a McDonald's sign in our area that doesn't reference open positions and "$16/hr starting wage"). So it shouldn't come as a surprise that MCD is testing a small-format location that is focused on drive-thru customers and meal pickups for delivery services. With wages in my area reaching $16/hr and busy MCD locations needing a staff of 50 employees to run 24-hour service 7 days a week, it comes as no surprise that the company would be emphasizing the use of automation and ultimately a reduction in the size of its workforce.
The most recent dividend increase was substantial but we need to keep an eye on the dividend payout ratio (even though this has remained stable at or below 60% with the exception of the 2020-2021 earnings cycle). MCD has always been shareholder friendly and the changes towards more automation and efficiency could be the next step it needs to boost profit margins and generate profit on a level we haven't seen before.
At present, I would consider the stock to be fully valued and would wait for a pullback to $240/share before adding shares or establishing a position. MCD's stock price has outperformed the S&P 500 Index and DJIA Index over the last decade.
The dividend was increased from $1.38/share per quarter to $1.52/share per quarter. This represents an increase of 10.1% and a new full-year payout of $6.08/share compared with the previous $5.52/ share. This results in a current yield of 2.30% based on the current share price of $264.39.
Simon Property Group - SPG cut its dividend during the pandemic as a precautionary measure and they have moved back towards their model of regular quarterly increases (which are least likely to continue until the dividend reaches pre-pandemic levels). SPG saw strong Q3-2022 earnings with FFO coming in well above expectations on the back of strong occupancy and increased rents. The dividend is very well covered by the most recent FY guidance of $11.83-$11.88 per share.
John and Jane have a full position in SPG at this point so we do not have plans of adding to the current position unless we see a significant pullback into the low $90/share range
The dividend was increased from $1.75/share per quarter to $1.80/share per quarter. This represents an increase of 2.9% and a new full-year payout of $7.20/share compared with the previous $7.00/ share. This results in a current yield of 5.94% based on the current share price of $117.42.
VF Corp - VFC has seen a very tough 2022 but the struggle has been apparent in their stock price all the way back to the beginning of 2020 when the pandemic resulted in major shutdowns and decimated the demand for VFC's products. In the last three years, the stock lost 70% of its value but this most recent dividend increase shows that the company is committed to maintaining its 49-year track record of consecutive dividend increases. From everything I've gathered, investors who are willing to add VFC to their portfolio need to understand that 2023 is likely to be another difficult year especially now that the company has announced an abrupt CEO transition.
VFC is the owner of several of the most well-known clothing brands in the world so if you are ok with a speculative investment in a higher quality company that is cruising on an offroad path then look no further. I believe that a reasonable position is worth the risk/reward level at the current price.
The dividend was increased from $.50/share per quarter to $.51/share per quarter. This represents an increase of 2.0% and a new full-year payout of $2.04/share compared with the previous $2.00/ share. This results in a current yield of 6.91% based on the current share price of $29.45.
Exxon Mobil - No oil company has been spared from the boom-and-bust cycle for oil production that has characterized the last decade. All things considered, XOM navigated the turbulence of this last era quite well and was even able to maintain its history of consecutive dividend increases during the pandemic. The primary concern during the pandemic came from astronomical debt levels (2019 - Early 2020 the total long-term debt basically doubled) with companies like XOM drawing all available liquidity due to concerns of how bad the impact of the pandemic would be.
I still would like to see more improvement when it comes to the current long-term debt so that XOM is in the best position possible to navigate the looming recession. XOM has also made most of its easy money from record-high gas prices that resulted in phenomenal Q2 and Q3 earnings figures. The recent dividend increase is in-line with the five-year average CAGR coming in at 3.02%.
The dividend was increased from $.88/share per quarter to $.91/share per quarter. This represents an increase of 3.4% and a new full-year payout of $3.64/share compared with the previous $3.52/ share. This results in a current yield of 3.41% based on the current share price of $109.21.
Positions
The Taxable Account currently consists of 43 unique positions (44 if you count the brokered certificate) at market close on January 3, 2022. There was only one sale that occurred during the month of December.
2022 - December Taxable Transaction History (Charles Schwab)
For additional information on why we made these trades, I will be releasing a trade summary article covering all trades for the last month from all of John and Jane's accounts.
December Income Tracker - 2021 Vs. 2022
Prior to the special dividend from Old Republic International ( ORI ) it was estimated that the income generated in the Taxable Account would be less than what was generated in 2021. Now that we have FY-2022 results we can see that The Taxable Account generated an average of $1,792.62/month of dividend income in 2022 compared to the average monthly income of $1,680.56 generated in FY-2021 (John and Jane's dividend income earned in 2022 was 6.7% ahead of 2021 performance). **Please note November 2021 income was previously reported higher than it was due to a copy-and-paste error. This has been updated for all corresponding tables and graphs.
2022 also represented the first year of major withdrawals from Taxable Account with no new funds flowing into it. The withdrawals John and Jane decided on were set at $1,000/month over all 12 months of 2022 for a total of $12,000 withdrawn. The good news is that the portfolio generates more monthly income from dividends and distributions than John and Jane are looking to withdraw.
SNLH = Stocks No Longer Held - Dividends in this row represent the dividends collected on stocks that are no longer held in that portfolio. We still count the dividend income that comes from stocks no longer held in the portfolio, even though it is non-recurring. All images below come from Consistent Dividend Investor, LLC. (also referred to as CDI as the source below).
2022 - December - Taxable Dividend Breakdown ((CDI))
Here is a graphical illustration of the dividends received on a monthly basis. I have begun updating the chart to also reflect the dividends earned going back to January of 2018.
**Because of the large special dividend payouts that have been distorting the graphs below I have decided to remove the special dividend from the total for the graphs only. The special dividends will be reflected in all other tables.
2022 - December - Taxable Monthly Dividend Graph ((CDI)) 2022 - December - Taxable Monthly Dividend Line Graph ((CDI))
The table below represents all income generated in 2021 and collected/expected dividends in 2022.
2022 - December - Taxable Annual Estimate ((CDI))
Below gives an extended look back at the dividend income generated when I first began writing these articles.
2022 - December - Taxable Dividend History ((CDI))
The Taxable Account balances below are from December 31, 2022, and all previous months are taken from the end-of-month statement provided by Charles Schwab.
2022 - December - Taxable Month End Balance ((CDI))
The next image is the only new table being added to the report for 2022. As mentioned previously, this is the first year that John and Jane will begin taking withdrawals from their Taxable Account (and also from John's Traditional IRA). For this reason, I want to keep a record of these withdrawals because they will also have an impact on the account balance in the cash balance table (after this image).
2022 - December - Taxable Cash Balance ((CDI))
**It should be noted that the cash balance is reported as of September low by $20K which was the amount that was invested into the three-month CD. Although this is an investment comparable to cash I wanted to err on the side of conservative reporting.
There were large changes in cash at the end of 2019 and then again in 2020 (this was from the purchase of a physical asset and the sale of another) which explains why the balance fluctuated so much during this time. A lot of cash was deployed in March and April of 2020 as the pandemic caused share prices to plummet. John and Jane no longer qualify to make contributions to their Traditional or Roth IRAs, so there will also not be any funds taken from the Taxable Account to cover these contributions (which is what they typically did in the past).
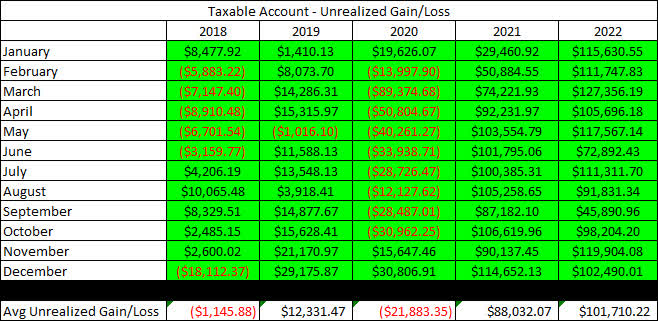
The next image provides a history of the unrealized gain/loss at the end of each month going back to the beginning in January of 2018.
2022 - December - Taxable Unrealized Gain-Loss ((CDI))
The main reason for including this is to help readers understand that the key to this strategy is to accept the risk, and I personally find that this table is an excellent representation of the volatility in the account. It is important to remember that tolerance for risk can vary significantly, but John and Jane are okay with additional risk because they are focused on generating income from these stocks.
In an effort to be transparent about John and Jane's Taxable Account, I like to include an unrealized Gain/Loss summary. The numbers used are based on the closing prices from January 3rd, 2023.
2022 - December - Taxable Gain-Loss Update ((CDI))
When reading the yield column, it is important to understand that the dividend yield is dependent on whether or not we have received a full year of income (this is the only way to keep it mostly accurate without requiring a lot of manual input or calculation on my part). I have updated these for the start of the year, so all yields reflected in the last column are accurate. I actually prefer this method because it will show the reduced yield of a position added partway through the year (thus reflecting an accurate benefit vs. an inflated benefit).
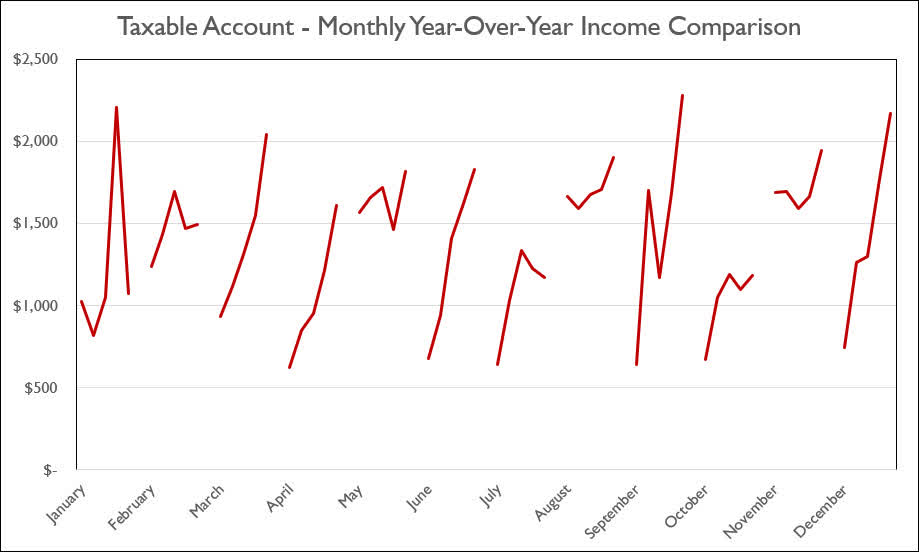
Lastly, I wanted to include the Monthly Year-Over-Year Income Comparison to show how the Taxable Account is trending.
2022 - December - Taxable Monthly Year-Over-Year Comparison ((CDI))
Conclusion
I'll be writing up an article that compiles all of the income earned from the Taxable and Retirement Accounts for John and Jane but I can say I am pretty happy with the performance of the portfolio having churned out more dividends than it did in 2021 and maintaining value better than the S&P 500, DJIA, and Nasdaq Composite.
In John and Jane's Taxable Account, they are currently long the following mentioned in this article: Apple (NASDAQ: AAPL ), Arbor Realty (NYSE: ABR ), Archer-Daniels-Midland (NYSE: ADM ), Air Products and Chemicals ( APD ), Carrier Global Corporation (NYSE: CARR ), Clorox (NYSE: CLX ), Cummins (NYSE: CMI ), Dover Corporation (NYSE: DOV ), Eaton Vance Floating-Rate Advantage Fund A (MUTF: EAFAX ), Emerson Electric ( EMR ), Enterprise Products Partners (NYSE: EPD ), EPR Properties (NYSE: EPR ), Equinix (NASDAQ: EQIX ), Energy Transfer (NYSE: ET ), Eaton Vance Tax-Advantaged Dividend Income Fund (NYSE: EVT ), General Mills (NYSE: GIS ), Honeywell (NASDAQ: HON ), Helmerich & Payne (NYSE: HP ), Hormel (NYSE: HRL ), Iron Mountain (NYSE: IRM ), McDonald's ( MCD ), Altria (NYSE: MO ), Nordson ( NDSN ), Realty Income ( O ), Old Republic International ( ORI ), Otis Worldwide Corporation (NYSE: OTIS ), Parker-Hannifin (NYSE: PH ), Ryder System (NYSE: R ), Rio Tinto ( RIO ), Rithm Capital ( RITM ), RPM International ( RPM ), Raytheon Technologies (NYSE: RTX ), Schlumberger (NYSE: SLB ), Southern Company (NYSE: SO ), Simon Property Group ( SPG ), AT&T (NYSE: T ), Texas Instruments (NASDAQ: TXN ), V.F. Corporation ( VFC ), Verizon (NYSE: VZ ), Washington Trust (NASDAQ: WASH ), Westlake Chemical (NYSE: WLKP ), W. P. Carey (NYSE: WPC ), and Exxon Mobil ( XOM ).
For further details see:
The Retirees' Dividend Portfolio: John And Jane's December Taxable Account Update