QVML - The S&P 500 Continues Upward Trajectory As Expected
2023-07-24 21:30:00 ET
Summary
- The main factors lifting the market during the week were positive bank earnings reports and additional data indicating tamer-than-previously expected inflation.
- Investors however remain focused on 2023-Q4 after having set their forward-looking attention on that quarter in the previous week.
- The CME Group's FedWatch Tool continues to project the Federal Reserve will hike the Federal Funds Rate by just a quarter point to a target range of 5.25-5.50% after it meets next week on 26 July (2023-Q3).
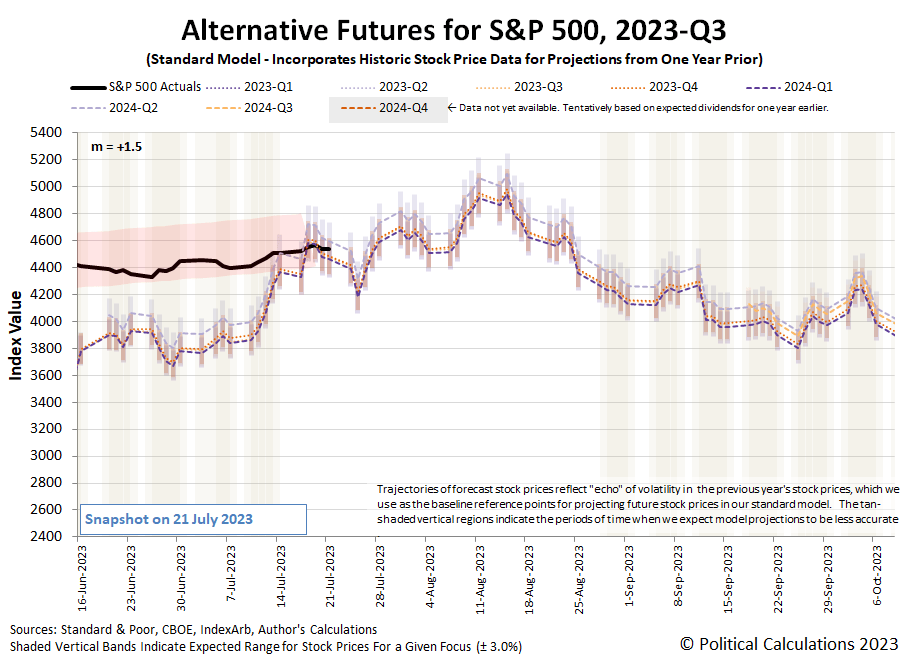
The S&P 500 (Index:[[SPX]]) continued its upward trajectory in trading week ending 21 July 2023. The index closed the week at 4536.34 with a week-over-week gain of 0.7%.
The main factors lifting the market during the week were positive bank earnings reports and additional data indicating tamer-than-previously expected inflation. Of these, the positive news for banks, particularly regional banks that reports earnings during the week, boosted the market because it indicates the negative factors that sunk Silicon Valley Bank, Signature Bank, and First Republic Bank earlier in the year are now relatively contained.
The news pointing to tamer-than-expected inflation was also positive, because it reduced the probability of another rate hike beyond the quarter-point increase in the Federal Funds Rate expected to be announced at the end of the Fed's two-day meeting next week on Wednesday, 26 July 2023. In the previous edition of the S&P 500 chaos series, investors were giving a greater-than-50% probability of one more rate hike that would take place during 2023-Q4, which now appears off the table.
Investors however remain focused on 2023-Q4 after having set their forward-looking attention on that quarter in the previous week. The following update to the dividend futures-based model 's alternative futures chart shows the level of the S&P 500 at the end of the third week of July 2023 is consistent with that forward time horizon.
The chart also shows we've fully exited the period of the redzone forecast range we first added to the chart in early April 2023. Longtime readers know we add these ranges to the alternative futures chart when we recognize the past volatility of stock prices, which the dividend futures model uses as the base reference points for projecting the future for the S&P 500 index, will affect the accuracy of its projections for a sustained period of time by more than a few percent.
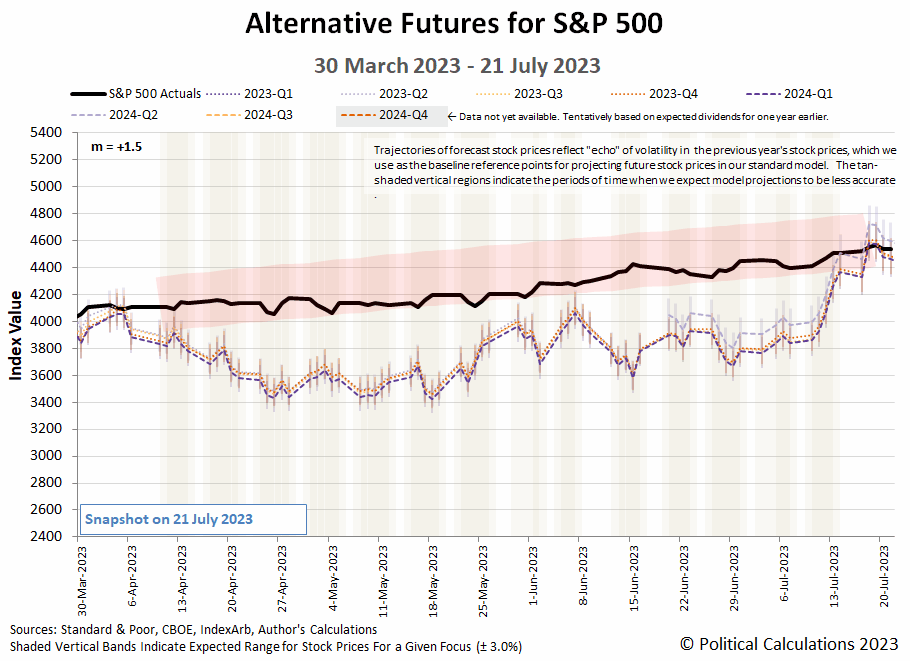
Because this latest redzone forecast range spans such a long period of time and breaks across regular calendar quarters, we thought it might be interesting to show it all in one chart. The following chart covers the period from 30 March 2023, or shortly before the last redzone forecast range was first added to the alternative futures chart, through 21 July 2023, which extends several days past the end of the added forecast range. We've also animated the chart to show how the forecast range changed between the snapshot dates of 6 April 2023 and 21 July 2023.
Perhaps the most remarkable thing illustrated by the chart is how little the projected future level of the forecast range changed from the "before" to the "after" snapshot. Stock prices largely behaved as expected, within the range expected, over the 15 weeks covered by the redzone forecast range.
Let's wrap up both these charts with our summary of the past week's market-moving headlines:
Monday, 17 July 2023
- Signs and portents for the U.S. economy:
- Bigger trouble, stimulus developing in China:
- Bigger trouble developing in the Eurozone:
- S&P, Dow kick off busy earnings week with small gains, Nasdaq rises nearly 1%
Tuesday, 18 July 2023
- Signs and portents for the U.S. economy:
- Bigger stimulus developing in China:
- BOJ officials say they'll keep never-ending stimulus alive:
- Other central bank officials changing direction:
- ECB officials thinking about looking at inflation data in the future:
- Bank results lift stocks; Dow up for seventh straight session
Wednesday, 19 July 2023
- Signs and portents for the U.S. economy:
- Economists see July 2023 end to Fed officials' rate hikes:
- Bigger trouble, stimulus developing in China:
- Changing inflation winds for central banks:
- Nasdaq, S&P, Dow end higher as earnings season heats up; eyes on Tesla, Netflix results
Thursday, 20 July 2023
- Signs and portents for the U.S. economy:
- Fed officials get into instant payments game:
- Bigger trouble developing in China:
- JapanGov officials say BOJ officials can expect to see more inflation, slow economy:
- Economists expect ECB officials to deliver at least two more rate hikes:
- Tesla, Netflix pull Nasdaq and S&P lower, Dow ends higher
Friday, 21 July 2023
- Signs and portents for the U.S. economy:
- Bigger stimulus developing in China:
- BOJ officials get mixed message on whether to tweak never-ending stimulus:
- ECB officials expected to deliver quarter point rate hike next week:
- S&P, Dow post solid weekly gains while Nasdaq retreats as tech takes a break
The CME Group's FedWatch Tool continues to project the Federal Reserve will hike the Federal Funds Rate by just a quarter point to a target range of 5.25-5.50% after it meets next week on 26 July (2023-Q3). Looking beyond that, the FedWatch Tool now says that's the peak for the Fed's series of rate hikes that began back in March 2022, where rates will hold at that level through January 2024. The tool then anticipates the Fed will swing into reverse and start cutting rates by a quarter point at six- to twelve-week intervals during 2024.
The Atlanta Fed's GDPNow tool estimate of the real GDP growth rate for current quarter of 2023-Q2 ticked up to +2.4% from the +2.3% growth rate projected a week earlier.
Editor's Note: The summary bullets for this article were chosen by Seeking Alpha editors.
For further details see:
The S&P 500 Continues Upward Trajectory As Expected