QVML - The S&P 500 May Be Near The Most Dangerous Phase Of The Bear Market
- The bear market of 2022 has eerily similar characteristics of bear markets of the past.
- The 2022 bear market looks very similar to those in 1937, 2000, and 2008.
- If the bear markets are similar, the 2022 version is nearing its most dangerous phase.
History can act as a guide, not because it can predict the future, but because sometimes it can prepare us for what may happen next. Investing is very much about understanding the fundamentals and the technical trends. But the element that is lost most times is emotion, and it is the emotion of how people respond to news or events that seem to endure, shaping history.
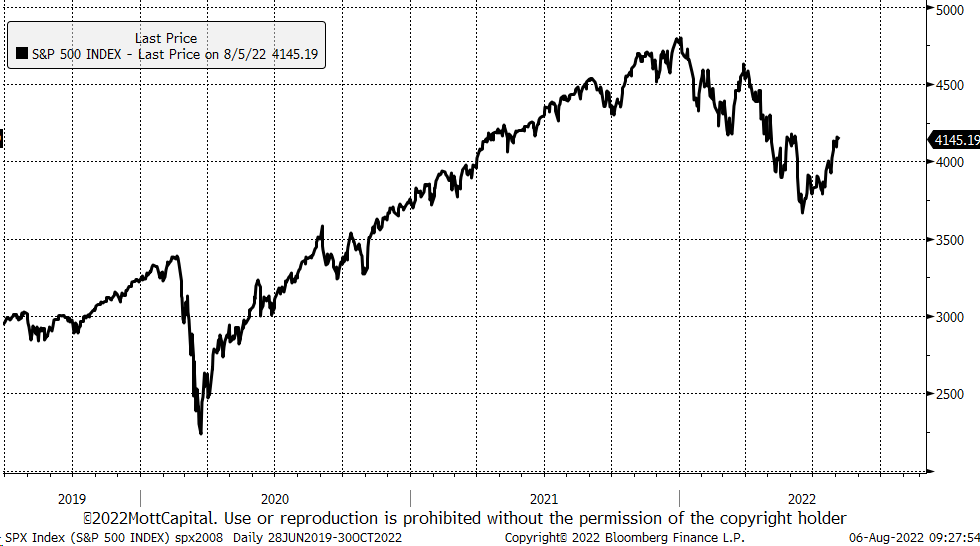
Similarities in today's stock market and S&P 500 ( SP500 ) echo the great bear markets of the past. The 2022 S&P 500 path has followed the paths of 1936, 2000, and 2008 cycles. It isn't to say that future is on a predetermined course; it is not. But it can give us a glimpse into what may happen next based on how bear markets and emotions have steered past performance.
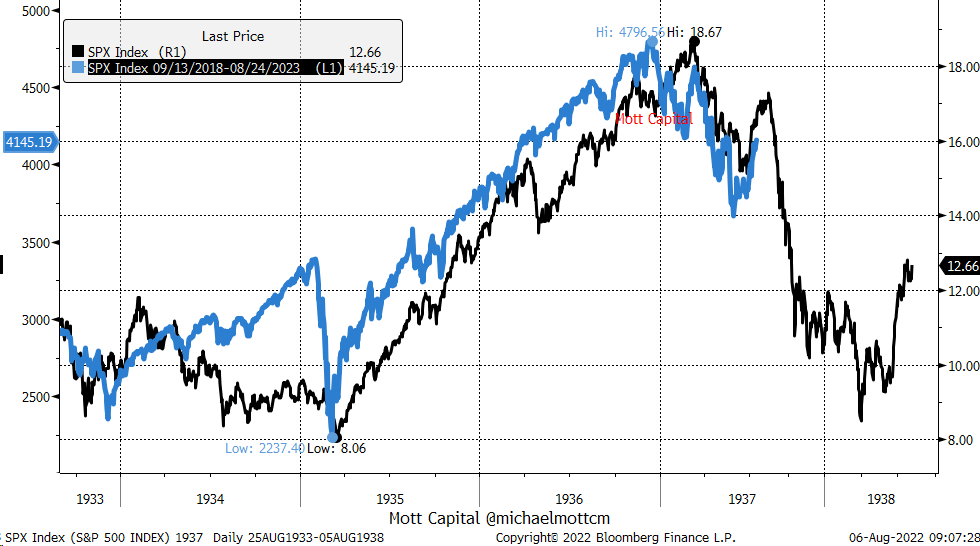
1937
After rallying from March 1935 to March 1937, the S&P 500 dropped sharply until the summer of 1937, by nearly 19%. That was when the index saw a solid summer rally, which lifted the S&P 500 more than 14% off its lows, peaking around August 20, 1937. Following that summer rally, the market fell sharply, nearly 70% between September 1937 and April 1938.
Using a 31,065-day offset to overlay the S&P 500 of today versus that bear market, we can see the S&P 500 of today has plotted a very similar course to that of 1937. It would suggest that the S&P 500 of today is likely to be hitting an inflection point in the next couple of weeks. It could result in the recent 2022 rally continuing, the comparison with 1937 no longer working, or the S&P 500 of 2022 turning sharply lower as the market did in 1937.
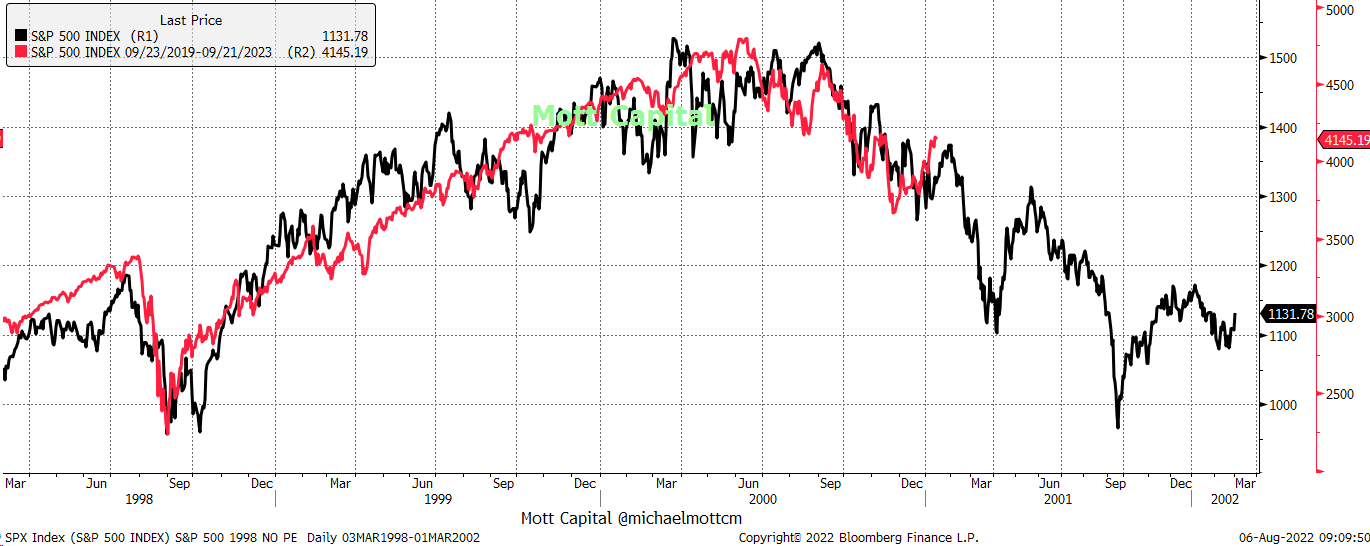
2000
The bear market that started in the year 2000 also shares many of the same properties as the S&P 500 of today. In this case, using a 7874-day offset, the two charts will line up. Following the 1998 sell-off, the S&P 500 rallied sharply until 2000. The S&P 500 of 2000 was more resilient at first, retesting its March 2000 highs again in September 2000. After that, the index saw a pronounced sell-off, followed by a January 2001 rally. That January 2001 rally marked the final rebound, followed by a nearly 20% decline into April 2001.
Again, the market of today is at the same point in time. Therefore, if the S&P 500 is going to turn lower and follow the path of 2000, that sharp decline could happen over the next couple of weeks.
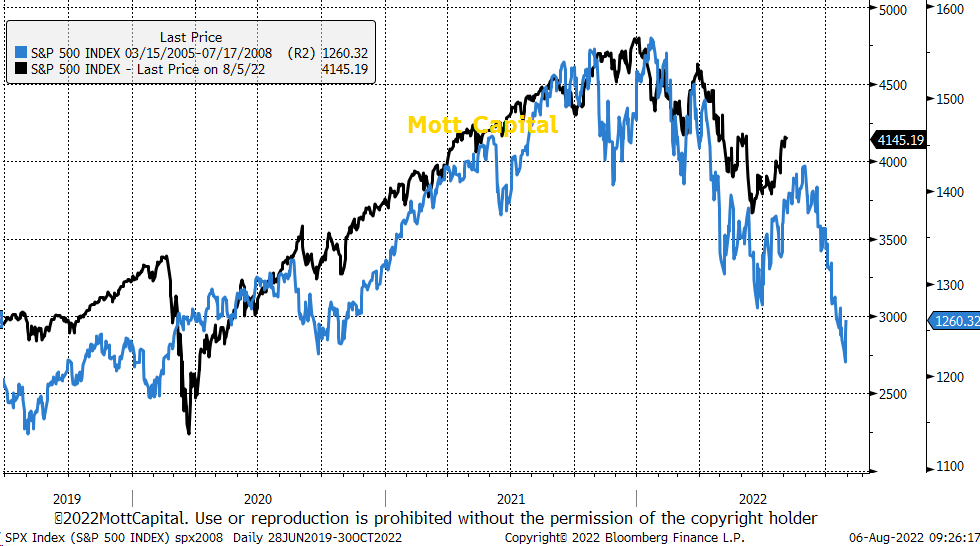
2008
Finally, the bear market of 2008 seems to match the S&P 500 of 2022 the most closely. A 5,218-day offset lines the double bottom in the fall of 2020 up with the double bottom in the spring of 2006. Like the two previous bear market examples, after peaking in October 2007, the S&P 500 went lower on a slow and steady decline of nearly 19%. That was followed by a rally in the spring of 2008, which led to a gain of almost 12%. Of course, after that rally, the S&P 500 again found itself turning lower, erasing the spring gains.
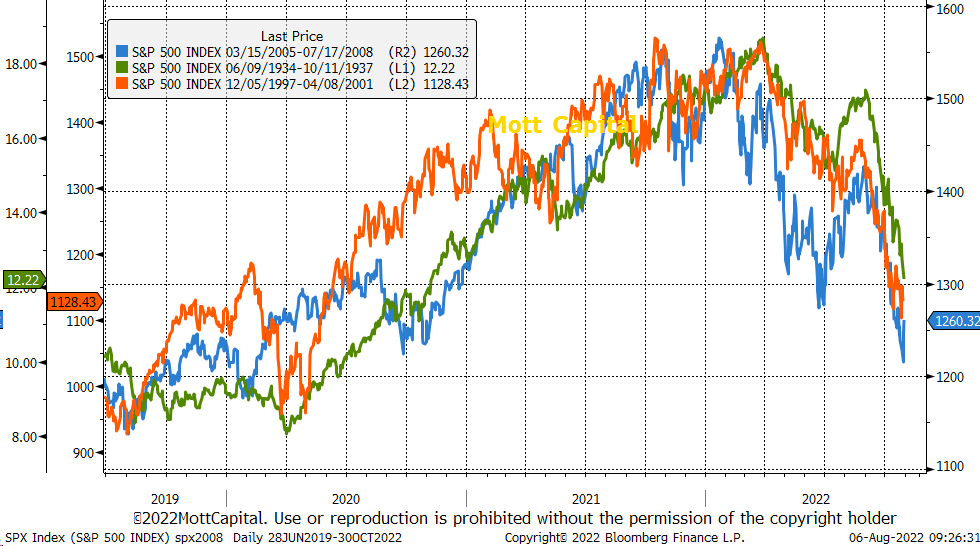
Similarities
The declines may differ in each of these cases, but it isn't the reason that matters. It is the patterns the market followed that matter. When overlaying 1937, 2000, and 2008 all together on one chart, they show that the bull rally phases had nearly the same duration, with all peaking within a 6-month time frame, followed by a sharp decline, a very sharp countertrend rally followed by a significantly steeper decline.
Does this mean the market of 2022 has to follow the same path? No, of course, it does not. But if this is a bear market we are in, and the pattern continues, the market may be entering the most dangerous part of the bear market. The part where a powerful rally catches everyone off guard and is followed by a sharp and sudden decline.
What happens next for stocks is anyone's guess, and these charts do not tell us what that outcome will be. But the power of history and human emotion tells us what may happen next, and in this case, the answer may be staring us right in the face for all to see.
For further details see:
The S&P 500 May Be Near The Most Dangerous Phase Of The Bear Market