QVML - The S&P 500 Rises With Signs Bank Contagion Seems Contained
2023-03-28 03:45:00 ET
Summary
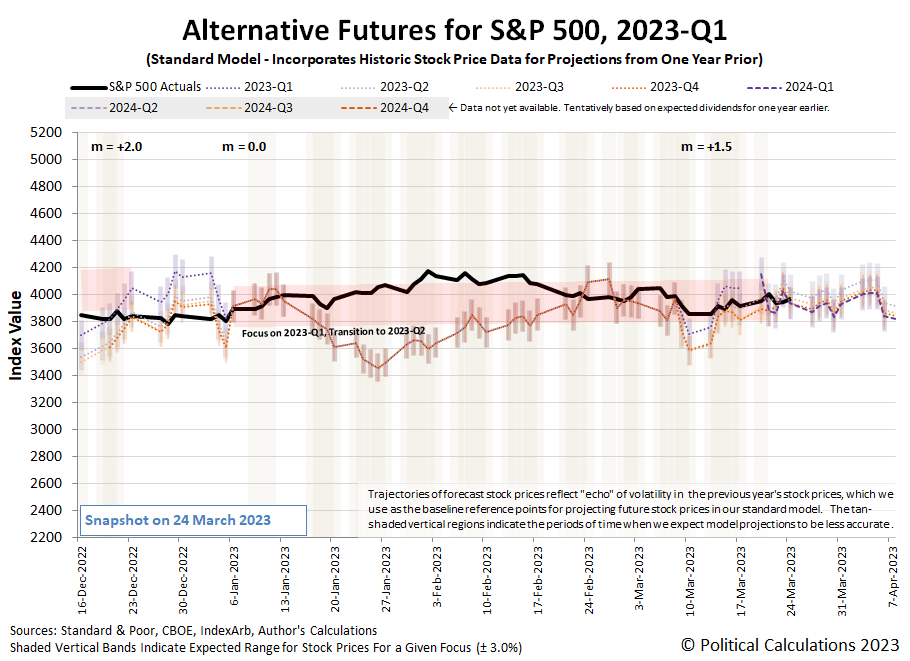
- The S&P 500 climbed 1.4% from the previous week's close to wrap up the trading week ending Friday, 24 March 2023 at 3970.99.
- During the week, dividend futures rebounded from the previous week's low for the quarter.
- With the increased focus on how the Fed will adapt its monetary policies during 2023-Q2, the Fed's rate hike provides a valuable calibration point we can use to quantify the shift in the value of dividend futures-based model's multiplier.
The S&P 500 ( SPX ) climbed 1.4% from the previous week's close to wrap up the trading week ending Friday, 24 March 2023 at 3970.99 .
During the week, dividend futures rebounded from the previous week's low for the quarter . However, the bigger story is that expectations took hold the Federal Reserve is done with rate hikes after hiking them by a quarter-point on Wednesday, 22 March 2023, and will be swinging to cut rates instead in the weeks ahead.
The latest update to the alternative futures chart shows the S&P 500's trajectory continued persistently tracking below the redzone forecast range we established almost three months ago, which has now reached its end.
With the increased focus on how the Fed will adapt its monetary policies during 2023-Q2, the Fed's rate hike provides a valuable calibration point we can use to quantify the shift in the value of dividend futures-based model 's multiplier. The model requires the multiplier's value be set according to empirical observations, where a first pass suggests it has shifted from 0.0 to +1.5 as a result of the interest rate hike-induced distress in the U.S. banking system. That new shift follows the multiplier having recently shifted from +2.0 to +0.0 in early January 2022.
The next chart sets up the new hypothesis test utilizing a multiplier of about +1.5 starting from 9 March 2023, coinciding with the development of the then-impending failure of Silicon Valley Bank ( SIVB ).
With this shift in multiplier, we see the redzone forecast range adjust accordingly as if we have made the assumption the multiplier, m , would shift from +0.0 to +1.5 on 9 March 2023 from the very beginning. This visual adjustment is an artifact of how we set up redzone forecast ranges, where we anchor one point in the past and the other in the future to allow them to dynamically adapt along with changes in future expectations.
Going forward, we're starting with the assumption that m = +1.5 and that investors are focusing on 2023-Q2 in setting their forward-looking focus. Ideally, we should see the trajectory of the S&P 500 tracking along within a few percent of the alternative future projection associated with 2023-Q2. In reality, we anticipate a higher level of volatility driven by the onset of new information.
Speaking of which, here are the past trading week's market-moving headlines:
Monday, 20 March 2023
- Signs and portents for the U.S. economy:
- Investors uncertain of Fed minions' next steps following bank failures, bailouts:
- Failing bank Credit Suisse bought by UBS in forced sale:
- BOJ minions claim Japan's banks are stable, worry about side effects of never-ending stimulus:
- Bigger trouble as Chinese, global economy not growing as quickly as expected:
- Bigger trouble developing in the Eurozone:
- ECB minions looking to exploit bank system crisis to achieve inflation target, claim risk of Eurozone bank failures is small:
- Wall St ends higher as bank contagion fears ease, Fed eyed
Tuesday, 21 March 2023
- Signs and portents for the U.S. economy:
- ECB minions having second thoughts about more rate hikes:
- Wall Street ends green on bank bounce as Fed takes focus
Wednesday, 22 March 2023
- Signs and portents for the U.S. economy:
- Investors on edge before the Fed minions' meeting:
- Fed minions deliver quarter-point rate hike, hint at pause in rate hikes to focus on failing banks:
- Yellen, caught between financial markets and US Congress, pleases neither
- Yellen Pulls Rug Out From Powell's Dovish Promises: Gold Gains As Banks Bust
- "We Are Headed For Another Train Wreck": Bill Ackman Blames Janet Yellen For Restarting The Bank Run
- Yellen says US banks shoring up liquidity to guard against runs
- Explainer-How safe is my money in a U.S. bank and what is insured?
- Bigger stimulus developing in China:
- Mixed economic signals in Japan:
- ECB minions thinking about their carbon footprint while German officials worry about inflation picking up if bank failures stop ECB from focusing on fighting inflation:
- Wall St ends sharply lower as Powell warns inflation fight continues
Thursday, 23 March 2023
- Signs and portents for the U.S. economy:
- Biden administration Treasury Secretary forced to backtrack:
- Fed minions seen on verge of policy change for setting interest rates:
- More central bank minions putting rate hikes on hold, addressing potential for bank failures:
- Other central bank minions continue rate hike mania:
- Hong Kong central bank raises policy rate after Fed hike
- Philippines central bank stays in inflation-fighting mode, hikes rates by 25 bps
- Taiwan central bank unexpectedly raises rates on inflation concerns
- Bank of England raises interest rates again, sees inflation falling
- Swiss National Bank raises rates, says Credit Suisse takeover prevented larger crisis
- ECB minions still singing from rate hike hymnal:
- Wall St ends higher as Yellen vows actions to safeguard deposits
Friday, 24 March 2023
- Signs and portents for the U.S. economy:
- Fed minions try putting on brave face despite bank crisis, credit crunch, risks to commercial real estate market:
- Bigger trouble developing in Japan:
- Bigger trouble developing in Asia, all over:
- ECB minions committing to rate hikes despite banking sector turmoil, say no problems with Eurozone banks:
- Wall Street ends volatile week higher as Fed officials ease bank fears
After the Federal Reserve's quarter-point rate hike on 22 March 2023, the CME Group's FedWatch Tool now anticipates the Fed has finished the series of rate hikes it began a year earlier. From the current Federal Funds Rate target range of 4.75-5.00%, the FedWatch tool predicts the Fed will be forced to initiate a series of quarter-point rate cuts at six weeks intervals starting after the FOMC meets on 26 July (2023-Q3) and continuing through December (2023-Q4). In 2024, the FedWatch tool projects at least one quarter-point rate cut per quarter through September (2024-Q3), when the Federal Funds Rate target range will have fallen to 2.75-3.00%.
The Atlanta Fed's GDPNow tool 's projection for real GDP growth in the first quarter of 2023 held steady at +3.2%. With the first calendar quarter of 2023 nearly over, the GDPNow indicator continues transitioning to look backward instead of forward. The Bureau of Economic Analysis' initial estimate of GDP in 2023-Q1 is scheduled to be released on 27 April 2023.
Editor's Note: The summary bullets for this article were chosen by Seeking Alpha editors.
For further details see:
The S&P 500 Rises With Signs Bank Contagion Seems Contained