PAMC - The Selloff In Stocks Is The Fed's Fault
2023-10-02 22:45:00 ET
Summary
- The high in 10-year Treasury yields last week was 4.688% on no significant bad news for bonds.
- In the end, this selloff in both bonds and stocks could very well be attributed to the Federal Reserve as one of the major drivers.
- The present pace of $95 billion in quantitative tightening is the highest in history.
There is enough doom and gloom out there, plus oversold conditions in the stock market, to launch an end-of-year rally, although the lack of strength in the rebound we saw last Wednesday and Thursday – and the way investors sold into the positive open on Friday (the last day of the quarter) on good inflation news – makes me wonder if we won’t come back and retest last week’s low (or undercut it) to tag my target of the 200-day moving average on the S&P 500 in early October.
The 200 DMA is now at 4,199 and rising. The low last week was 4,238, just 1% away. We won’t know for sure if this happens until after the fact.
When I wrote “ Wild Cards for September ,” I singled out the Treasury market as a big risk to equities, and as bond markets often do, the rise in rates surpassed my wildest expectations. The reason is not the Japanese central bank, but everybody else, including the Fed with its quantitative tightening.
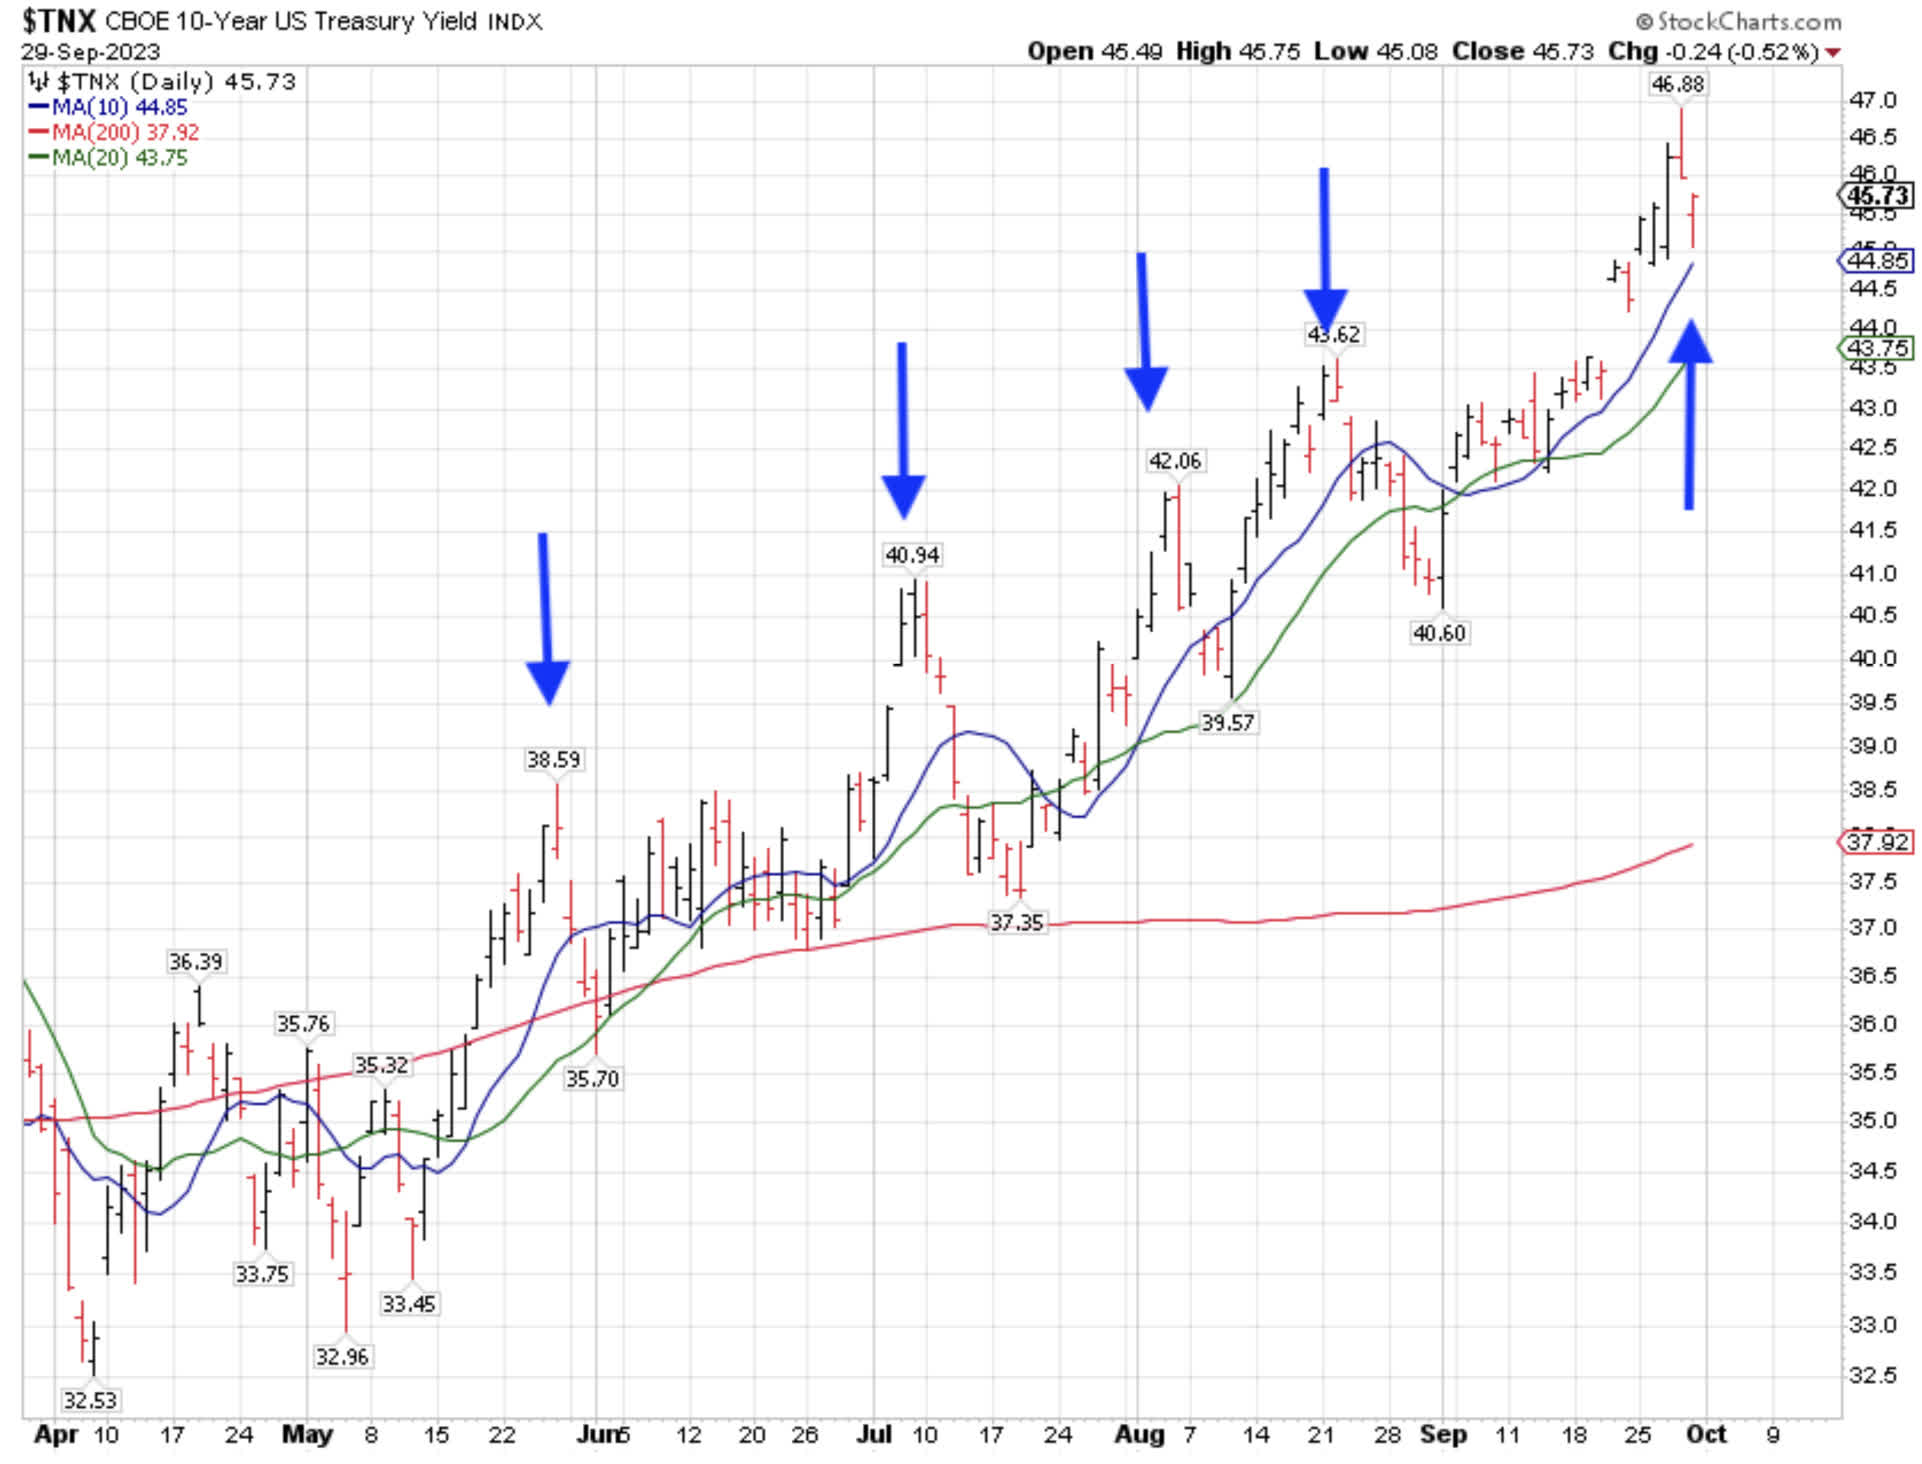
The high in 10-year Treasury yields last week was 4.688% on no significant bad news for bonds. We saw a surge of 17 basis points in a little over 24 hours, equivalent to a Dow Industrials 800-point selloff.
Graphs are for illustrative and discussion purposes only. Please read important disclosures at the end of this commentary.
That said, the Treasury market appears to have reached one of its famous selling climaxes (i.e., surges in yield), after which it tends to revert back to the mean by 25-35 basis points, against the major uptrend.
That should be a positive for equities. In May, yields fell 31 bps, 3.86% to 3.57%; in July, they reverted 35 bps 4.09% to 3.74% and again by 25 bps, 4.21% to 3.96%.
In August, the yield reversion was 30 bps, 4.36% to 4.06%, and now we have 4.688% as the peak climactic surge in the 10-year Treasury yield.
Graphs are for illustrative and discussion purposes only. Please read important disclosures at the end of this commentary.
In the end, this selloff in both bonds and stocks could very well be attributed to the Federal Reserve as one of the major drivers. I remember December 2018 very well.
That’s when the Fed over-tightened in a good economy, and the S&P 500 fell 19%. The stock market does not do that in the absence of bad news unless the biggest player in U.S. financial markets – the Federal Reserve – goes to an extreme.
Is the Federal Reserve in danger of going to another extreme now?
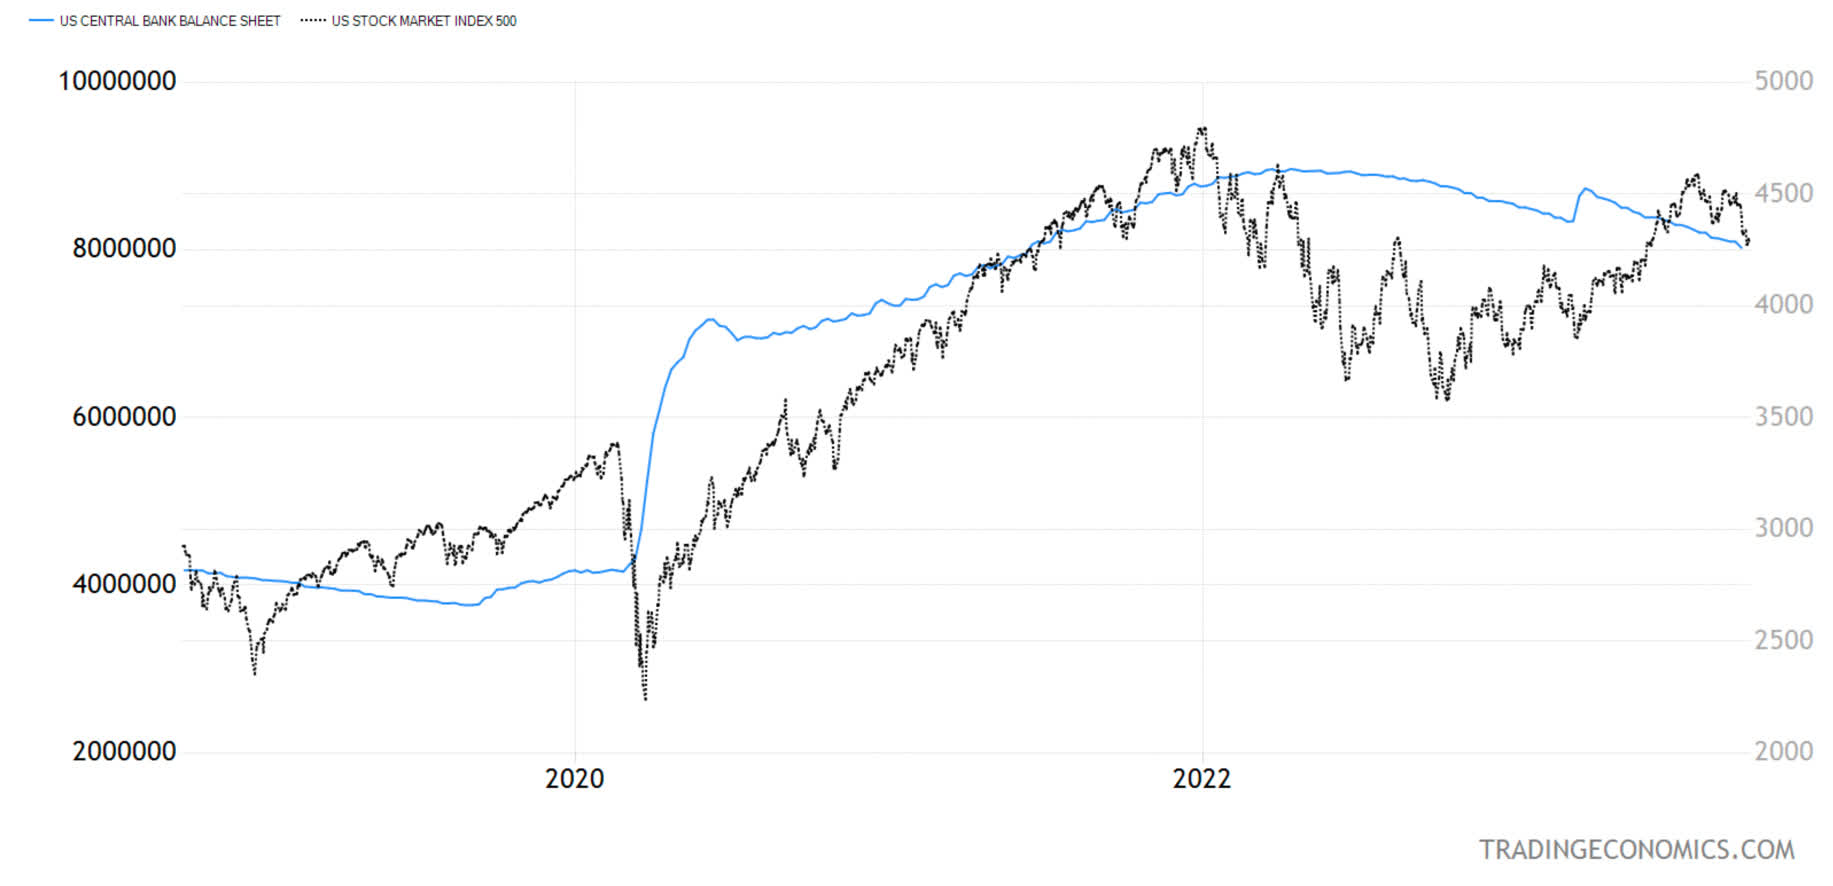
The present pace of $95 billion in quantitative tightening is the highest in history. The only more extreme rate of Fed intervention was the “auto-pilot” QE rate of $120 billion per month that the Fed launched right after the COVID climactic bottom in stocks in March 2020.
Fueling $120 billion a month in QE caused the stock market to recover while EPS for the S&P 500 shrank. Switching to QT and Fed fund rate hikes caused the S&P 500 Index to go down in 2022, while EPS for the Index did not have a dramatic decline.
Sorry to say, the Fed can override the stock market with their open market operations. The level of excess reserves in the system is dropping, at the moment. It is impossible to state definitively that this is the main driver behind the surge in bond yields, but I believe it is one of the drivers.
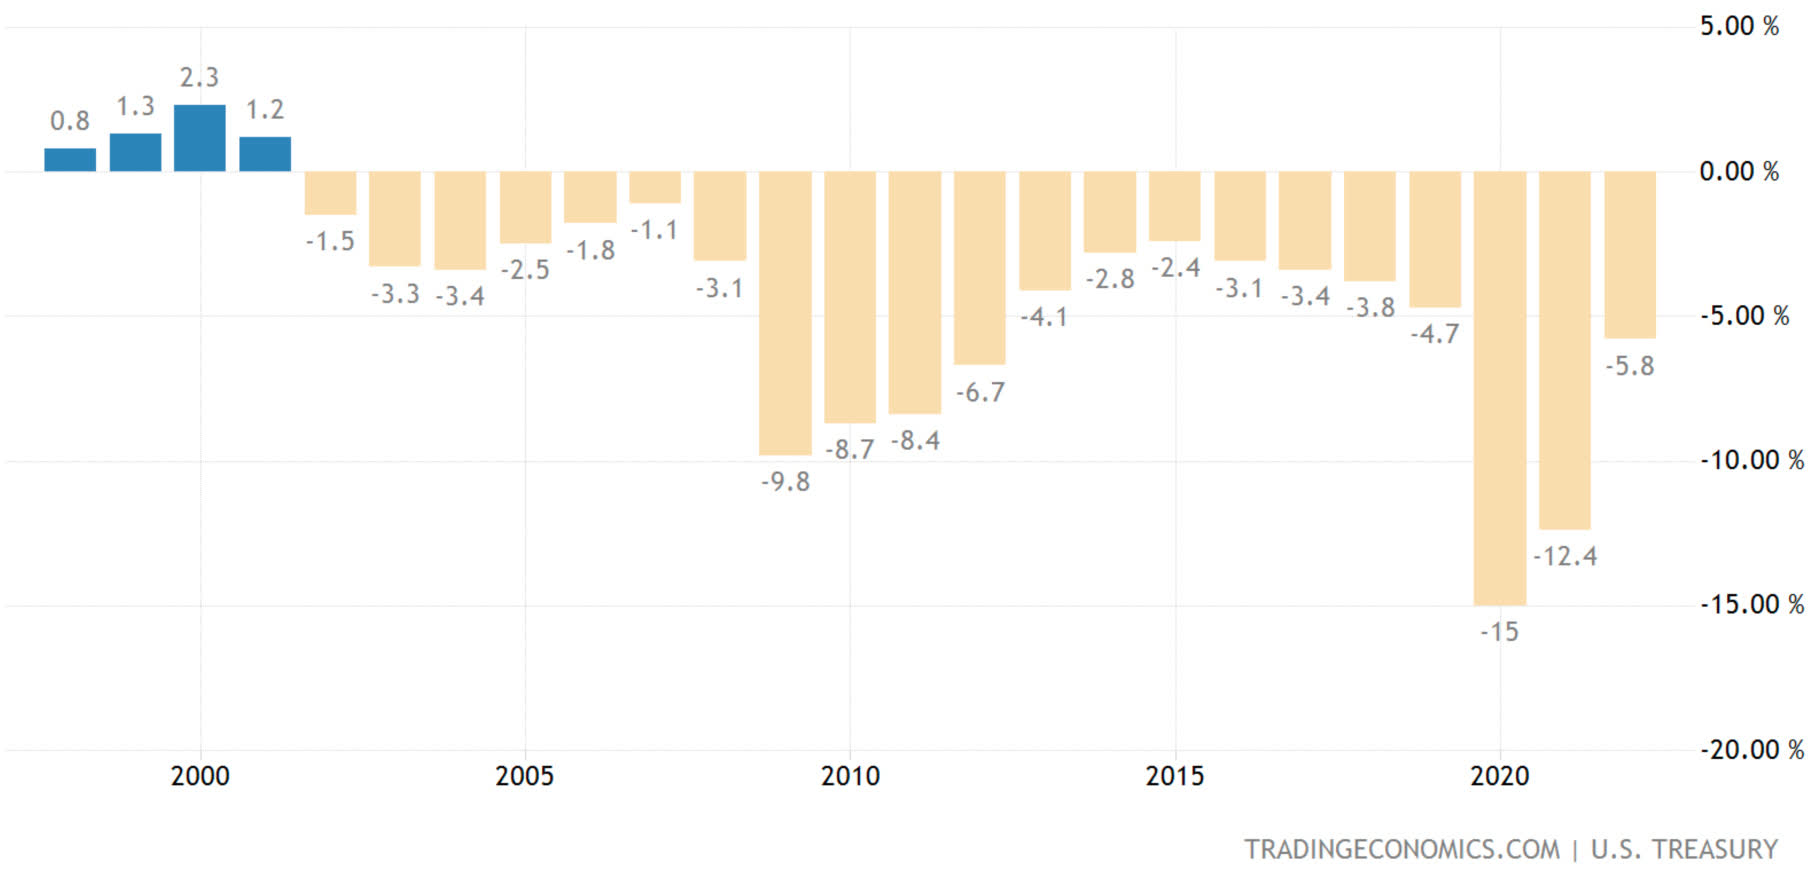
It doesn’t help that the U.S. has had a budget deficit every year since 2001 in both Democratic and Republican administrations. (This chart tracks each year’s deficit in terms of that year’s GDP).
U.S. Annual Government Debt as a Percentage of GDP
Graphs are for illustrative and discussion purposes only. Please read important disclosures at the end of this commentary.
These deficits were overseen by a 2-term Republican (G.W. Bush), a 2-term Democrat (Obama), a 1-term Republican (Trump) and a (so far) 1-term Democrat (Biden) and their administrations, so the problem is not purely partisan.
I am afraid that the Treasury will issue record levels of Treasuries at a time when the Fed is doing quantitative tightening and also, at least at the moment, contributing to the surge in yields.
All content above represents the opinion of Ivan Martchev of Navellier & Associates, Inc.
Disclosure: *Navellier may hold securities in one or more investment strategies offered to its clients.
Disclaimer: Please click here for important disclosures located in the "About" section of the Navellier & Associates profile that accompany this article.
Editor's Note: The summary bullets for this article were chosen by Seeking Alpha editors.
For further details see:
The Selloff In Stocks Is The Fed's Fault