JPRE - The State Of REITs: April 2024 Edition
2024-04-17 01:55:23 ET
Summary
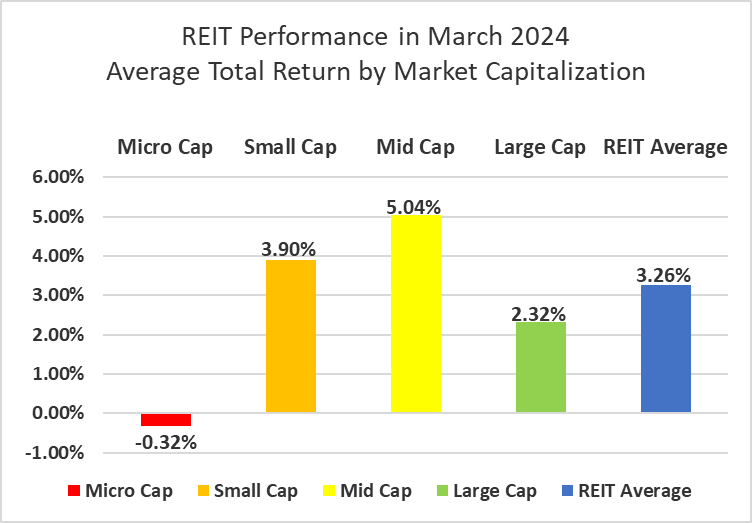
- REITs bounced back from a rough start to the year with a strong +3.26% average total return in March.
- Mid cap (+5.04%), small cap (+3.90%) and large cap REITs (+2.32%) averaged gains in March, while micro caps (-0.32%) saw yet another month in the red.
- 78.06% of REIT securities had a positive total return in March.
- 14 out of 18 REIT property types averaged a positive total return in March. Advertising REITs (+13.03%) led the sector, while Infrastructure REITs (-7.07%) badly underperformed again in March.
- The average REIT NAV discount narrowed from -18.50%to -15.96% during March. The median NAV discount narrowed from -16.62% to-15.63%.
REIT Performance
In March the REIT sector recovered some of its losses from the first two months of the year, but still closed out Q1 2024 in the red. Equity REITs averaged a +3.26% total return in March and outperformed the broader market. The NASDAQ (+1.8%), Dow Jones Industrial Average (+2.2%) and S&P 500 (+3.2%) all saw solid gains in March albeit smaller gains than the average REITs. The market cap weighted Vanguard Real Estate ETF ( VNQ ) fell short of the average REIT in March (+1.96% vs. 3.26%) but has seen smaller losses year to date (-1.28% vs. -2.87%). The spread between the 2024 FFO multiples of large cap REITs (16.9x) and small cap REITs (12.5x) remained flat in March as multiples expanded 0.1 turns for both large caps and small caps. Investors currently need to pay an average of 38.5% more for each dollar of FFO from large cap REITs relative to small cap REITs. In this monthly publication, I will provide REIT data on numerous metrics to help readers identify which property types and individual securities currently offer the best opportunities to achieve their investment goals.
Source: Graph by Simon Bowler of 2nd Market Capital, Data compiled from S&P Global Market Intelligence LLC. See important notes and disclosures at the end of this article