QQQ - The Stock Market Just Created The Ultimate Bull Trap
2023-06-08 12:00:20 ET
Summary
- It took weeks for the Bulls to finally make a run above 4,200.
- But it may only prove to be nothing more than a trap.
- It is clear now that the stock market has made a big mistake at the wrong time.
Stock markets appear to have mispriced interest rate risk and the path for monetary policy. Overall, equity markets have tried to front-run a Fed pause and a Fed rate-cutting cycle. That appears to be wrong and is now likely to go through the process of unwinding that mistake, setting up what could be a very painful bull trap that has been taking place since the beginning of April.
As noted first noted in the middle of April , bulls were trapped for weeks below the 4,200 resistance bound before finally surging higher following the better-than-expected May jobs report. But that surge has stalled out quickly and is now likely to start a process of reversing, as the Treasury General Account is replenished , and interest rates climb as the market prices in a potential rate hike between now and July, and removes rate cuts from the path of monetary policy.
In my opinion, this little surge above the 4,200 bound will prove to be a bull trap of the worst kind, with the S&P 500 Index (SP500) giving back its recent gains.
Tops Have Come At These Valuations
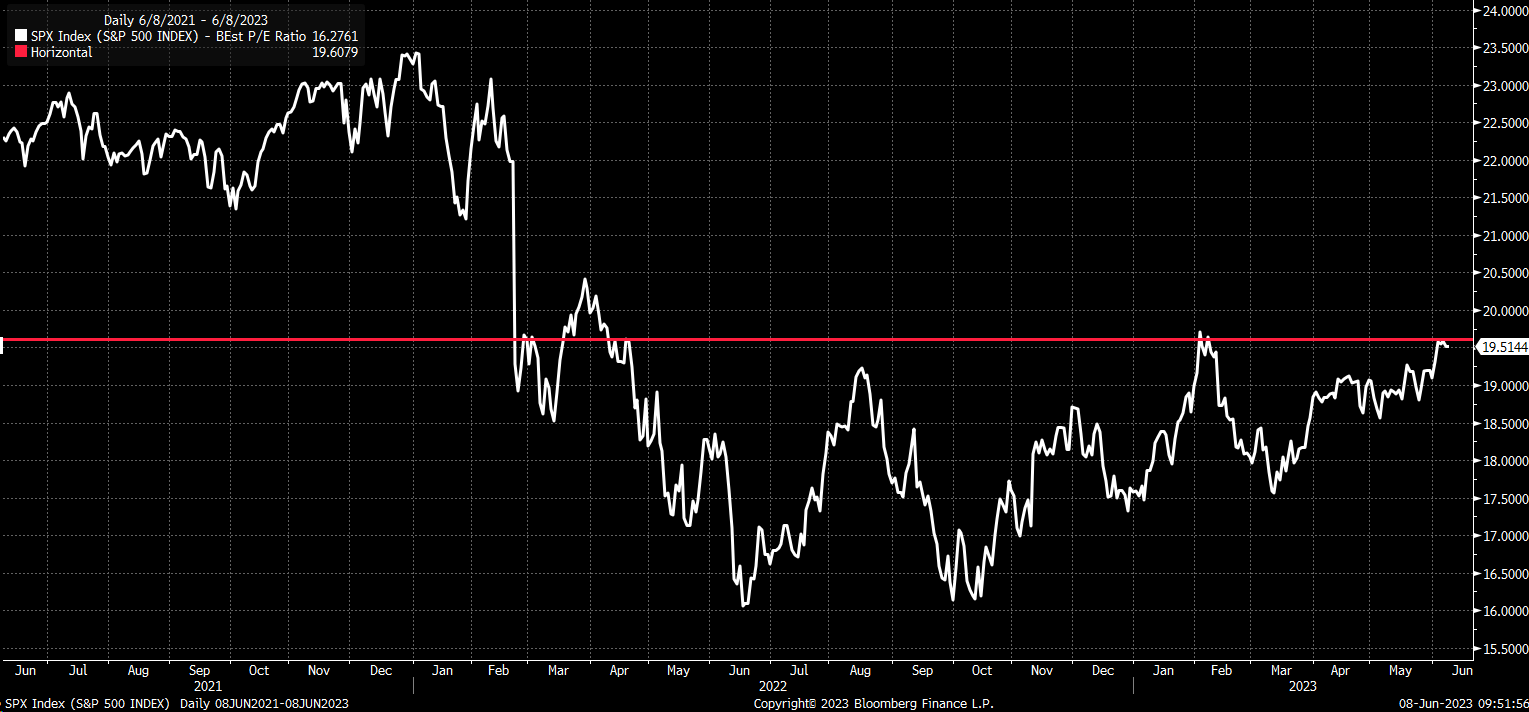
The S&P 500 Index is now very expensive on a P/E multiple, trading at 19.5 times earnings, which in the past has served as a strong resistance zone and a place where rallies have failed.
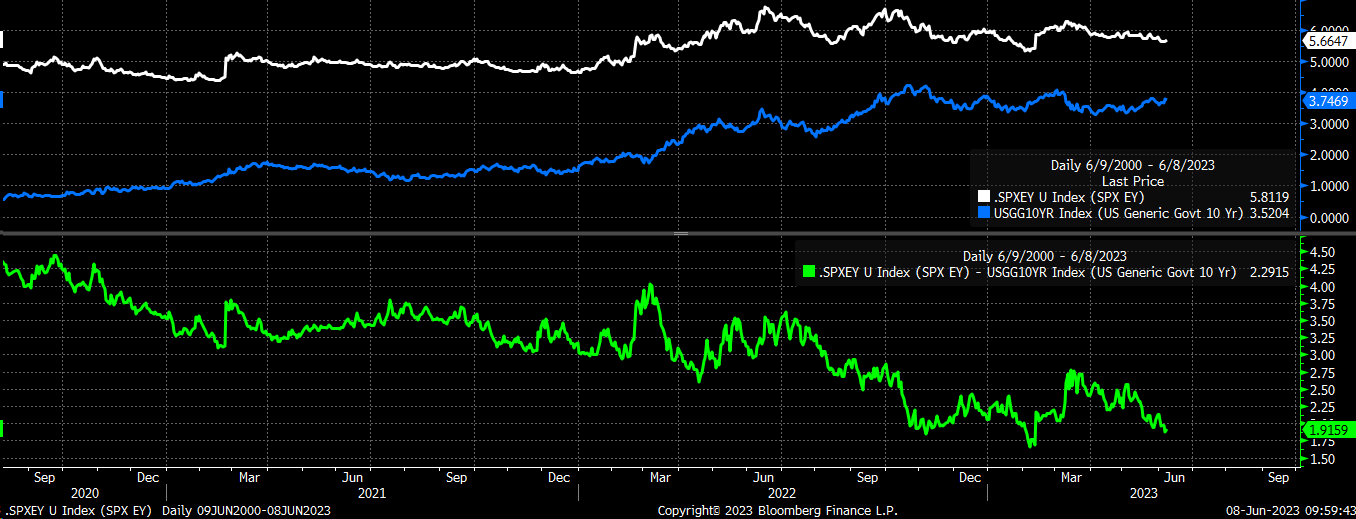
Additionally, when looking at the current valuation using next year's earnings estimates of $241.67, the S&P 500 has an earnings yield of 5.67%. With the current rate on the 10-yr Treasury (US10Y) at 3.75%, the spread is now at the same level it was in mid-November and mid-February, when the S&P 500 had previously peaked.
Yields Have Further To Climb
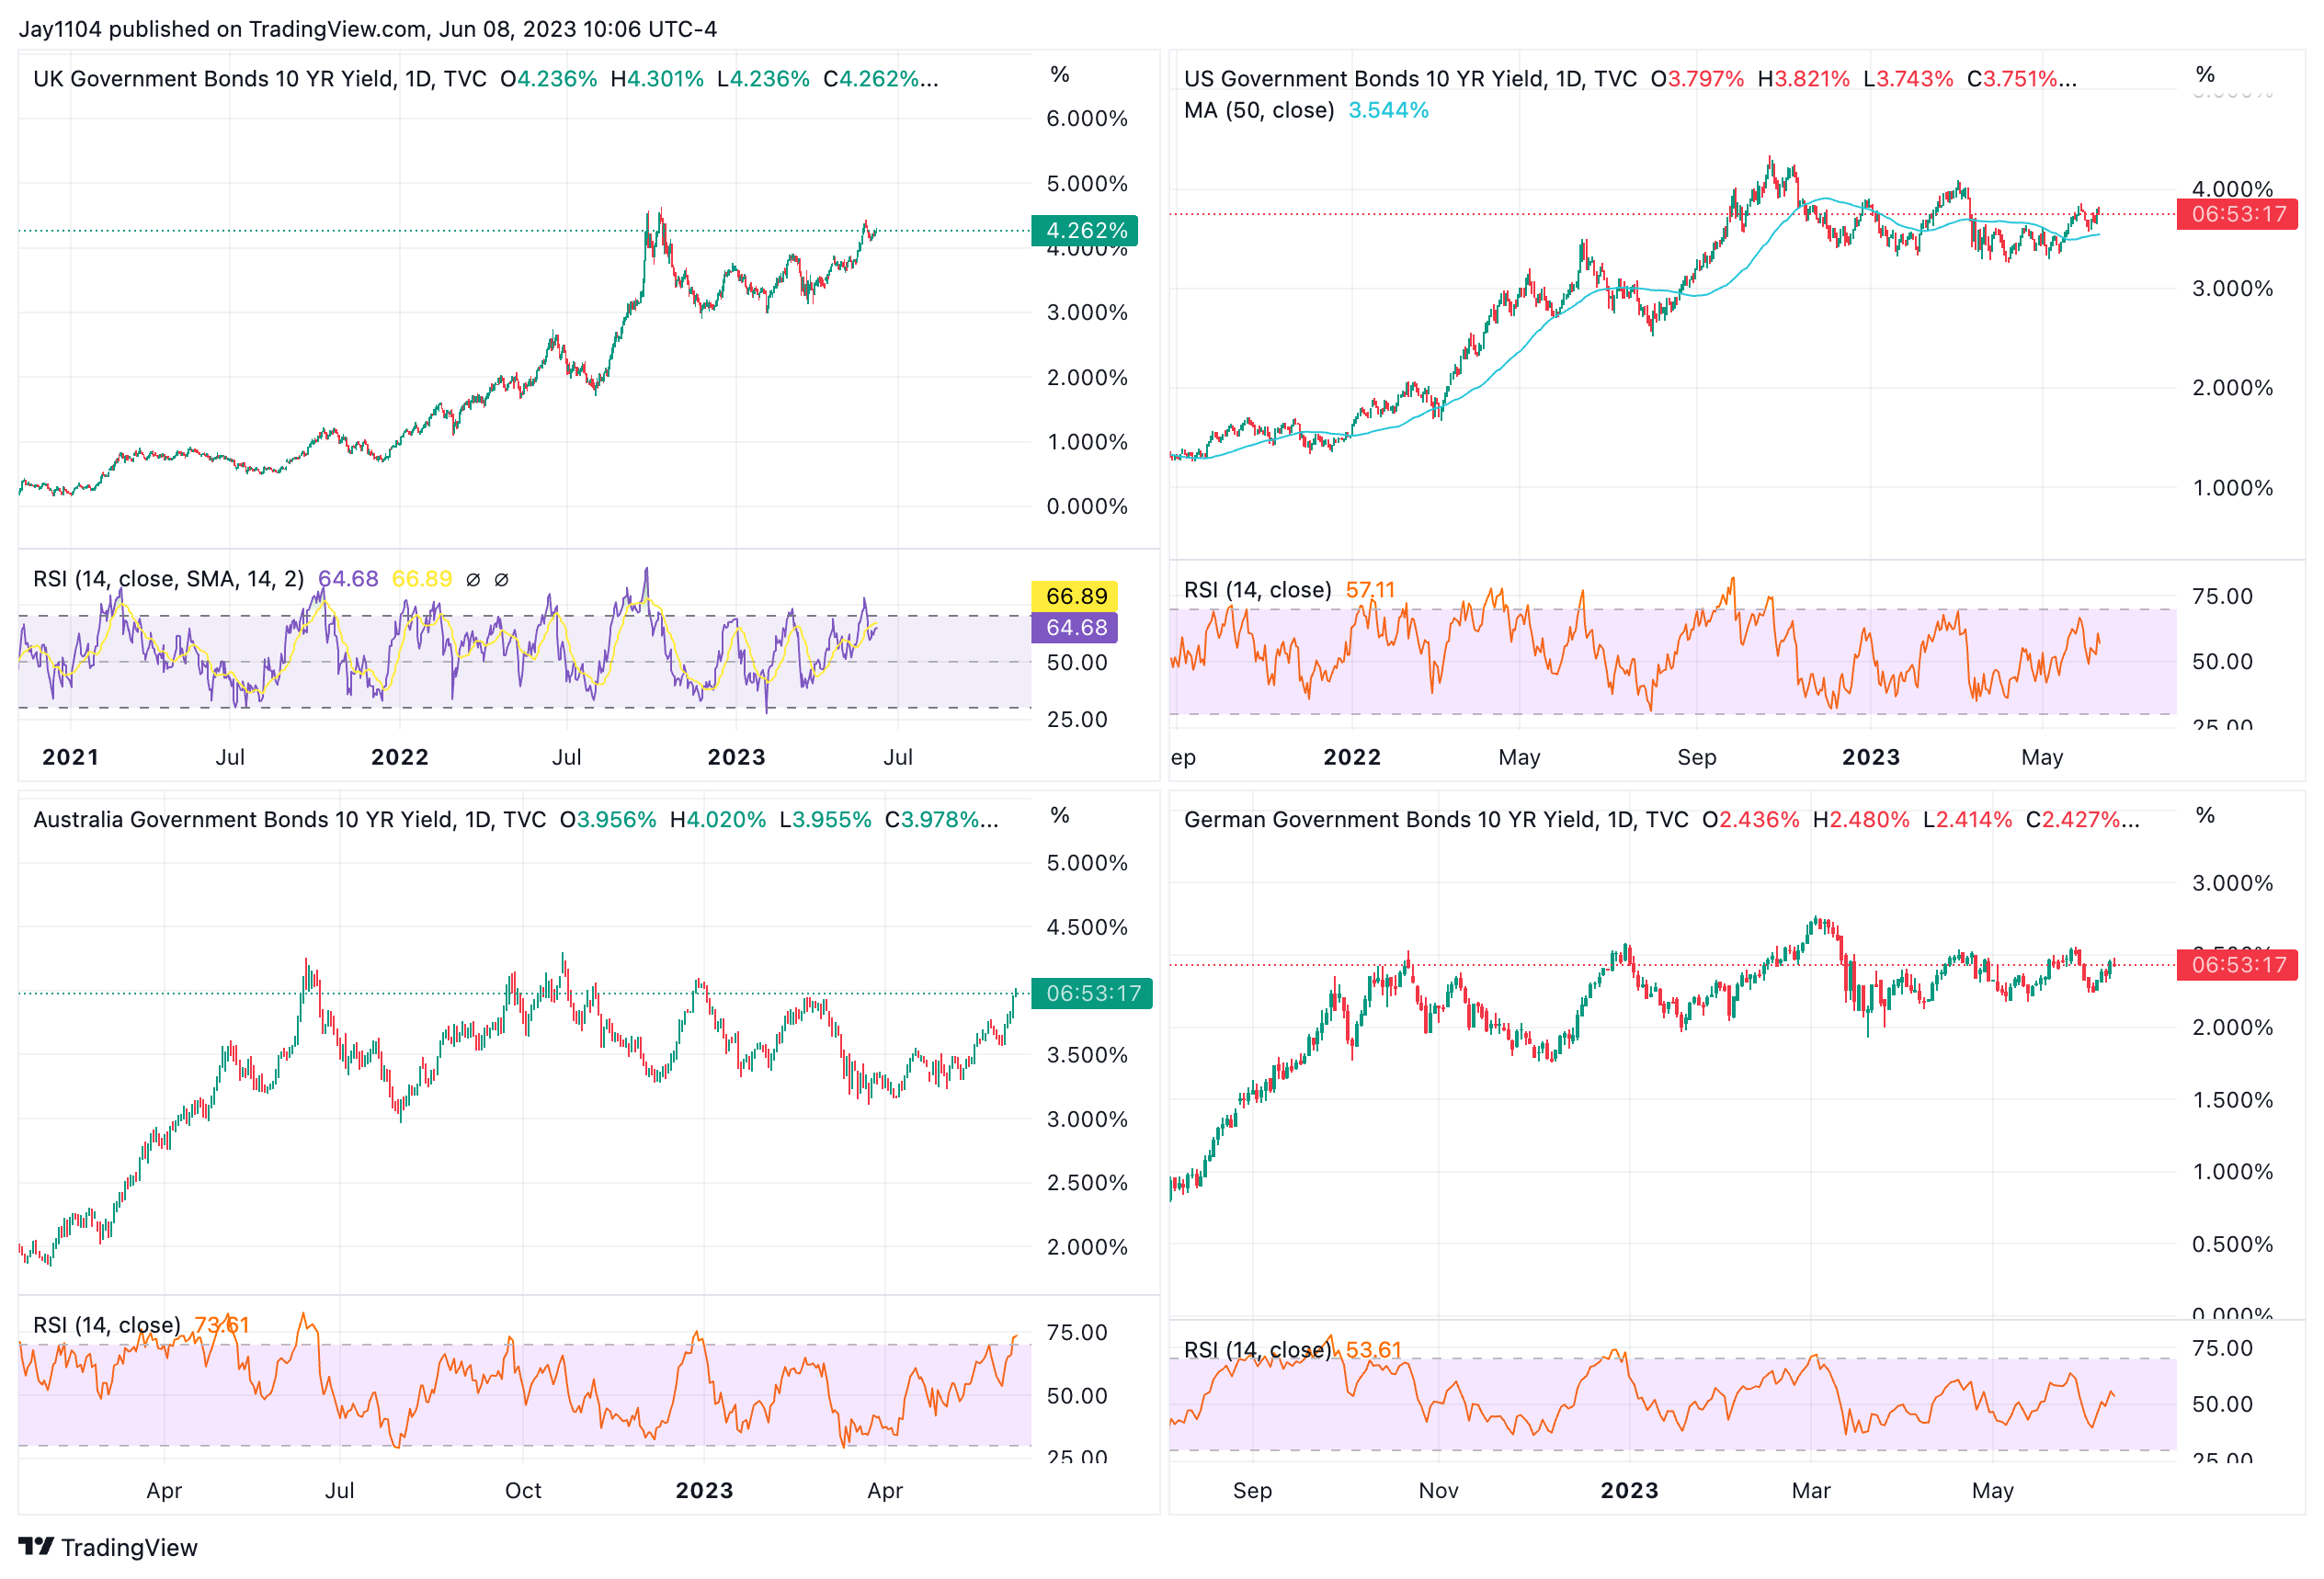
The problem is that not only are stocks expensive on a P/E basis in historical terms, but they are also expensive versus bond yields currently. Making matters worse, yields are likely to continue to rise on the back of the curve as the economy continues to show signs of holding together and putting recession off. Additionally, rates globally are once again heading higher, as central banks are re-engaging in rate hikes such as Australia and Canada more recently.
While the Fed isn't likely to follow the two banks' leads, the two central banks provide examples of banks that had previously "paused" and were forced to restart the tightening process. Additionally, inflation remains elevated in places like the United Kingdom and is not coming down. This is putting upward pressure on rates globally and, in some cases causing rates to challenge and surpass their previous cycle highs.
The British 10-year and Australian 10-year are now back to trading at their October highs, which tends to help rates in the U.S. move higher as well. Additionally, the longer the U.S. economy stays strong, and the longer inflation remains sticky, the more likely it is that rates in the U.S. will likely continue to drift higher.
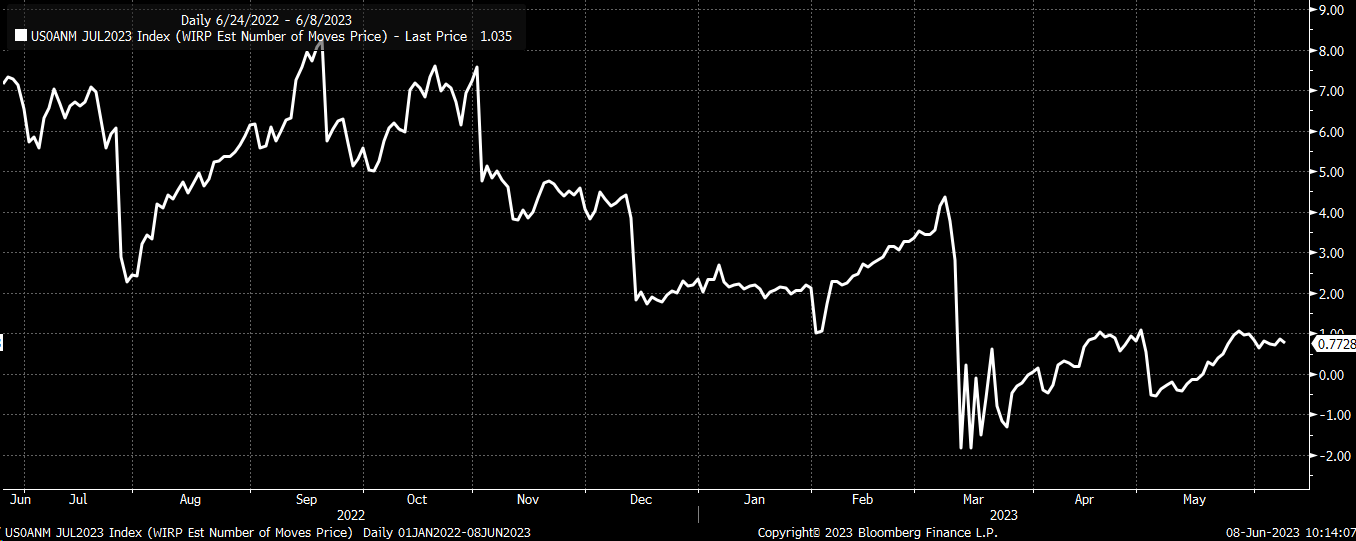
The other added risk is that Fed may not be done raising rates, as I initially noted back in May. The market seems to be coming around to that thesis as it now sees a potential rate hike by another 25 bps at almost 80% by July.
Additionally, rate cuts that were once priced into the market in 2023 have now been removed, as noted by the Fed Funds Futures curve. With the December Fed Fund futures currently trading at 5.03%
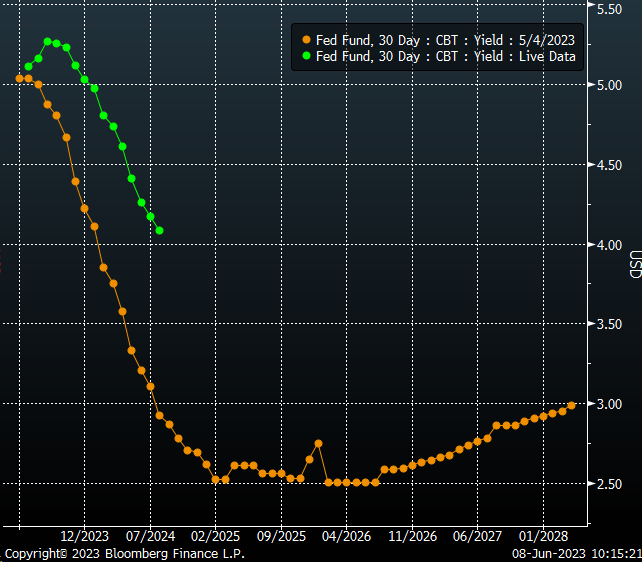
Technical's Turning
Additionally, the technical pattern of the S&P 500 reflects that of a rising flag, which tends to be a reversal pattern and is similar to what was also seen in November. Currently, the S&P 500 is in what is known as the throw-over phase of the pattern, which is likely to result in the index dropping and coming back down and through the recent trading channel.
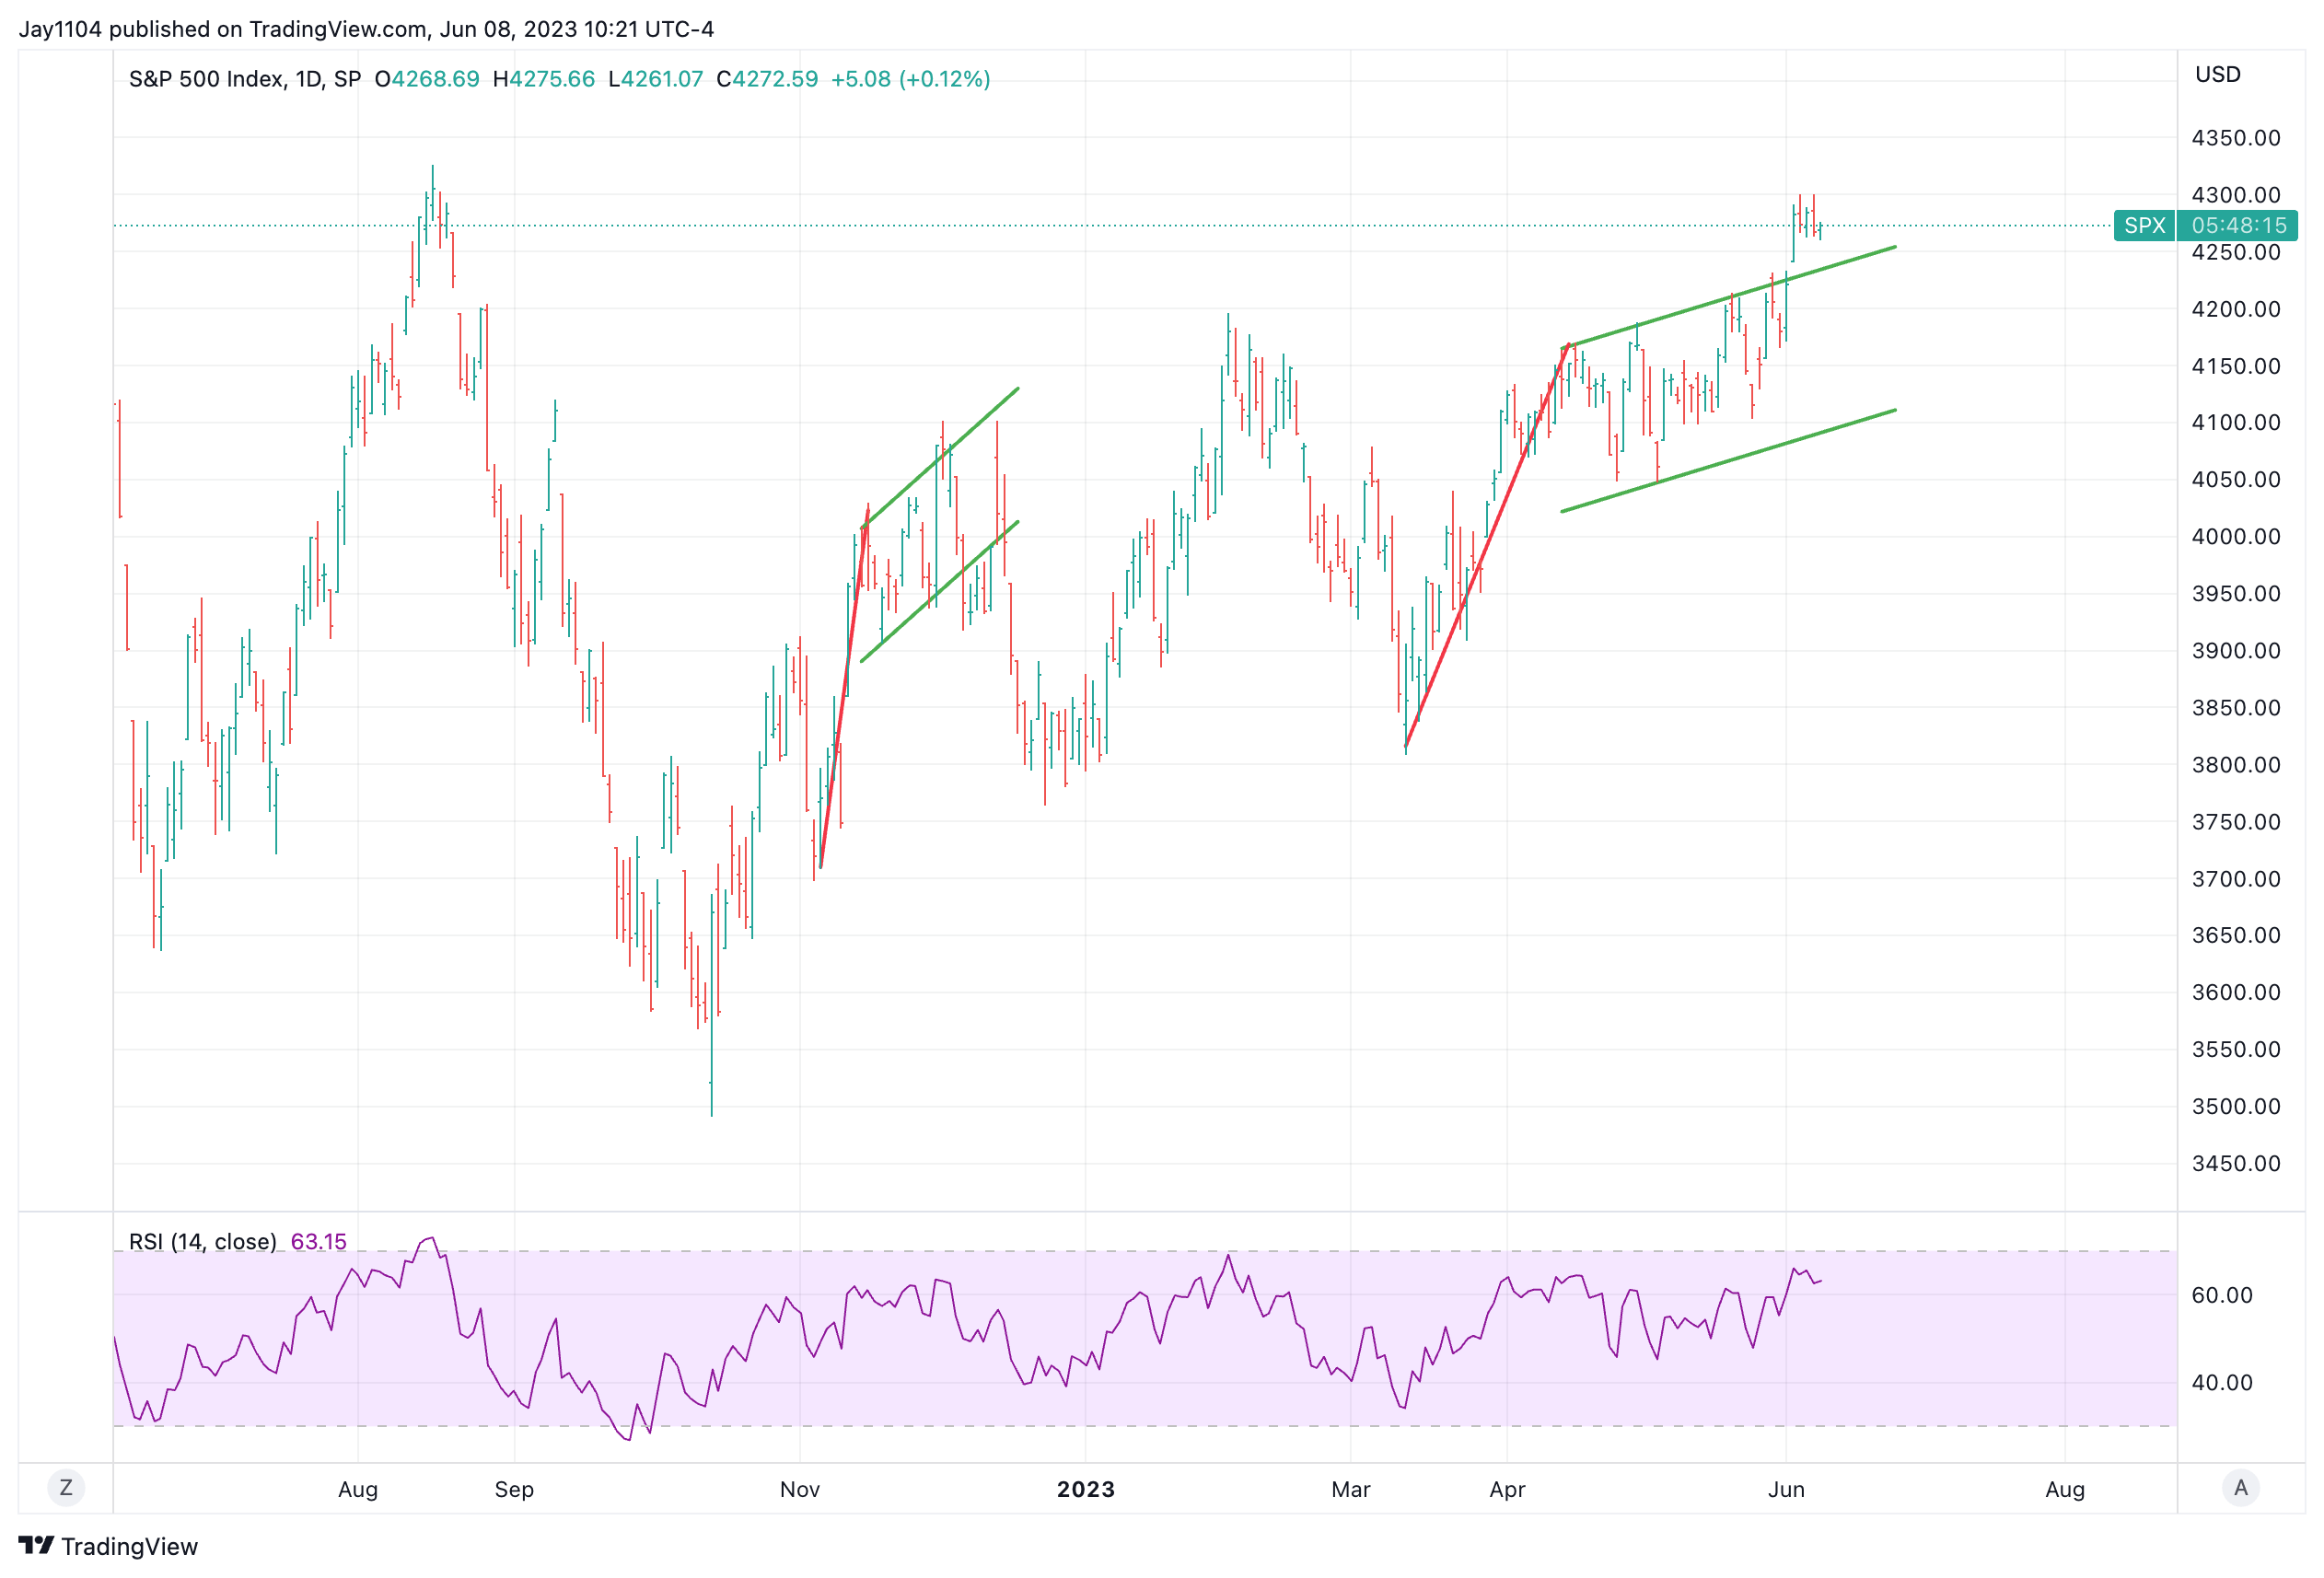
Meanwhile, the S&P 500 has been trading with a clear cycle over the past years of about 60 days. The recent peak in the cycle occurred just this week, suggesting the index should be entering the part of the cycle that is moving lower. These cycle changes tend to happen around the time of the monthly job report. The one exception recently appears to have been in May, with a minor move lower.
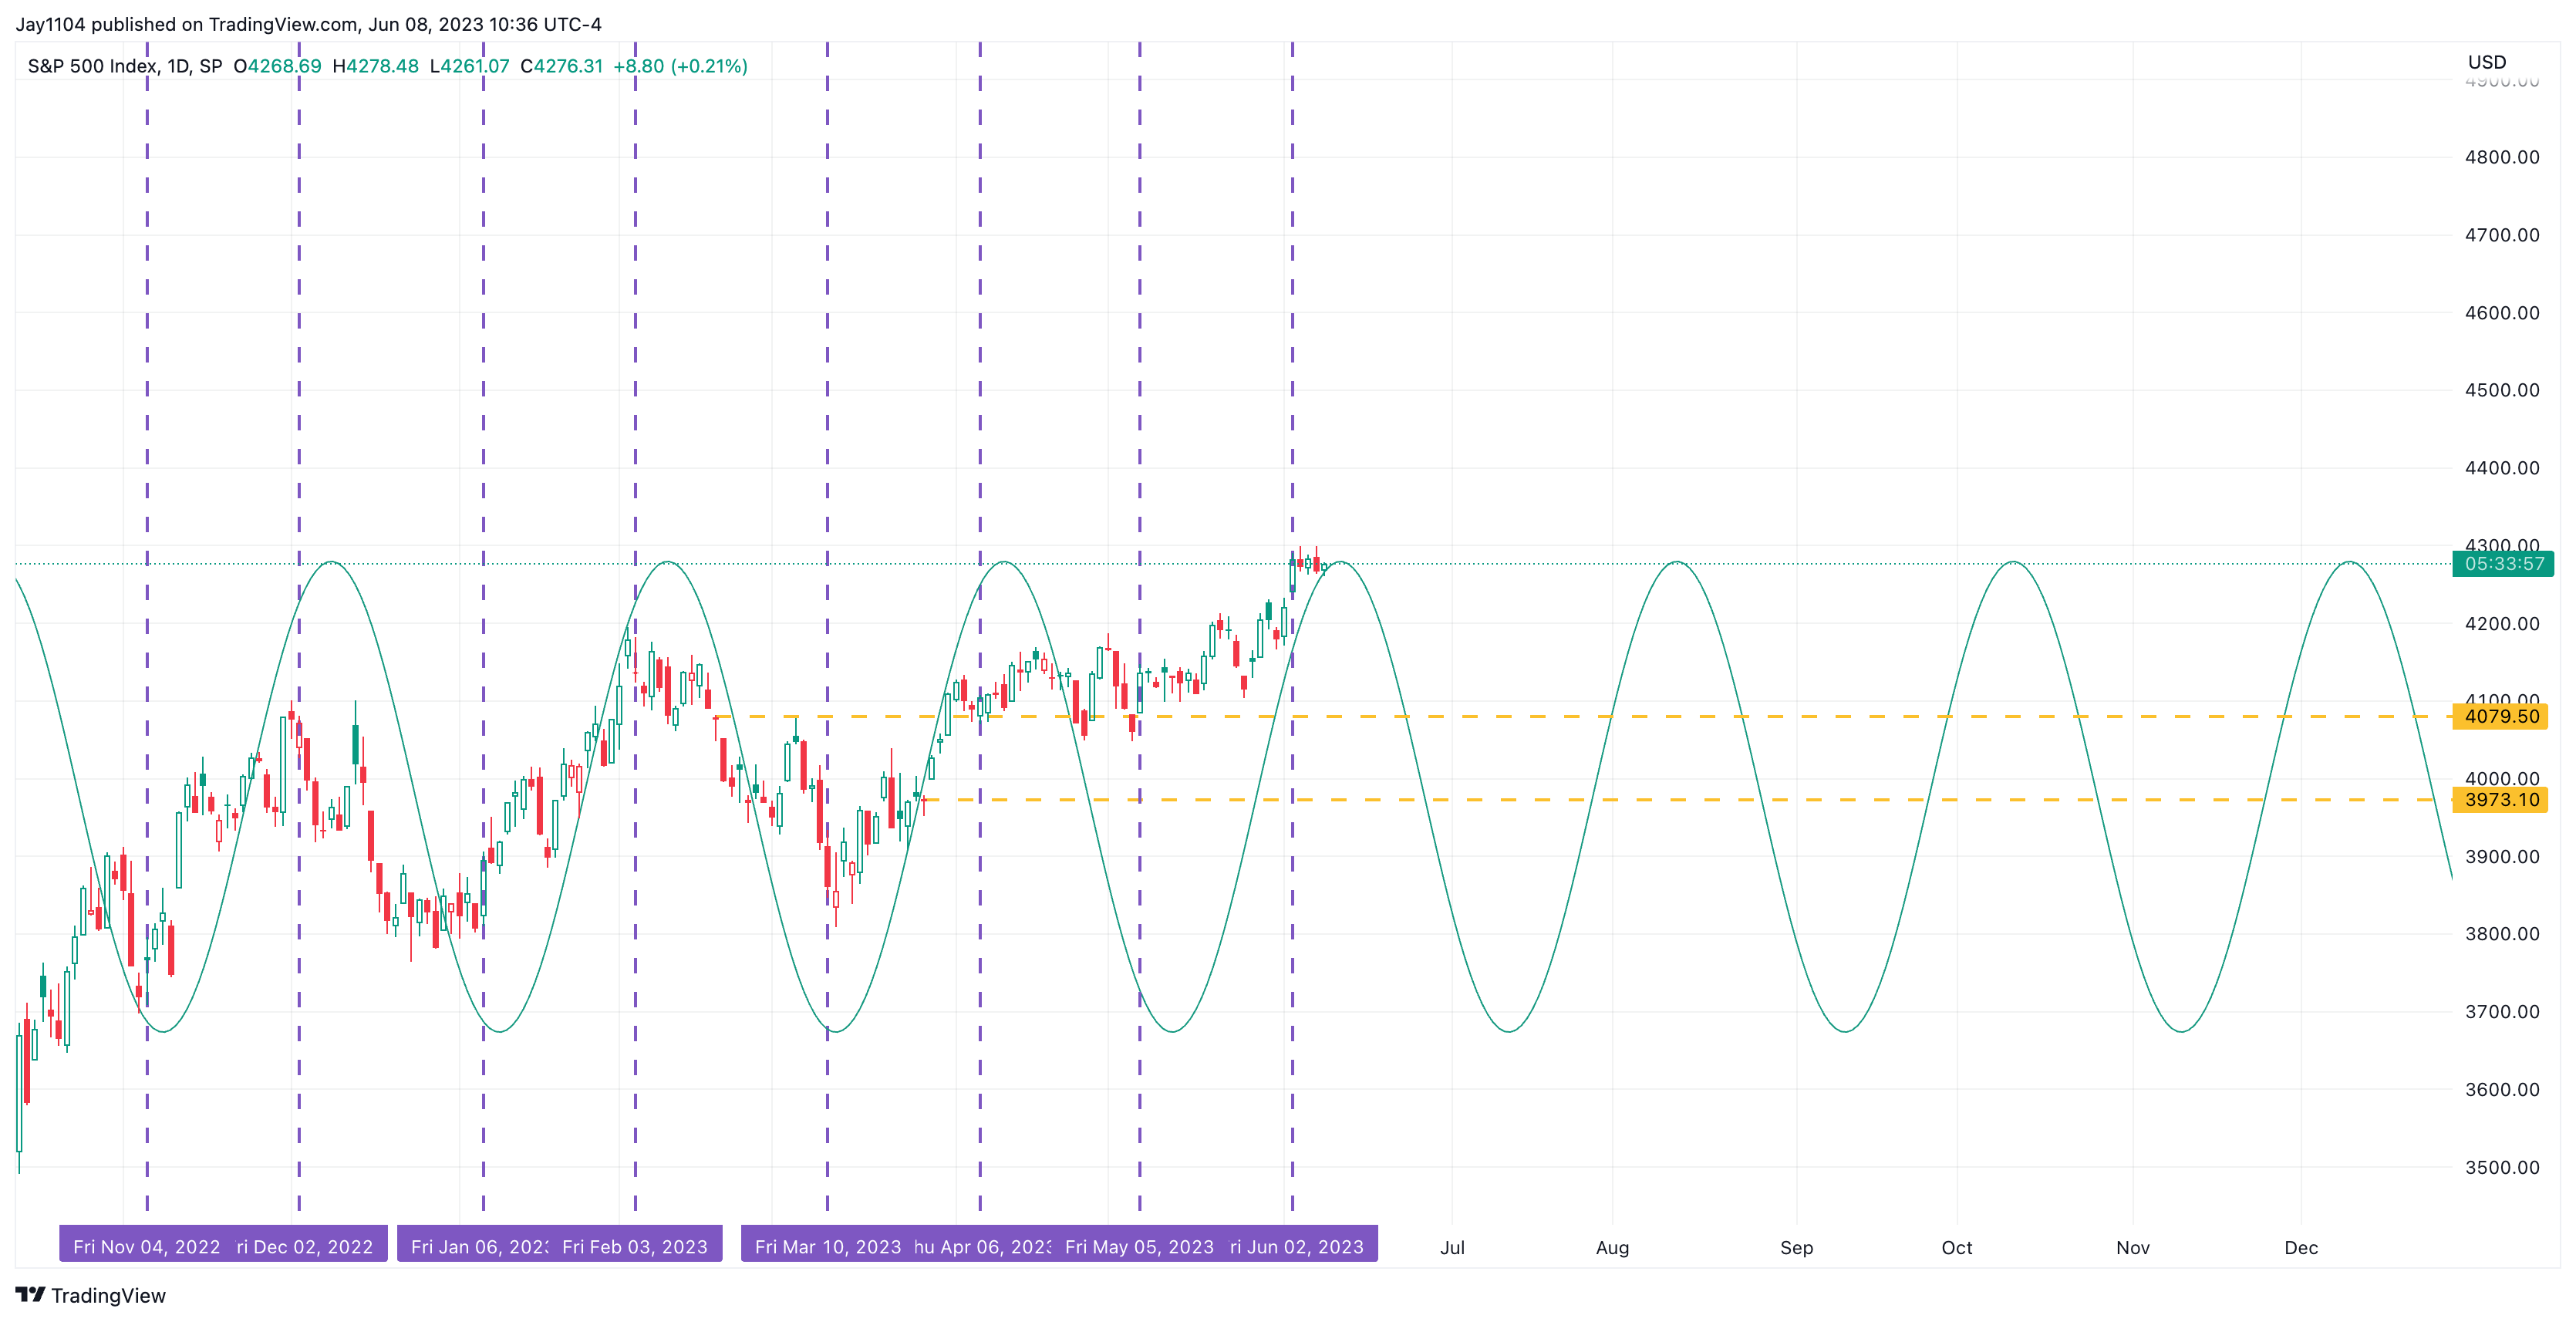
The move above the 4,200 to 4,225 region on the S&P 500 may prove to be nothing more than a blip in time that ultimately sucked all the bulls in, trapping them, as it then turned lower, realizing it made a mistake not taking the risk for higher interest rates more seriously.
For further details see:
The Stock Market Just Created The Ultimate Bull Trap