KMLM - The Ultimate 7.5% Yielding Monthly Paying Retirement Portfolio
2023-07-21 07:30:00 ET
Summary
- Even in this overvalued and irrational market, you can build dream portfolios for virtually any goal.
- Here are the best high-yield monthly paying blue chips you can safely buy today, regardless of what happens next with the economy or market.
- They yield a very safe 5.6%, are 24% undervalued, and offer 11.2% long-term return potential, similar to the returns of the last 16 years.
- Combining them with the highest yielding safe CEF adds diversification and boosts yield even more, while generating rock steady monthly income from reliable infrastructure investments.
- Finally, add the gold standard high-yield hedging ETF, the Buffett of managed futures, and you get a 7.5% yielding monthly paying retirement portfolio. One that yields 3.4X more than a 60/40 outperforms a 60/40 by 2% to 3% per year, and falls 50% as much as the S&P 500 in bear markets.
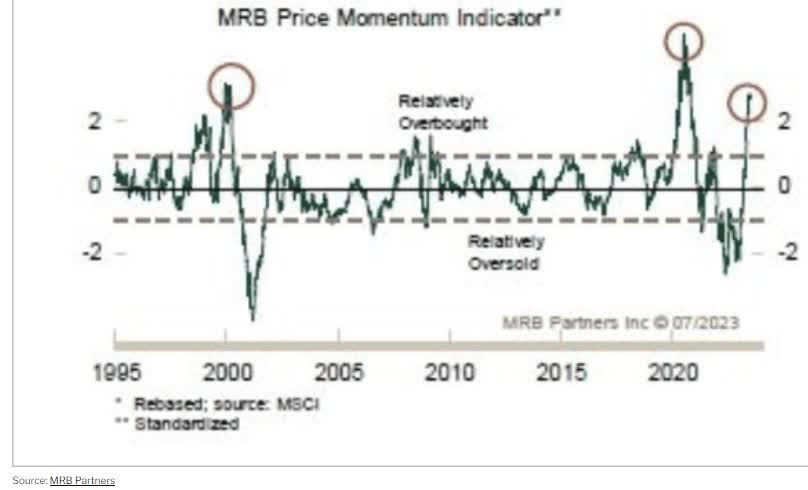
For months the market has been melting up in a speculative AI-driven mania that has now reached historically absurd levels.
Daily Shot
But each week, I find highly reasonable and prudent income growth opportunities that smart investors like you can use to achieve your financial dreams. Not by chasing the crowd, but by focusing on safety and quality first, and prudent valuation and sound risk management always.
I just received an interesting request from a subscriber to showcase a few prudent high-yield monthly paying dividend blue chips.
I'll do you one better and show you how to build the ultimate high-yield monthly dividend portfolio. One that yields a safe 7.5% and is ready for anything the economy or stock market throws at us in the coming year and all the years to come.
The Best Monthly Dividend Stocks You Can Safely Buy Right Now
I've linked to articles about each company for further research.
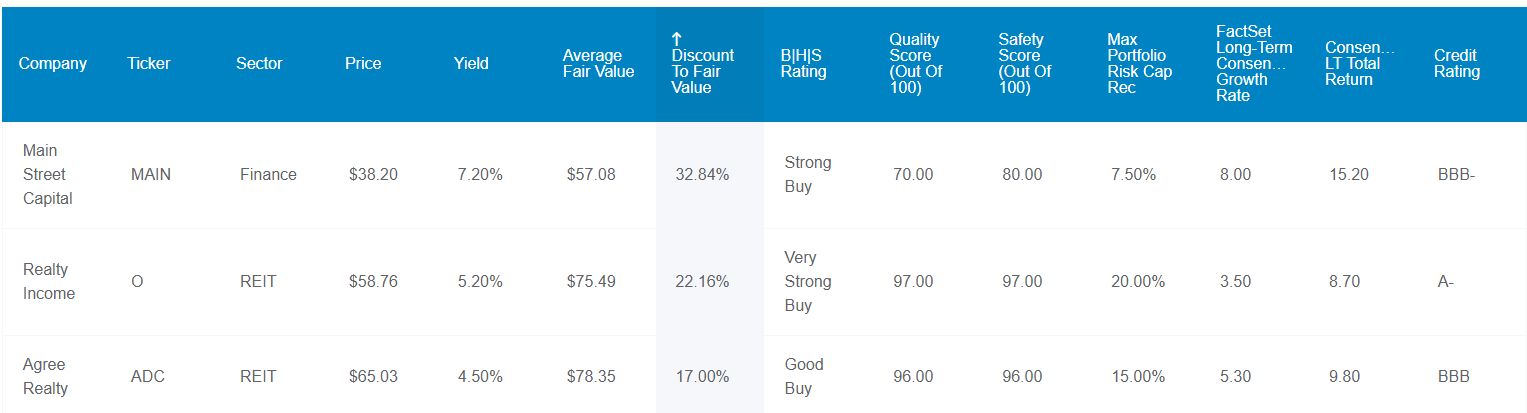
Dividend Kings Zen Research Terminal
- Main Street Capital ( MAIN )
- Realty Income ( O )
- Agree Realty ( ADC )
Fundamentals Summary
- Yield: 5.6%
- Quality Score: 88% (Super SWAN)
- Dividend Safety Score: 91% - very safe - 1.45% severe recession dividend cut risk
- Discount To Fair Value: 24% (Strong Buy)
- Growth Consensus: 5.6%
- Total Return Potential: 11.2%
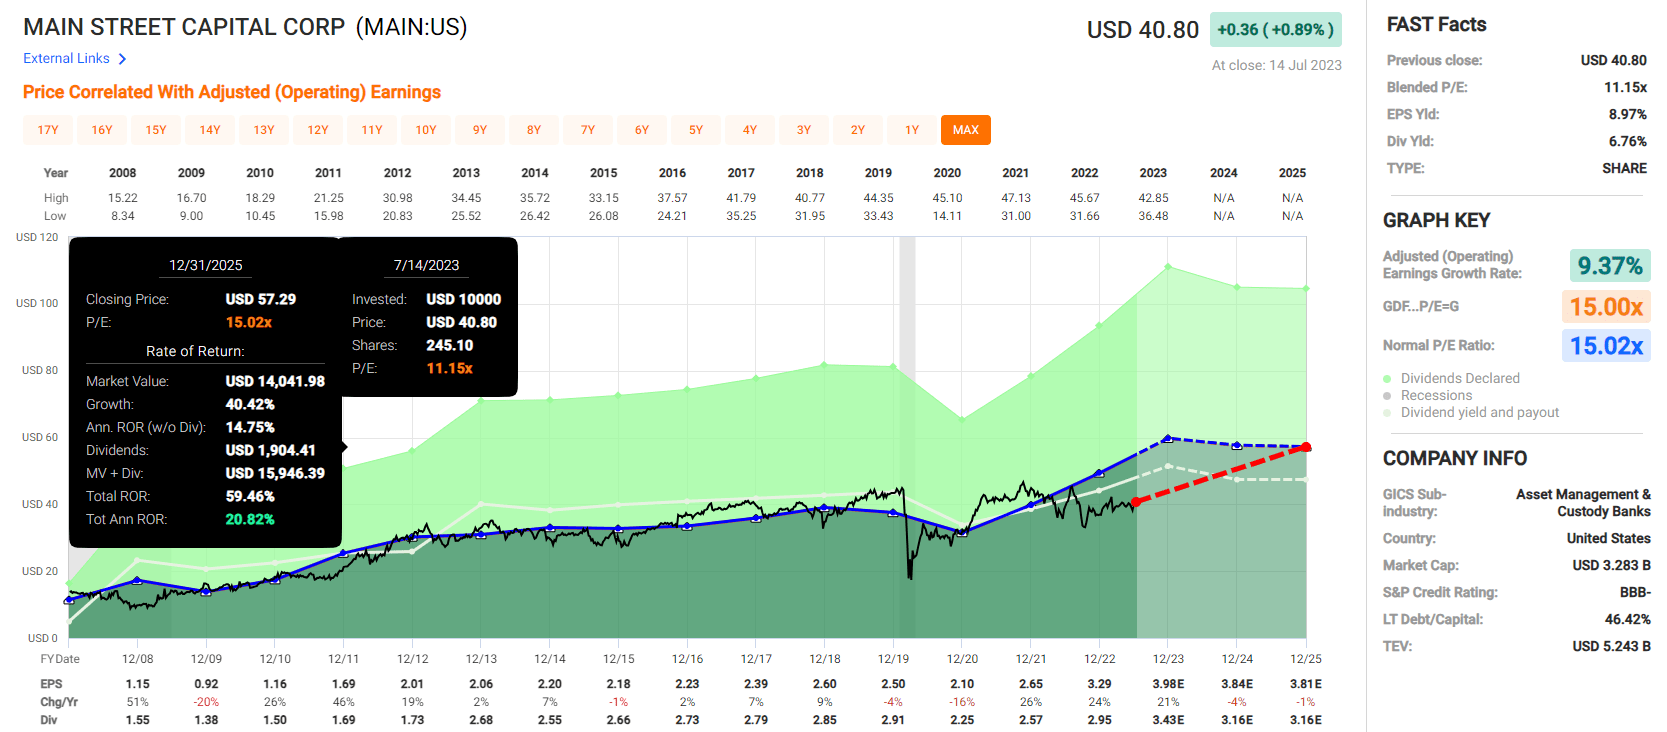
Main Street Total Return Potential
FAST Graphs, FactSet
Realty Income Total Return Potential
FAST Graphs, FactSet
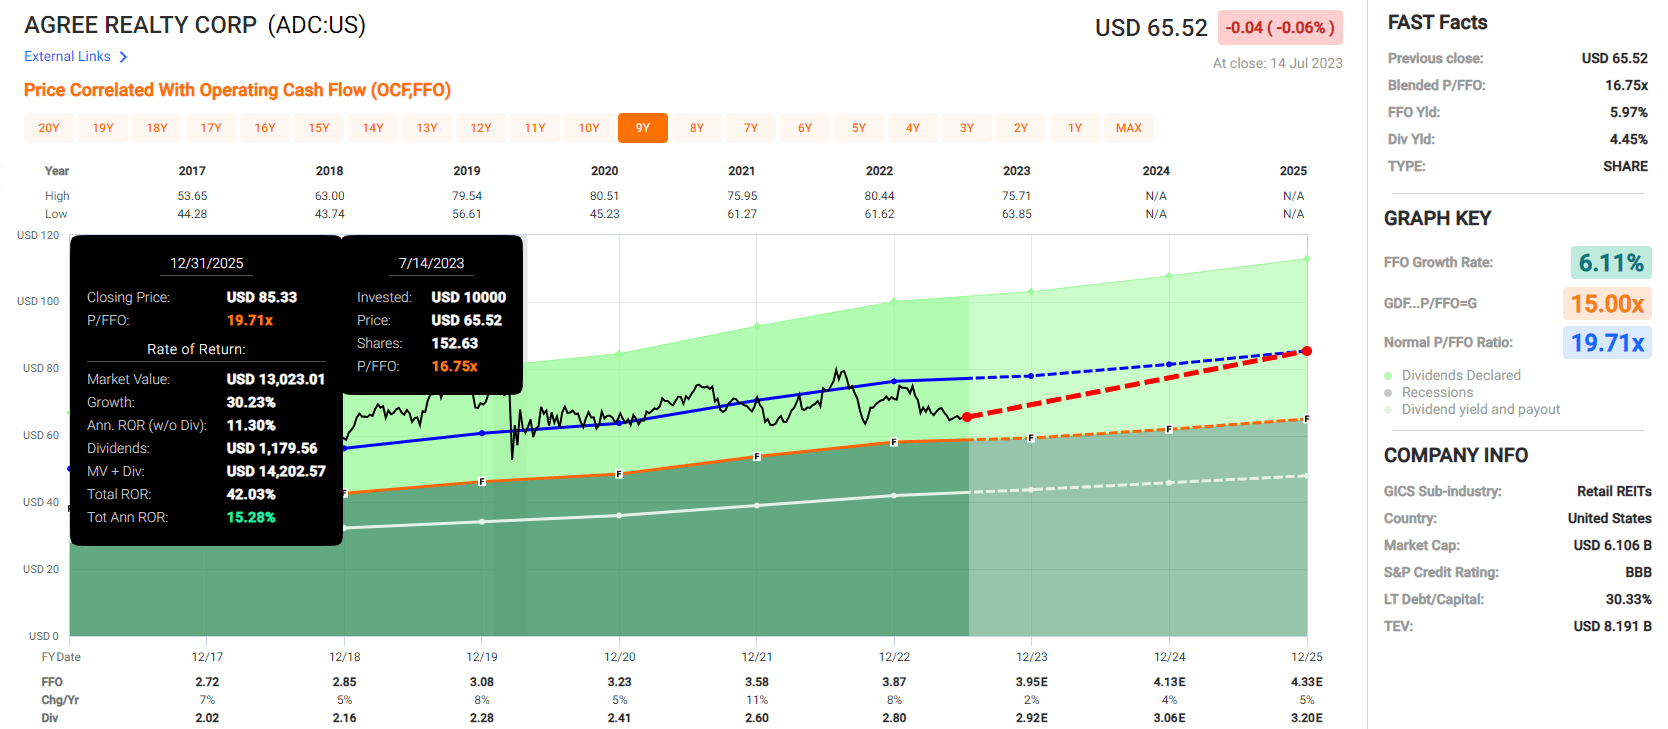
Agree Realty Total Return Potential
FAST Graphs, FactSet
S&P 500 Consensus Total Return Potential IF We Avoid Recession
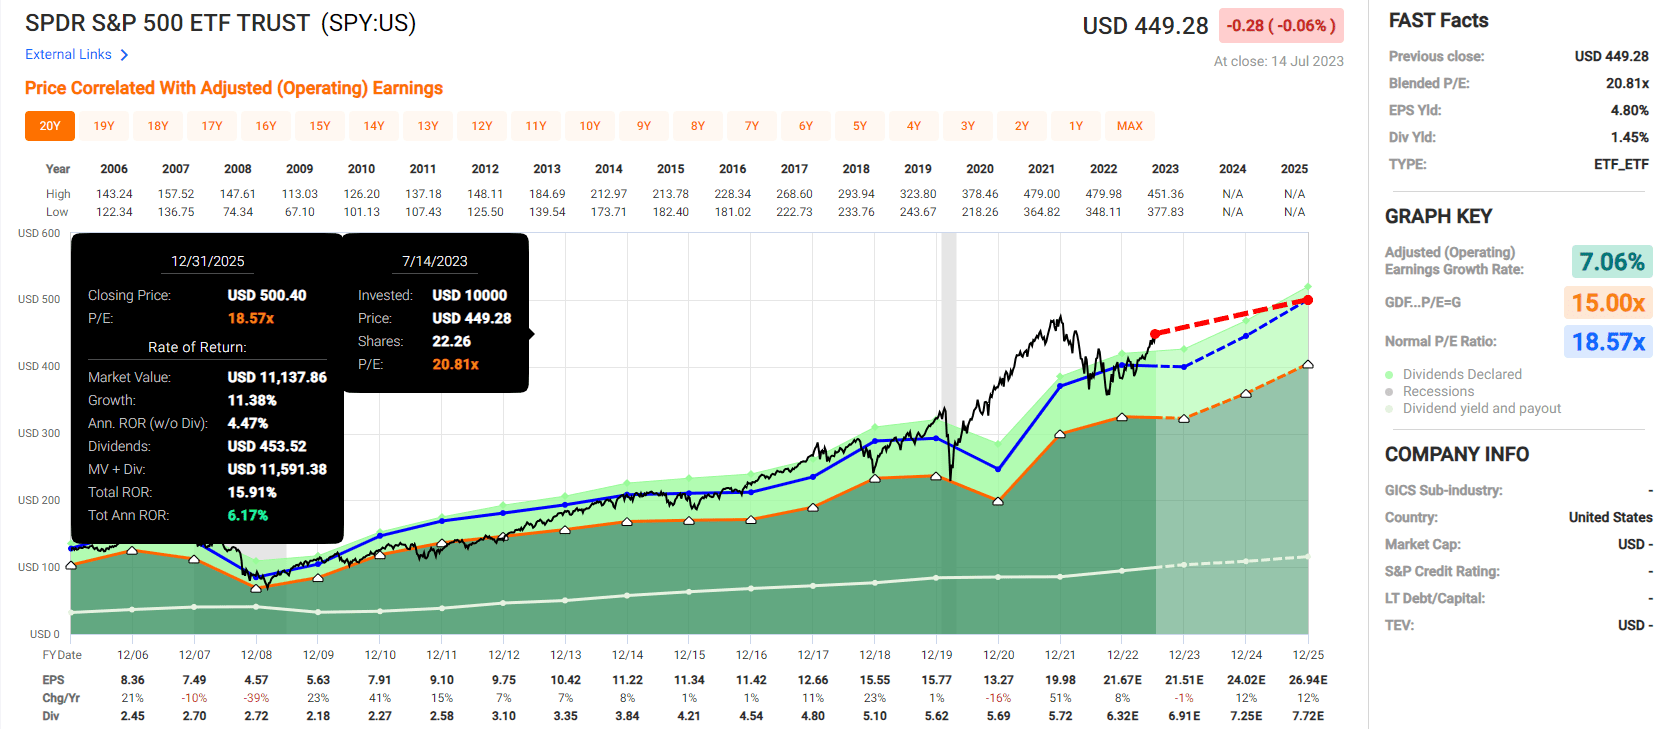
FAST Graphs, FactSet
3X the market's return potential, 4X the market's yield, and superior quality to boot.
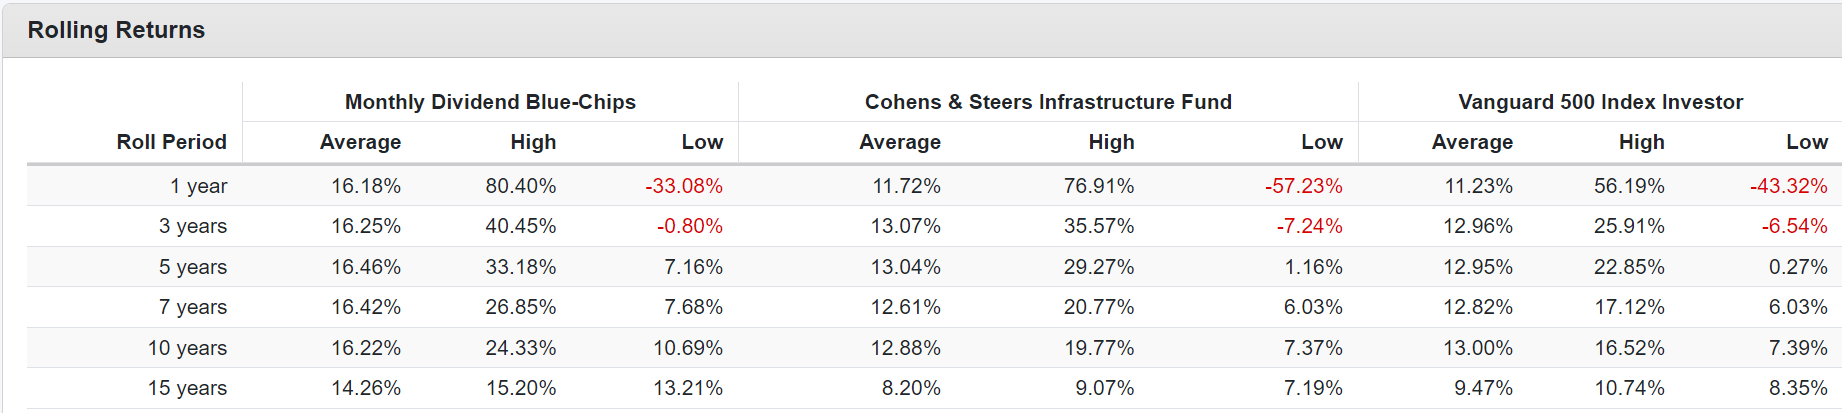
Historical Total Returns Since 2007
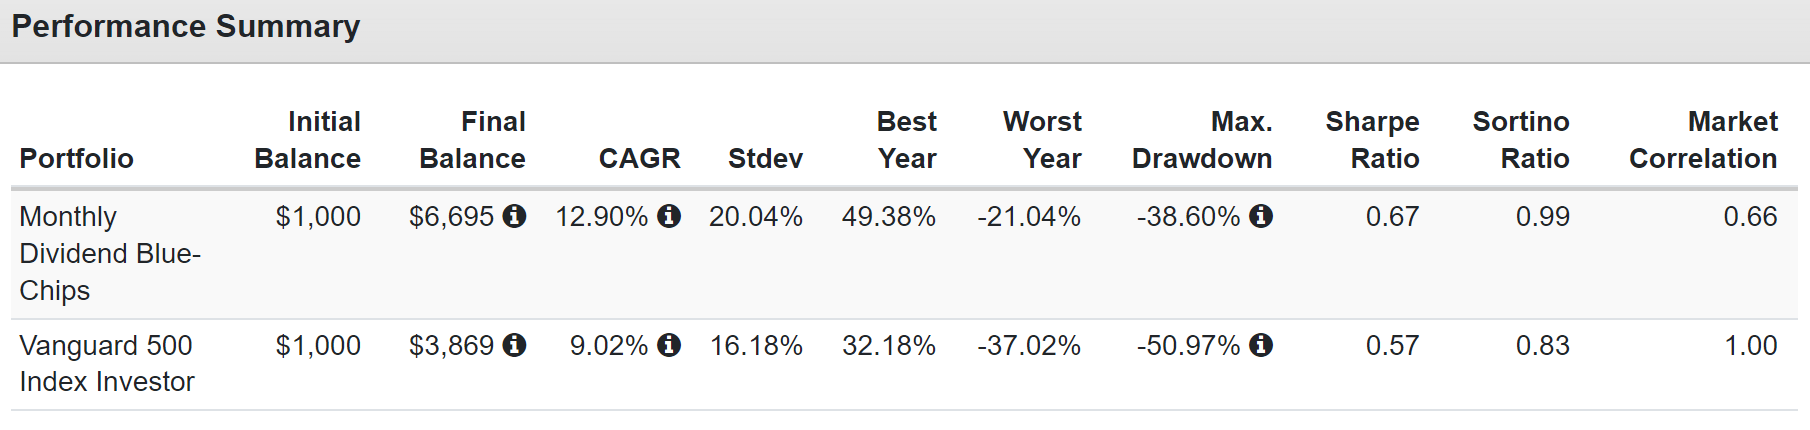
Portfolio Visualizer Premium
11% expected future returns, similar to the historical returns over the last 16 years.
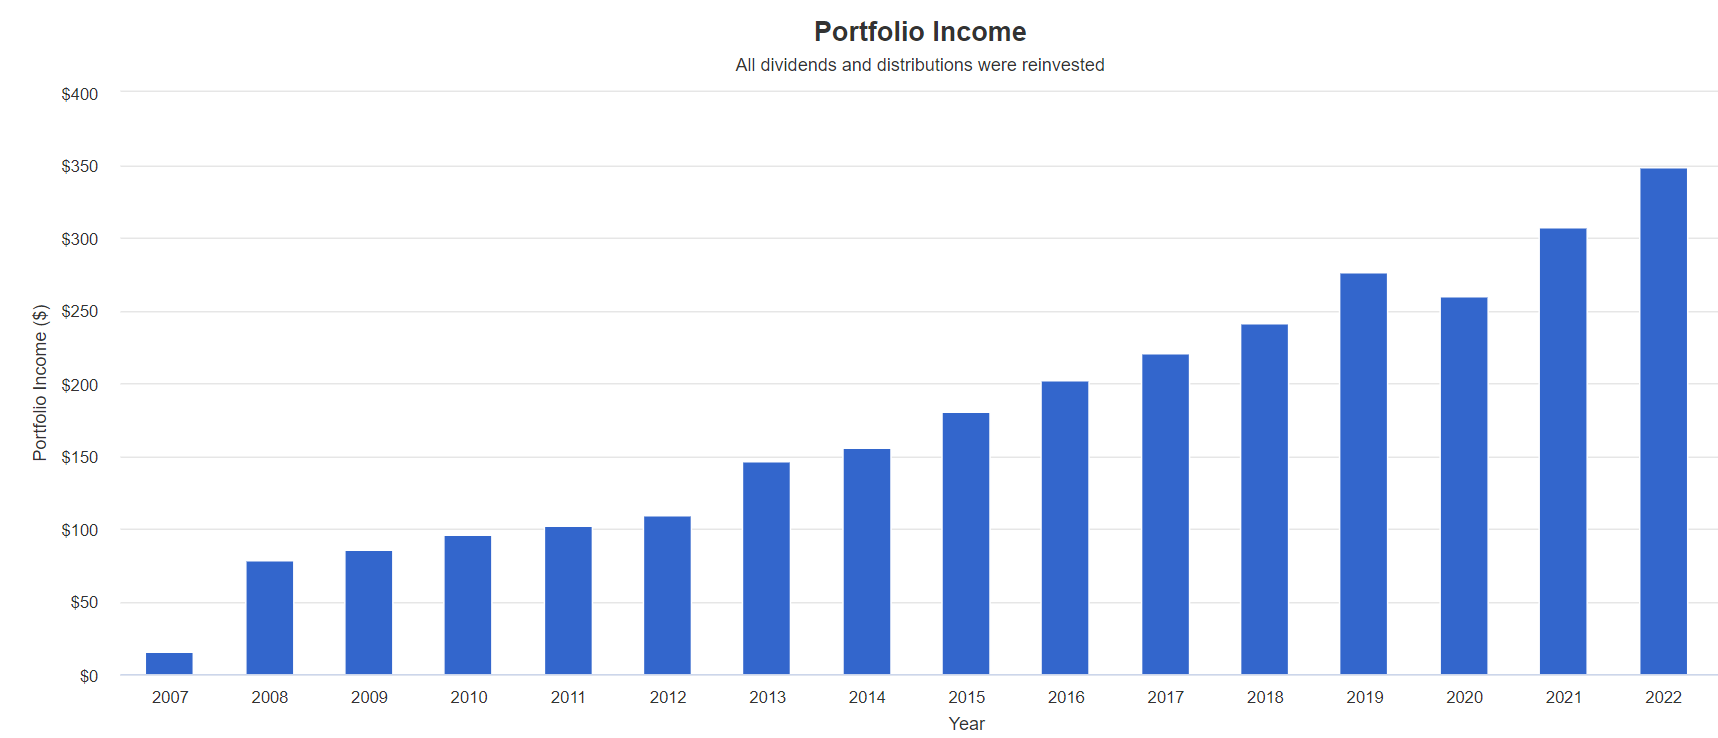
Portfolio Visualizer Premium
11.2% annual income growth since 2008 compared to 8% for the S&P 500.
So you can see this is a high-quality group of monthly paying dividend stocks. Now here's how to build a ZEUS portfolio around them.
Building A ZEUS Monthly Paying Portfolio
ZEUS stands for Zen Extraordinary Ultra SWAN. It's built around the principles of optimal asset allocation for achieving the best long-term returns while minimizing volatility in bear markets.
- Sortino ratio optimization
- Sortino ratio = excess total return/negative volatility only
33% invested in even the safest Ultra SWANs is probably not prudent. After all, even GE was once an Ultra SWAN aristocrat with a AAA credit rating and a CEO hailed as Fortune's "CEO of the Century."
This is where the ZEUS framework helps us to achieve a balanced, diversified portfolio, one we can actually trust with our savings.
- 33% ETFs or safe CEFs or mutual funds
- 33% hedges
- 33% individual stocks
This barbell system boosts the core fund portfolio bucket with superior fundamentals from your individual stocks.
You can far surpass what a pure ETF portfolio could ever do with the right companies.
In the case of this monthly ZEUS portfolio, I'm going with the highest-yielding safe CEF, the Cohen&Steers Infrastructure Fund ( UTF ).
Here's a quick summary of what UTF owns.
Morningstar
We have five different sectors, and our largest holdings are MAIN, ADC, and O at 11% each.
- Up to 15% would be safe per our safety and quality guidelines
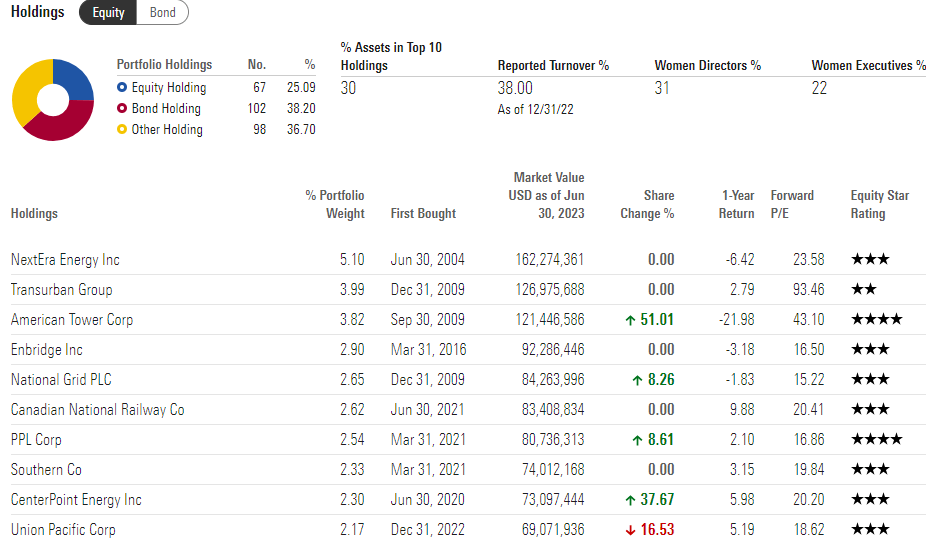
Morningstar
UTF owns world-beater infrastructure from all over the world.
Morningstar
And as you can see the historical annual returns of UTF are similar to what analysts expect from the three blue-chips in the future.
Portfolio Visualizer Premium
This means that we're not likely to sacrifice returns for diversification, and since UTF yields a safe 8%, we're boosting yield a bit.
KMLM: The Top Hedge For Yield
( KMLM ) tracks the No. 1 performing managed futures index of the last three decades.
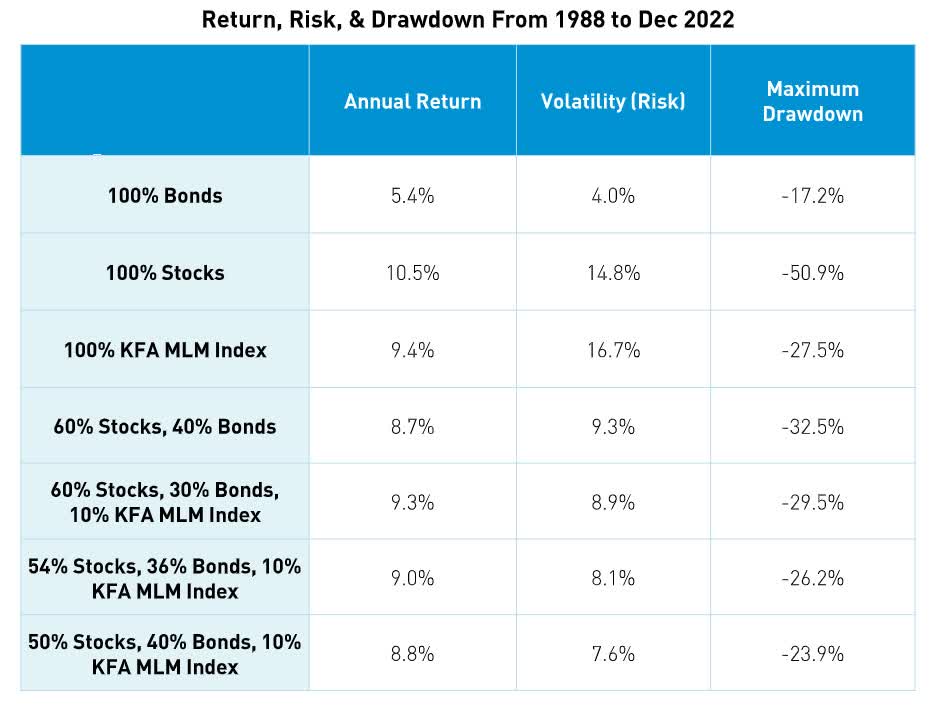
Krane Shares
The Mount Lucas managed futures index KMLM tracks has delivered 9.4% annual returns, which adjusting for its expense ratio, means 8.4% long-term returns are reasonable to expect.
And since managed futures funds tend to pay out profits as dividends, the long-term yield and total return potential is also 8.4%.
| Crisis Period |
| US Stocks |
| Bonds |
| Long Bonds |
| Cash |
| SG Trend Index |
| RSBT |
| DBMF |
| KMLM |
| December 2021 to September 2022 |
| -25% |
| -14.4% |
| -44.8% |
| 0.6% |
| 35.6% |
| 28.7% |
| 31.6% |
| 44.8% |
| January 2020 to March 2020 |
| -20% |
| -2.6% |
| 20.3% |
| 0.3% |
| 1.4% |
| 0.3% |
| -0.8% |
| 13.9% |
| October 2007 to February 2009 |
| -50% |
| 6.1% |
| 24.0% |
| 2.5% |
| 21.6% |
| 25.9% |
| 13.5% |
| 37.4% |
| August 2000 to December 2002 |
| -41% |
| 33.4% |
| 149.6% |
| 11.2% |
| 56.3% |
| 78.6% |
| 28.8% |
| 30.4% |
| Average |
| -34% |
| 5.6% |
| 37.3% |
| 3.6% |
| 28.7% |
| 33.4% |
| 18.3% |
| 31.6% |
(Sources: Krane Shares, Charlie Bilello, Soc Gen)
KMLM is almost as good a historical crisis hedge as RSBT, combining 100% managed futures + 50% cash and 50% bonds using leverage and options.
Putting It All Together
ZEUS Monthly Yield Vs. 60/40 Retirement Portfolio
| Metric |
| 60/40 |
| ZEUS Monthly Yield |
| X Better Than 60/40 |
| Yield |
| 2.2% |
| 7.5% |
| 3.41 |
| Growth Consensus |
| 5.1% |
| 1.8% |
| 0.35 |
| LT Consensus Total Return Potential |
| 7.3% |
| 9.3% |
| 1.27 |
| Risk-Adjusted Expected Return |
| 5.1% |
| 6.5% |
| 1.27 |
| Safe Withdrawal Rate (Risk And Inflation-Adjusted Expected Returns) |
| 2.8% |
| 4.2% |
| 1.49 |
| Conservative Time To Double (Years) |
| 25.4 |
| 17.0 |
| 1.49 |
(Source: FactSet Research)
More than triple the yield of a 60/40 with about 2% annual better return potential.. . and lower peak declines in bear markets.
Historical Returns Since 2007
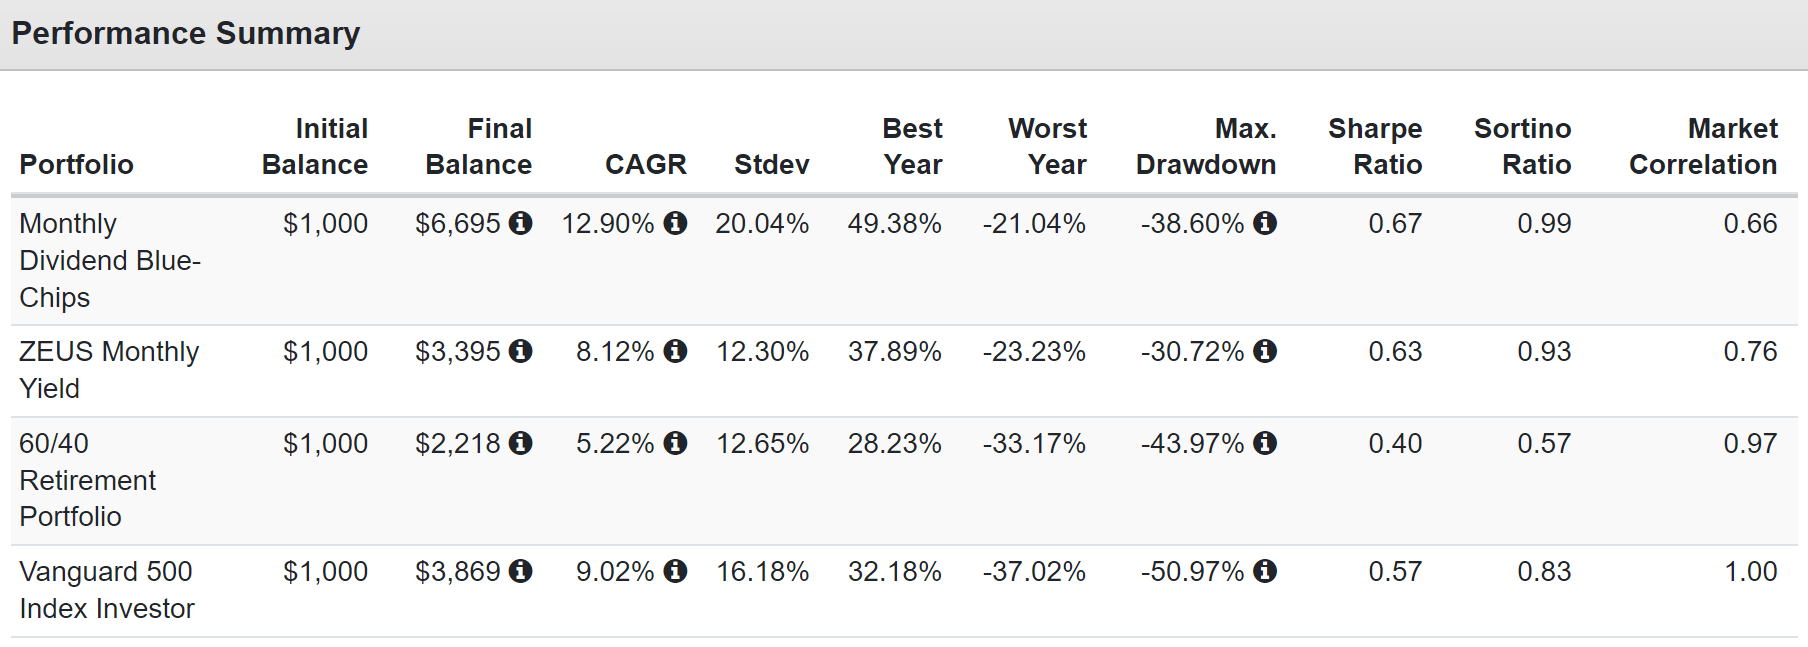
Portfolio Visualizer Premium
Beating the 60/40 by 3% per year, not 2%. And with equal long-term volatility but significantly smaller peak declines in the Great Recession.
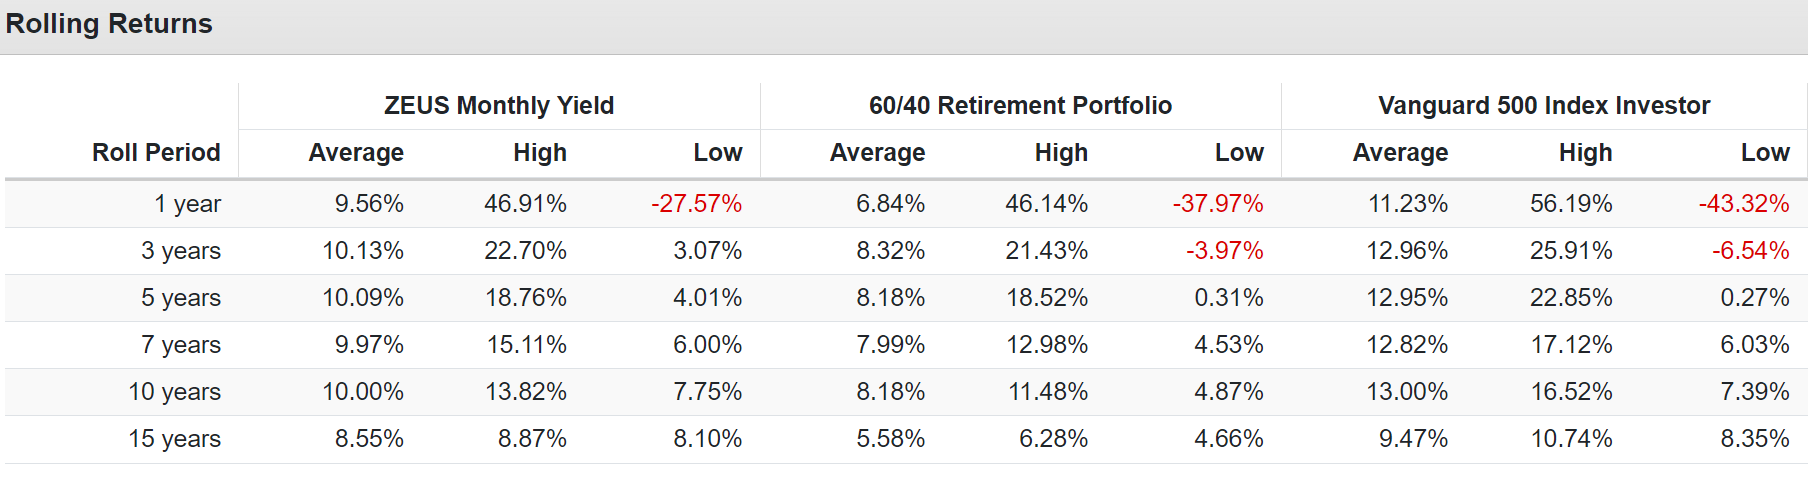
Portfolio Visualizer Premium
60/40 spanking returns just as is expected in the future. And far more stable monthly income.
Portfolio Visualizer Premium
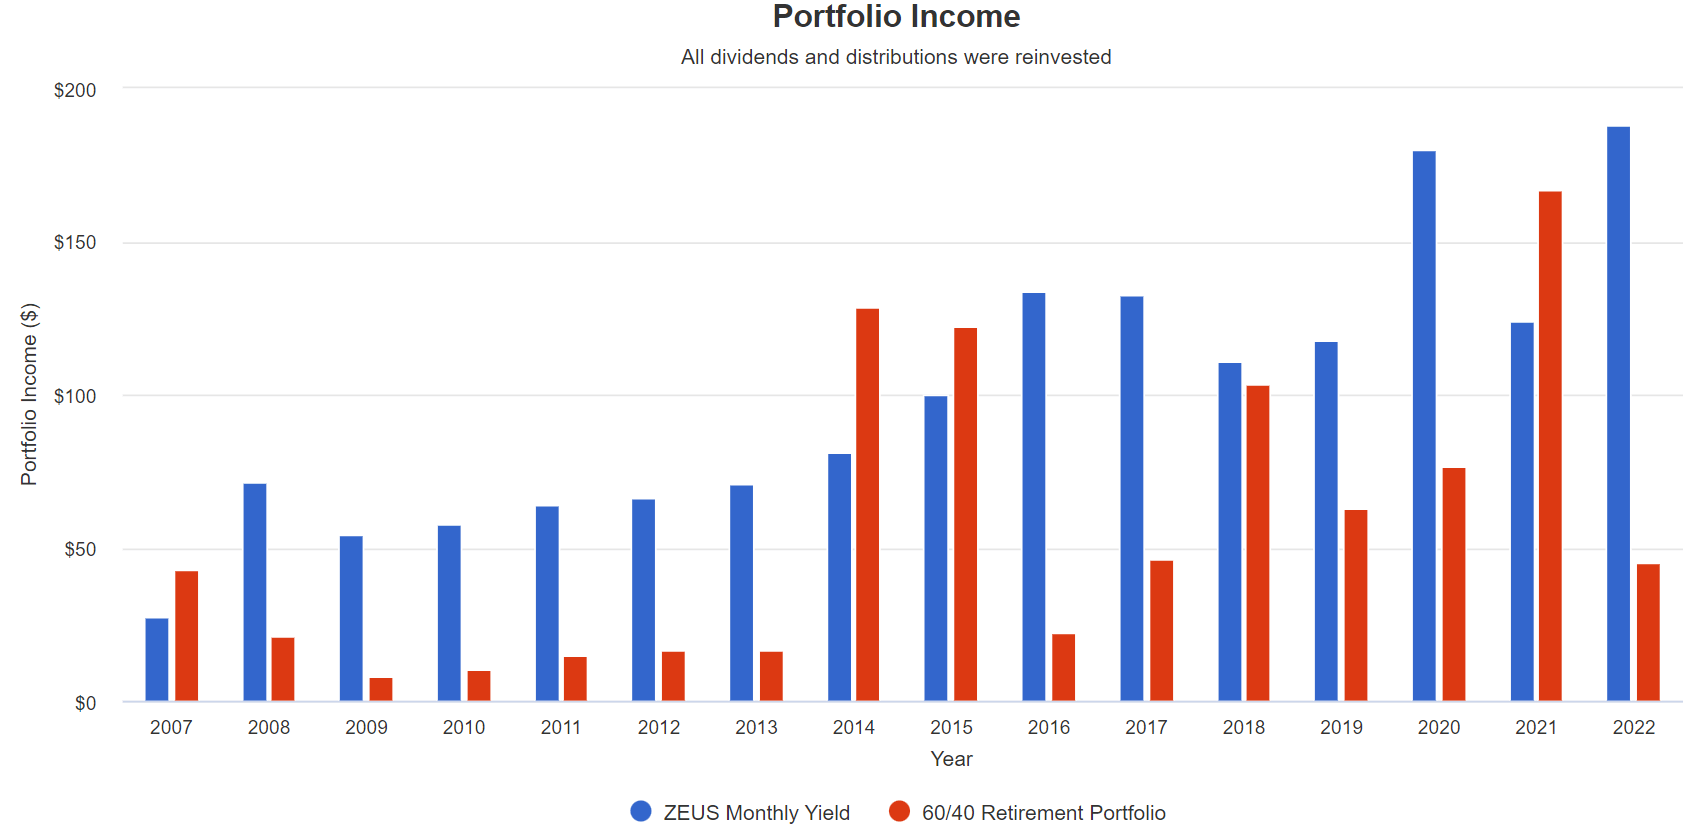
Income Growth Rates:
- ZEUS Monthly Yield: 7.2% annual
- 60/40: 5.6% annual growth
Higher yield, smoother income, and faster income growth. For anyone looking for monthly income, ZEUS Monthly Yield is far superior to a traditional retirement portfolio.
Sleeping Well At Night In All Economic And Market Conditions
So more than triple the yield of a 60/40, faster income growth, more dependable income, and now, finally, 30% smaller peak declines than a 60/40 in the average bear market. And half the peak declines of the S&P 500.
Peak Bear Market Declines
| Bear Market |
| ZEUS Monthly Yield |
| 60/40 |
| S&P |
| Nasdaq |
| 2022 Stagflation |
| -10% |
| -21% |
| -28% |
| -35% |
| Pandemic Crash |
| -19% |
| -13% |
| -34% |
| -13% |
| 2018 |
| -7% |
| -9% |
| -21% |
| -17% |
| 2011 |
| -7% |
| -16% |
| -22% |
| -11% |
| Great Recession |
| -31% |
| -44% |
| -58% |
| -59% |
| 2008 |
| -23% |
| -33% |
| -37% |
| -42% |
| Average |
| -16% |
| -23% |
| -33% |
| -30% |
| Median Decline |
| -15% |
| -19% |
| -31% |
| -26% |
(Source: Portfolio Visualizer)
Whether the economy is in total collapse or inflation is raging at the worst levels in 42 years, ZEUS Monthly Yield got the job done.
Great fundamentals, great income, and a much smoother ride than a 60/40 or the broader market.
Bottom Line: You Can Build Your Dream Portfolio In Any Market
The market is now 15% historically overvalued, and the Nasdaq is 35% historically overvalued.
And that's assuming we avoid recession.
Yet even in this overvalued market, you can still find great dividend blue-chips for any goal.
- Main Street Capital
- Realty Income
- Agree Realty
Fundamentals Summary
- Yield: 5.6%
- Quality Score: 88% (Super SWAN)
- Dividend Safety Score: 91% - very safe - 1.45% severe recession dividend cut risk
- Discount To Fair Value: 24% (Strong Buy)
- Growth Consensus: 5.6%
- Total Return Potential: 11.2%
Here are the safest monthly dividend payers, and if you combine them with the highest yielding safe monthly CEF, UTF, and the best performing and highest historical yielding managed futures ETF, KMLM, you can achieve the monthly portfolio of your dreams.
ZEUS Monthly Yield Vs. 60/40 Retirement Portfolio
| Metric |
| 60/40 |
| ZEUS Monthly Yield |
| X Better Than 60/40 |
| Yield |
| 2.2% |
| 7.5% |
| 3.41 |
| Growth Consensus |
| 5.1% |
| 1.8% |
| 0.35 |
| LT Consensus Total Return Potential |
| 7.3% |
| 9.3% |
| 1.27 |
| Risk-Adjusted Expected Return |
| 5.1% |
| 6.5% |
| 1.27 |
| Safe Withdrawal Rate (Risk And Inflation-Adjusted Expected Returns) |
| 2.8% |
| 4.2% |
| 1.49 |
| Conservative Time To Double (Years) |
| 25.4 |
| 17.0 |
| 1.49 |
(Source: FactSet Research)
Great yield, quality, income dependability, and peak declines are only half as bad as the S&P 500.
This is the power of the world's best monthly dividend blue chips, combined with world-beater monthly CEFs and prudent hedging.
You can have your cake and eat it if you combine the right blue-chip ingredients into the ultimate monthly-paying portfolio cake.
For further details see:
The Ultimate 7.5% Yielding Monthly Paying Retirement Portfolio