XOP - The Week On Wall Street - Pros And Cons
Summary
- Markets often turn well before the economy and we are starting to see Global PMIs stabilize.
- Like many other indicators, the market's "Pros and Cons" keep investors guessing.
- Investors are in the "glass half full" mindset. Negatives are placed on the back shelf now.
- Sentiment has changed, and the Bulls are now in control.
"It's obvious that we don't know one millionth of one percent about anything." - Thomas Edison
The Macro View
Now that January is winding down, it's time to review the pros and cons as we enter the next phase of Q1.
Positives
1. Peak Inflation
2. Dollar Weakness
3. Earnings
4. Bonds
5. Market Breadth
6. Global Markets
7. Political Cycle
8. Jobs
9. Seasonality
10. Buy and Hold (Always a Pro)
Peak Inflation
The list of indicators pointing to lower inflation is far exceeding the list of those continuing to show accelerating inflation. While CPI is just starting to roll over, the net number of commodities rising in price has plunged into negative territory.
Bespoke Investment group:
"Historically, when the net number of commodities rising in price has been negative, the average y/y reading in CPI six months later was just 0.8%."
This trend plays to the notion that inflation and associated Fed action will take a back seat as Q1 continues. Next up for investors to ponder, is how the economy will start to look in Q2 and beyond, as the Fed rate hikes start to make an impact.
A Weak Dollar
The march higher for the US Dollar went hand in hand with the downtrend in equity markets throughout the first three quarters of 2022. The buzzword on conference calls last year was "FX headwinds". The dollar's uptrend was broken in the middle of Q4, and it's now down ~7% since Q4 began. Short-term technicals are no longer bullish for the Dollar, which is a pro for US equities. Whereas FX was a headwind during Q3 earnings calls, it should be a tailwind when we start getting Q4 earnings reports.
Earnings
While there hasn't been a lot of good news to go around over the last couple of months, companies have quietly been beating estimates at a high clip. Since the earnings "off-season" began on 11/15, 271 companies have released quarterly numbers. 73% of them have beaten EPS estimates and 71% have beaten sales estimates. That's much higher than the 10-year average. Companies reporting have also been reacting positively when reporting earnings.
The start of "official" earnings season has just begun and while it is very early the initial reports are not aligned with that positive development. If this early trend continues, "earnings" will easily fall back into the list of market negatives.
Bonds Stabilizing
Last year's Bear market debacle was "one of a kind". Fixed income offered no support for investors when equity markets fell apart. The typical "60/40" allocation into stocks (60%) and bonds (40%) that millions of retirees are invested in taking a major hit. That in turn hurt investing sentiment. Over the last four months, we've seen bonds finally stabilize. To that end, the iShares Corporate Bond ETF ( LQD ) was part of my list of "favorites" for '23.
Breadth And Internals
While the long-term price chart for the S&P 500 is still in a downtrend, internals and breadth measures look quite a bit better than what's on the surface.
Breadth (bespokepremium.com)
"New highs" made a higher low in October and have trended higher ever since. High yield spreads are showing positive divergence with the S&P, and readings on the percentage of stocks above their 50- and 200-day moving averages are also healthy.
New Highs (bespokepremium.com)
The International Scene
There is life in international equities since the start of Q4 2022. That is occurring after underperforming US markets for over a decade. Several ETFs tracking the rest of the world ( CWI ), Europe ( FEZ ), emerging markets ( EEM ), and China ( MCHI ) have all broken above the top of downtrend channels recently, and technicals are starting to look more bullish. When I compare the relative strength line of the rest of the world versus the US, there is a notable breakout from its multi-year downtrend.
MSCI Emerging Markets Index is outperforming the S&P 500 over the last three months by nearly 20%. I believe the probability is high that this could be the start of a seismic shift in asset class performance in the equity space. International exposure is high on my list of potential 'outperformers' this year.
Political Cycle
Year two of the four-year Presidential Election cycle has historically been the worst for the S&P 500 going back to 1928. The administration's second year certainly followed the script, given the year we had in 2022. Year three of the Election cycle has historically been the best, however, with the S&P averaging a gain of 13.5% throughout history.
While the sample size is small, the current set-up in Washington with a Democratic President, Democratic Senate, and GOP House has historically been a good one for the stock market.
Goldilocks Jobs Scene
Bulls couldn't have asked for much more from the recent Non-Farm Payrolls report. While the headline reading came in better than expected for a record ninth straight month, the jobs market is hardly overheating. Monthly payroll growth has slowed, average hourly earnings were weaker than expected even after the last two months were revised lower, and average weekly hours came in lower than expected.
Seasonality
Seasonals will stay in the "Pro" column from now through April. There is little doubt since history shows the bulk of equity gains over time have come during the period from November through April. I'll side with history now and keep this in the PRO column with a caveat. While Seasonality would seem to be on the side of the BULLS, let me remind everyone that the Jan-April performance in '22 was a poor one with the S&P losing 13.8%.
Buy And Hold
We can always bring up "Buy and Hold" in our Pros section since equities have historically posted strong annualized returns regardless of short-term market volatility. Yes, the future is uncertain and past performance is no guarantee of future results but putting money to work in the stock market when prices have declined has always ultimately been the correct decision with a long enough time frame.
The S&P's median annualized return in the five years after the S&P has first entered correction territory is essentially the same as the 5-year annualized return over all periods. And remember, the longer your time frame, the higher the likelihood of positive returns. Anything can occur in the short term, but if you're betting the market won't be higher over TIME, it's a mistake.
Negatives
1. The Fed is still hawkish.
2. This is still a BEAR market.
3. Recession Looming
4. Yield Curve
5. Consumer Sentiment at lows
6. Housing
7. TAMRA
8. Mega-Cap Tech
Don't Fight The Fed
The Fed may be getting less hawkish as inflation cools, but it is still hawkish. Interest rates have risen at the fastest pace in over 40 years. The FOMC is projecting higher Fed Funds than the market currently prices over the next couple of years. With the Fed expecting rates over 5% at year-end, the market is pricing 50+ bps lower than that. That higher policy rate expectation is joined by a forecast for unemployment rates to rise over 1 percentage point over the year; that would be consistent with a recession, to say the least. The Fed's regional data (and plenty of other data) is showing inflation cooling quickly, but so far Powell and Co. are staying with the higher for longer stance.
Bear Markets
The S&P 500's bear market low of the current cycle came on October 12th with the index down 25.4% at that point over 282 days. That's less than the bear market average decline of 32% over 339 days. Until we see the long-term MONTHLY BEAR trend lines decisively broken , we're still in a bear market. That means until further notice the BEARS control the scene.
The S&P 500 would have to rally back up to the 4200 level (20 MONTH MA) to exit BEAR market territory. It will require a decisive MONTHLY close to accomplish that and then it will be incumbent for the Index to stay above that trendline. Friday's close at 4014 leaves the index approximately 5% from that goal. The part of this picture that concerns me the most is the declining nature of that MONTHLY trendline. It's rolling over and history has shown a "rejection" at this important PIVOT point leads to more downside. The most recent occurrence was in August of last year which led to a two-month 17% decline.
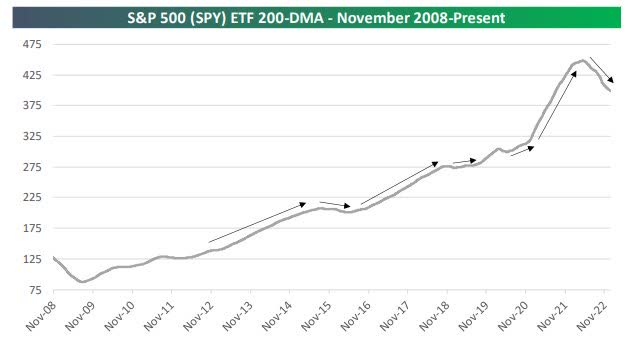
Another way to depict this 'concern' is shown in the chart below. Looking at just the S&P's smoothed-out 200-day moving average, which eliminates the day-to-day noise of the stock market, you can see that this trendline has rolled over sharply after an extreme move higher during the post-COVID rally.
S&P 200-day MA (bespokepremium.com)
It would not be surprising to see the 200-Day moving average continue to mean revert lower after seeing such a parabolic spike in late 2020 and 2021.
Recession Indicators
We've seen the economic data come in at very weak levels recently. There are also a variety of different indicators that tend to be correlated with recessions that are sending signals that a broad economic contraction is coming.
The ISM's Services Index recently unexpectedly plunged below 50. The only time that reading has been logged without a recession was in the aftermath of the 2001 recession when the US announced the invasion of Iraq. Leading indicators, which are a composite of various underlying series that tend to lead the economy, are down almost 5% Year over year. All previous declines of that magnitude since the 1950s have ended in recession. Similarly, the ratio of leading indicators to more lagging coincident indicators has collapsed in recent months. That too is a strong indicator of a looming recession.
Consensus forecasts are calling for a short, mild recession. The "other" side of that argument asks, what is going to change the data? Ask yourself are we in a pro or anti-business environment? Is this a period of more or less regulatory oversight? Is this backdrop one that is inclined to promote higher or lower taxes? Depending on what you believe, your answers to those and other related questions will help determine your view of the economy going forward and your investment strategy.
Yield Curve
Along with plenty of economic indicators flashing recession, the inverted yield curve is flashing one too. The 3-month/10-year yield curve - the one the Fed follows most closely - is inverted by more than 100 basis points. Since the 1960s, we've always had a recession after an inversion of this magnitude. One-year forward equity returns have historically been relatively weak when the curve has been this inverted as well.
Yield Curve (bespokepremium.com)
Unless this time is different, a recession is just about guaranteed. Typical BEAR market declines average about 35%, suggesting at some point the odds suggest lower lows for stocks.
C onsumer Sentiment
Sure there was been a modest rebound in December, but every consumer data point is at or near historic lows. Sentiment towards personal finances is working off a record low reached in November, and it remains well below the range of readings over the last decade. Meanwhile, just under half of respondents report living paycheck to paycheck, and spending expectations for discretionary items are at levels seen in the early days of the pandemic.
Housing
While mortgage rates are off their worst levels, home prices are still dropping for now. Transaction volumes have still not bottomed out, and the result is rapidly slowing housing investment. Single-family permits and starts have collapsed. The result is a brutal bear market for the housing sector. It will take some time for housing to return to a level to support the economy.
Similar to the "caveat" I applied to seasonality, the recent price action in the homebuilders gives me pause. That action suggests housing has bottomed and the next "change" is going to be a positive one. Therefore Housing can at the least become a "neutral" data point.
TAMRA - There Are Many Reasonable Alternatives
For years, the "TINA" trade (there is no alternative) made stocks attractive because there was simply nowhere to go with nonexistent yields that Treasuries and the broader fixed-income market offered. Two years ago at the end of 2020, the S&P 500's dividend yield was higher than every point on the Treasury curve from the 1-month T-Bill out to the 20-year bond. Only the 30-year offered a higher yield. Now, the S&P's dividend yield looks puny compared to yields above 4% for short-term Treasuries from the 1- month T-Bill out to the 3-year bond.
This factor will tend to keep any avalanche of money that is necessary to spark a raging BULL market well in check.
Mega Cap Tech Stocks
While mega-cap Tech stocks have already gotten crushed, their action remains weak and their technicals are negative. That's not bullish given how big of a weight they still carry in the S&P 500. Names like AAPL, AMZN, MSFT, etc. ran up so much over the last ten years that they still could fall quite a bit farther and still be above the levels they traded at just a few years ago. Every Mega Cap Tech stock is in a BEAR market trend.
Depending on your take on "valuations", these stocks are still selling at premium multiples. That takes us to what is always controversial and of course subject to change as corporate earnings are reported.
Valuations
In my view, this issue is in the NEUTRAL camp. Investors never really saw a capitulation that took valuations to severely depressed levels, but we have seen them drop to more reasonable levels. Many are going to argue that "price" has come down enough to place the S&P's valuation at 'attractive" levels. The argument is that a PE of ~16-17 it's commensurate with what we have seen in past market declines. The S&P sold at a PE of 14-16 in the market decline in 2014, 15, 18, and 2020.
However, there is a caveat. Except for the 2020 experience (caused by an exogenous "Health" Event), all of the prior incidents did not result in a BEAR market or a recession. We are in a BEAR market and if we believe the "indicators", we will be in a recession. That suggests earnings will go into recession and when "E" comes down so does "P". The typical PE when inflation hovers around ~7% is around 11-12. We have probably seen Peak inflation. Other factors come into play but if inflation sticks around at elevated levels, the market can no longer be called "fairly valued" in the current range.
It is early in this earnings season, but so far it is telling me, "Valuation" can easily fall back into the negative column.
The Week On Wall Street
The major US indices started the week following through on the recent rally that brought the indices closer to their mid-December highs. The S&P added another 1.1% during the session on Monday. The NASDAQ outperformed with a gain of slightly more than 2%. Technology ( XLK ) was the top-performing sector rising 2.2% and Communication Services was not far behind rising 1.7%. Those two beaten-down sectors are now leading stocks higher.
Monday's rally locked in back-to-back gains of 1%+ for the S&P 500 and back-to-back gains of 2%+ for the Nasdaq. The indices traded cautiously with a lean to the downside on Tuesday but the lean turned into a fall during initial trading on Wednesday. In another example of dips being bought all of the indices clawed their way back to a breakeven close.
That set the stage for a two-day end-of-week rally that kept this mini uptrend in place. It was the third week out of the last four where the S&P posted gains that now total ~6%. One week doesn't make a trend but how about four weeks? That is what the NASDAQ has done with four weekly gains in a row yielding ~11%. Sentiment has changed and right now the BULLS are in control.
The Economy
A tale of the past and the present.
GDP posted a better-than-expected 2.9% growth rate in the Advance Q4 report. It is slightly lower that the 3.2% clip in Q3. The economy contracted at a -0.6% pace in Q2 and -1.6% in Q1.
The leading index fell another 1.0% to 110.5 in December, a larger slump than expected, following the 1.1% drop to 111.6 (was 113.5) in November and the 1.0% decline to 112.8 in October. This is the 10th straight monthly slide with the index falling every month in 2022 except February. It is the longest string of drops since the 22 consecutive months in the 2007-08 recession. It is the biggest decline since April 2020 and is now at the lowest index level since November 2020.
LEI (bespokepremium.com)
Most of the components declined, led by ISM New Orders (-0.23%) and consumer expectations (-0.19%). The only increases out of the 10 components were nondefense capital goods orders excluding aircraft (0.02%) and consumer goods orders (0.01%).
Private sector contraction in the US continues into the new year, with evidence that the poor data is stabilizing.
US PMI Composite Output Index at 46.6 (December: 45.0). 3-month high. Services Business Activity Index at 46.6 (December: 44.7). 3-month high. Manufacturing Output Index at 46.7 (December: 46.2). 2-month high.
Manufacturing PMI at 46.8 (December: 46.2). 2-month high.
US PMI (pmi.spglobal.com)
The Chicago Fed National Activity Index edged up to -0.49 in December of 2022 from -0.51 in November, indicating a softer economic contraction in the US economic activity.
CFNAI (chicagofed.org)
Consumer
The final Michigan sentiment report revealed a headline climb to an upwardly-revised 9-month high of 64.9 in January from 59.7, versus a 4-month low of 56.8 in November. Michigan sentiment still sits below the early pandemic bottom of 71.8 in April 2020.
Analysts have seen a confidence updraft since mid-2022, though all of the measures have deteriorated sharply from mid-2021 peaks, and Michigan sentiment is fluctuating around remarkably weak levels. The surveys face headwinds from the mortgage rate surge through October, before the ensuing pull-back, and mounting recession fears.
Housing
New home sales in the US increased 2.3% month-over-month to a seasonally adjusted annualized rate of 616K in December of 2022, the highest value in four months, compared to market forecasts of 617K. The sales rate remains above the 6-year low rate of 543k in July. The median price of new houses sold was $442,100 while the average sales price was $528,400.
Pending Home Sales improved for the first time since last May indicating that the worst could be in the rearview mirror. The PHS index improved by 2.5% to 76.9 in December. Year-over-year, pending transactions dropped by 33.8%. An index of 100 is equal to the level of contract activity in 2001. NAR Chief Economist Lawrence Yun;
"This recent low point in home sales activity is likely over. Mortgage rates are the dominant factor driving home sales, and recent declines in rates are clearly helping to stabilize the market."
Housing stocks ( XHB ) were already signaling a bottom and it appears the data is starting to confirm that.
Inflation
The better news is also seen on the inflation front. It is stabilizing.
U.S. personal income rose 0.2% and spending declined 0.2% in December. The December income print tied April for the smallest increase since January. The decline in December spending equaled December 2021 for the largest decline.
Wage and salary income also increased by 0.3% after November's 0.3% gain. The savings rate jumped to a 3.4% clip from 2.9% and has dwindled from 7.5% last December.
The PCE deflator was up 0.1% last month from 0.1% in November. Those were the smallest gains since last July. The core rate increased by 0.3% from the prior 0.2% gain. On a 12-month basis, the deflator slowed to 5.0% y/y from 5.5% y/y. The core rate decelerated to 4.4% y/y from 4.7% y/y.
The Global Scene
The UK data shows the sharpest drop in business activity in two years.
PMI Composite Output Index at 47.8 (Dec: 49.0). 24-month low.
Services PMI Business Activity Index at 48.0 (Dec: 49.9). 24-month low.
Manufacturing Output Index at 46.6 (Dec: 44.4). 6-month high.
Manufacturing PMI at 46.7 (Dec: 45.3). 4-month high.
The Eurozone
Sees a move back into growth at the start of 2023.
PMI Composite Output Index at 50.2 (Dec: 49.3). 7-month high. Services PMI Activity Index(2) at 50.7 (Dec: 49.8). 6-month high.
Manufacturing Output Index at 49.0 (Dec: 47.8). 7-month high.
Manufacturing PMI at 48.8 (Dec: 47.8). 5-month high.
This is the "change" the EU stock markets sniffed out sending their indices to start the year in rally mode. An example of markets turning before the economy. Now the markets will be determining if this change has staying power.
Japan
A return to growth;
au Jibun Bank Flash Japan Composite PMI Index , January: 50.8 (December Final: 49.7)
Services Business Activity Index, January: 52.4 (December Final: 51.1)
Manufacturing Output Index, January: 47.1 (December Final: 46.6)
Political Event
A "Wild Card" that may have an impact on the markets. I'm not going to spend a lot of time on "specifics" other than to say we've been down this road before with Congress. The 2011 crisis resulted in a credit downgrade and the debt ceiling debacle contributed to the Dow Jones Industrial Average falling 2,000 points in late July and August.
The US government hit the debt limit on January 19th, triggering the Treasury Department's use of "extraordinary measures" to pay debt obligations on time through the X-date. Markets are watching with heightened concern given the high likelihood of brinkmanship around the debt limit debate, especially considering the aims of House GOP members to pair any debt ceiling raises with significant spending and entitlement reductions that are likely to be rejected by Senate Democrats and the Biden administration.
The timing of the X-date-when the Treasury will exhaust the "extraordinary measures"-is uncertain, but signs point to it hitting as soon as early summer. To be clear, I do not believe the U.S. government will default on its debt obligations. The public nature of the conflict may make it appear the situation is direr than in other years, and that can roil markets. It's more political nonsense, but at the end of the day, it will get resolved. Anyone citing specific data as to what a US default will mean is simply grandstanding and making irresponsible claims.
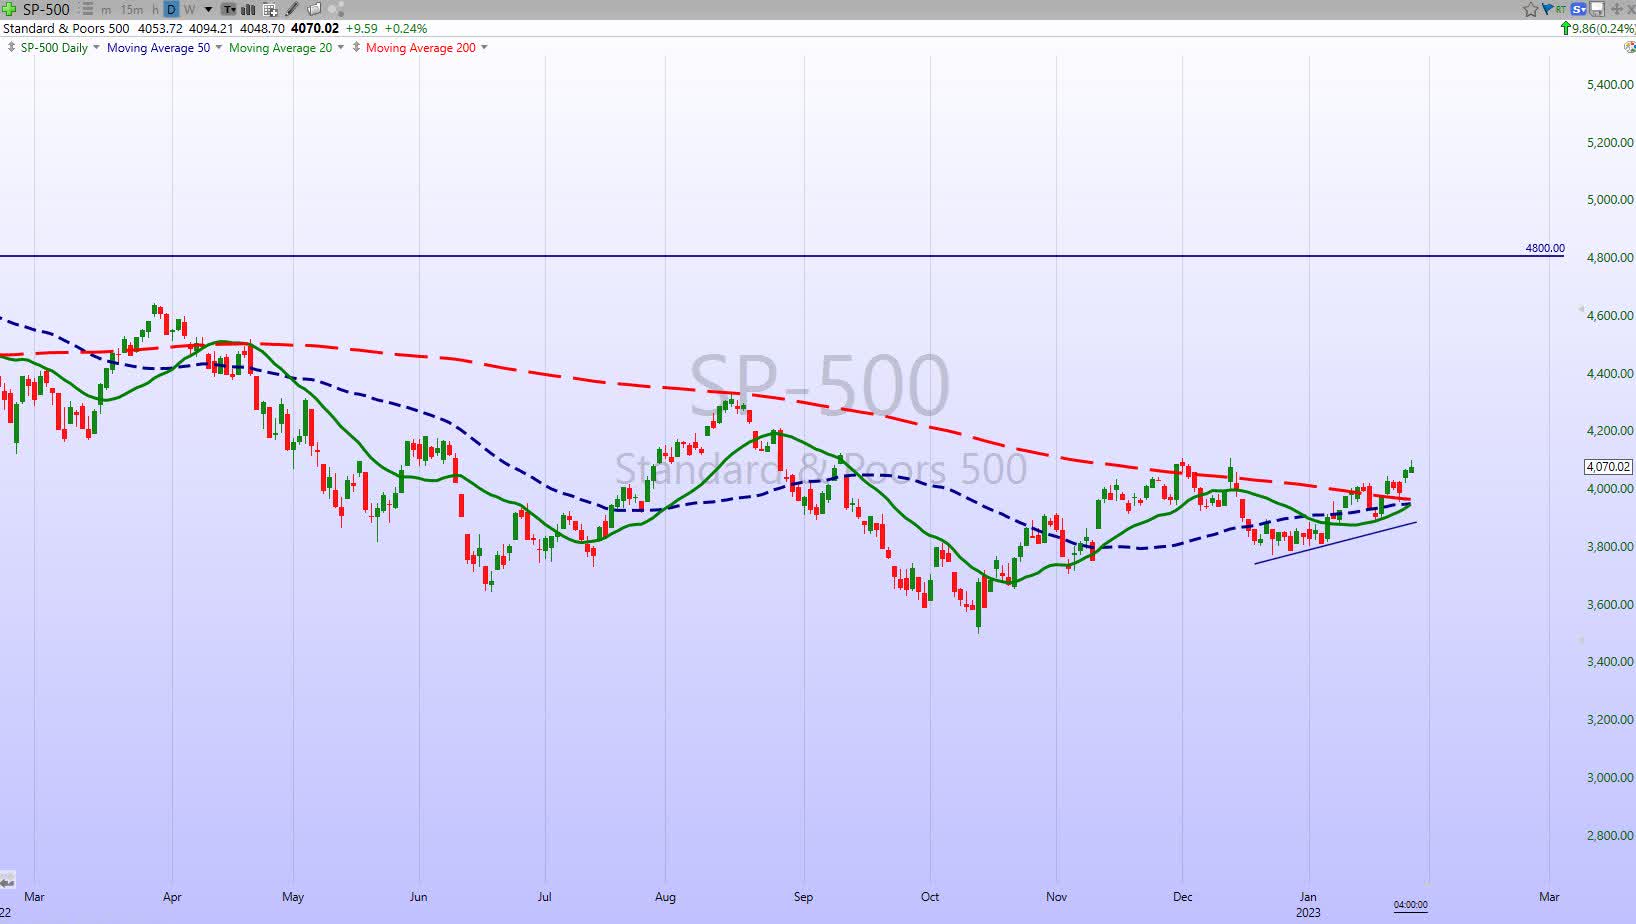
The Daily Chart of the S&P 500 ( SPY )
We now can see a decisive break and close above the 200-day moving average in the DAILY chart, and so far that move has held. The index has set sail for the 4100 level, and if successful can take a shot at the next hurdle. The 4200-4300 resistance range. Late-day profit-taking left the S&P 500 at 4070 at the close on Friday.
There is plenty of resistance overhead, but as the chart shows, there is also plenty of near-term support as well. The battle lines have been drawn, and it could come down to how long the glass-half-full mentality stays around.
Investment Backdrop
Long-time followers of my ramblings know that I am a firm believer in following the "trend". It sure sounds easy but it is not as black and white as it initially appears. The "trend" is in the eye of the beholder based on which timeframe the beholder happens to be watching at any point in time. That leaves plenty of room for debate and individual interpretation. A trader can find a BULL market within the context of a BEAR market. It also sometimes allows us to simultaneously hold contrasting viewpoints across different time horizons. For instance, I still have my concerns about the stock market in the bigger picture, but at the moment enjoying a BULL trend in select areas of the market.
When the broad market remained in a downtrend during 2022, with only Energy and Healthcare, defying that trend, there was no way I was going to step out and start recommending buying across the board. There remains a reasonable chance we could see further downside events in the months and years ahead. However, followers also know I don't deal in "years ahead" forecasting. I recognize that there will also be periods when stocks perform well and make large enough upside moves to justify taking more risks. In other words, there will be times when the trend is "up" on shorter time frames, even if it's taking place within a broader downtrend.
We've sure seen that recently, and there is enough evidence presented to start adopting that mindset. The stock market reacts to change and I always want to be able to identify if conditions are getting better or worse. It doesn't matter how bad the situation looks today. The question is does it look like it can get better?
So that leaves investors with the task of weighing ALL of the indicators to try and piece together a plan. Black and White appear on a chessboard but rarely do they appear in the stock market. This stock market still presents a challenge.
The 2023 Playbook is All About Stocks in or About to Enter BULLISH Uptrends.
Sectors
Consumer Discretionary
The first shall be last and the last shall be first. Well, something like that is occurring in the stock market this year. At 18 trading days into the new year, Communication Services ( XLC ) is currently the best-performing sector YTD with a gain of 14.6%. From a technical viewpoint, the sector is easily the farthest above its 50-Day moving average of any sector, propelled last week by big moves higher in names like Netflix (NFLX) and Alphabet (GOOGL).
Remember, Communication Services was the worst-performing sector of 2022 with a decline of more than 37% . It's not just the mega-caps driving Communication Services higher either. 84% of stocks in the sector are currently above their 50-Day moving averages; the highest reading for any sector. It is apparent there is some bottom fishing this year in last year's hardest-hit areas of the market.
Energy
As WTI remains around $80, the energy sector ( XLE ) is taking another run at the old highs. In the meantime, the Oil explorers ( XOP ) continue to consolidate, while the Oil Services group ( IEZ ) is at new highs.
Pick your entry points carefully, but by all means, stay invested in Energy ETFs and/or individual stocks. This sector remains in a strong BULLISH pattern.
Natural Gas
I noted that the Nat Gas ( UNG ) situation was looking dire. Nothing has changed that outlook. The downtrend continues. Nat Gas prices are hovering around $3.35 and as mentioned last week, I don't see much support until the $2.50 range. Support either shows up around these levels or we could see Nat Gas continue its slide.
I continue to hold my UNG position (It is a long-term HOLD) and continue to sell upside calls to buffer the losses.
Financials
The financials ( XLF ) is following the general market lately or as some might be inclined to say, it's leading this market. Investors saw a failure at resistance followed by a strong bounce. The near-term moving averages are sloping upwards and if "price" can ride that above the November highs it will go a long way in keeping the near-term BULL case alive. The ETF closed right at the November high at $36.27. Next week could be an important one for the sector.
Commodities
Here is a sector ( DBC ) of the market that is in a sideways pattern within the context of a BULL market. I view this situation as a consolidation period after the large rally in 2022. That suggests a lean toward a Bullish resolution of this pattern that results in another leg higher.
Healthcare
The Healthcare ETF ( XLV ) was an outperformer last year but starts 2023 was the only sector posting a loss (-2,2%). My outlook for the group remains positive, and this will be an area of opportunity during times of weakness.
Biotech - Sub-Sector
Last week I mentioned that the Biotech ETF ( XBI ) looked coiled and ready to break out. That has occurred and what I am looking for now is a follow-through. XBI was a big winner last year and I continue to believe there are more gains ahead.
Gold
My entry into the Gold sector via the gold miner ETF ( GDX ) continues to work out. Technically the ETF is in a typical "saucer" pattern that often accompanies a BEAR to BULL transition. Longer term charts of ( GDX ) and ( GLD ) have both bounced back into BULL market mode. The longer they stay at these levels the more credence that this BULL market is indeed genuine. There is resistance around the $33 level for GDX, so I wouldn't be surprised to see a pullback before the rally continues. Dips are for BUYING.
Silver
The silver ( SLV ) rally has stalled and gone sideways. Like Gold, a pullback wouldn't be out of the norm. Unless we get a complete reversal (unlikely), here is another situation where the BULL market may have just begun.
Uranium
The short-term view indicates a breakout of the near-term trend. But the more important news is; Uranium ( URNM ) ($35.62) ( URA ) has joined the other metals in what is also a "new" BULL market trend. All three of these emerging BULL trends in the metals could develop into big winners in '23.
Technology
The NASDAQ has come out of the gate strong to start the year by leading all of the major indices with an 8.5% gain. However, looking at the one-year charts of the "big Tech" mega-caps, bulls still have A LOT of work to do even after the bounce we've seen to start the year.
- Apple (AAPL) made a lower low to start the year and has yet to make a higher high.
- Amazon (AMZN) also remains in a steep long-term downtrend and is well below its 200-Day MA.
- Alphabet (GOOGL) made a higher low when it bottomed in early January, but it has yet to make a higher high or move above the top of its long-term downtrend channel.
- Tesla (TSLA) has rallied ~60% off its low but remains down more than 40% since mid-September.
- Meta (META) is the only stock below that has managed to break above its one-year downtrend after getting bombed out last October/November.
- Microsoft (MSFT) remains in a long-term downtrend even though it did make a higher low a few weeks ago.
Semiconductors Sub-Sector
The Bulls continue to watch the semiconductors for clues. They want to see this group ( SOXX ) once again lead any rallies. Semiconductors have significantly outperformed the S&P 500 since the start of the year with a 17% gain in January. In the process, the relative strength line of the group has broken out above its 200 Day moving average as well as its range from late 2022.
Semiconductors tend to be a leading indicator for the broader market, so which way this relationship moves will be a key determinant of where the markets go in the remainder of Q1. This is my "go-to" indicator to measure the health of the overall market.
ARK Innovation ETF ( ARKK )
So where are we now when we look to the 'speculative' areas of the market? The Ark Innovation ETF ( ARKK ) has behaved like the general market with conflicting signals and volatility that shakes out both BULL and BEAR traders.
It looked like the beginning of the next leg down when the long-term support line that goes back to 2018 at the $34 range was broken. That shook out a lot of the BULLS. A quick retake of that level then took the BEARS that loaded up on the short side for a "losing" ride.
Bottom line; Besides the double-digit rips and dips in between, the ETF has gone nowhere since May of '22. So the "case for a base" is back on the scene, and those with a LONG TERM time horizon can consider a position in this HIGH growth area of the market.
International Markets
I've posted charts and data since the year began that were depicting a "change" in the global investment scene. The STOXX 600 was up 6.4% YTD in the first 15 trading days of 2023. That is a RARE occurrence, and it's even more startling considering this global economy's backdrop. Going back to 1987, that ranks as the best performance through the first 15 trading days of a year and just the fifth year with a YTD gain of 5%+.
The EU has seen nothing but subdued returns since the post-financial crisis period. From 1987 through the end of 2009, the STOXX 600's median annual return was a gain of 12.8%. From 2010 through the end of 2022, though, the median annual gain was just 6.8%.
Bespoke Investment Group:
As recently as late August, the European 350 ETF ( IEV ) was underperforming SPY by one of its widest margins on record and the most since the European debt crisis. Since those recent extremes, though, we've seen a complete reversal. In the last three months, IEV has outperformed SPY by a record margin of more than 19 %. In the short-term, European stocks have been on a tear, so they're probably due for a breather."
After a lost decade, at least on a relative basis, are European stocks in the early stages of a new era? That begs the question - are those markets proclaiming an end to their bear markets because their economies are going to rebound?
This move can be related to China becoming the ONLY economy that will produce any sign of growth in the next couple of years - growth that will drag the EU and other economies dependent on China with it
It may not be a popular stance, but I am a firm believer that China is a big winner in the "new era/new green deal" - Think about it-- the US and the EU are going to SPEND trillions going green, that is correct TRILLIONS -and China has all the green marbles. So while many vilify China for the way they operate, the same people will be paying them to continue on their path.
Whether or not an investor wants to embrace any of these international markets and take a position is their decision. Full Disclosure; I do have China-related ( ASHR ) ( FXI ) and ( KWEB ) investments. I was short the EU by owning a position in ( EPV ). After giving this some thought, I won't dispute the price action seen in the EU indices, so the "short" position was closed out for a loss.
Cryptocurrency
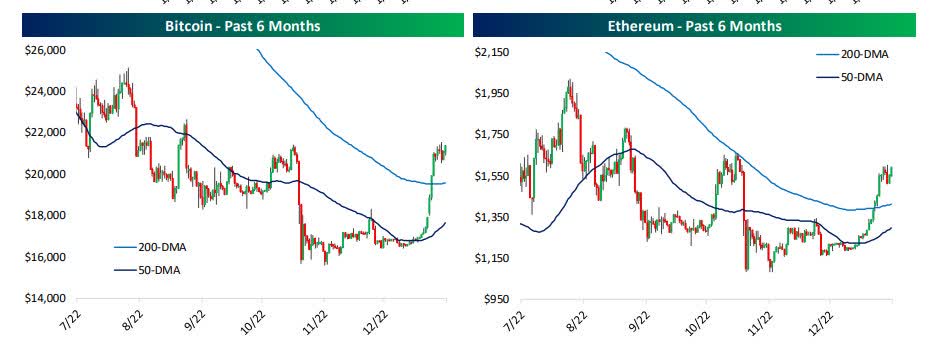
After choppy action earlier in the week, big gains for Bitcoin on Friday reconfirmed its recent really as it's now at the highest level on a closing basis since September. Given the rally, prices remain overbought to an extreme degree with Bitcoin currently 2.5 standard deviations above its 50-Day moving average. Overbought conditions have historically been followed by more momentum to the upside for Bitcoin, which isn't normally what you see when the price gets overbought.
Given the two largest cryptos (Bitcoin and Ethereum) are much more overbought, the relative strength of the two has risen versus the rest of the crypto market.
Bitcoin/Ethereum (bespoepremuim.com)
Final Thoughts
Thomas Edison had it right, and we see examples of that played out in our everyday lives. Market participants will have to continue their search for answers as the year unfolds. Conflicting data, and opinions that range from doom to euphoria will continue to bewilder investors.
Investors are looking at the present situation with a glass-half-full mentality. A case can be made for that in the short term, but unfortunately, a case can be made that view contains a lot of wishful thinking. For those that call that a noncommittal, wishy-washy forecast, you are correct, it is.
Anyone that wants to declare they know where this stock market is going in the next couple of months or so with all of the uncertainty surrounding the scene is merely "guessing". My stock market outlook is based on data and factual information. That is sprinkled with a common sense approach that analyzes the "background" we are working with. These background issues always have an enormous impact on the investment scene.
" Truth is an unpopular subject BECAUSE it is unquestionably correct."
Avoiding and dismissing FACT (Truth) will always lead to poor results in any endeavor.
THANKS to all of the readers that contribute to this forum to make these articles a better experience for everyone.
Best of Luck to Everyone!
For further details see:
The Week On Wall Street - Pros And Cons