VTI - The Weekend Sentiment Review - Bulls Still Rule
2023-06-11 23:27:23 ET
Summary
- As the rally continues investor sentiment is turning more bullish but it is not yet at concerning levels. The indication is the rally will continue.
- The long term Master Sentiment Indicator (MSI) is neutral and indicating a continuation of the current market rally.
- Short-term MSI is more bullish than the long-term MSI, but still far from the red zone, also suggesting a continuation of the bullish trend.
Summary
As the rally continues investor sentiment is turning more bullish but it is nowhere near levels that cause concern. The upward bull trend is intact.
The Sentiment King focuses completely on market sentiment and on metrics that measure group thinking and group activity. No other economic indicator correlates better with locating market tops and bottoms than investor sentiment.
The Weekly Sentiment Survey is done on Sunday and is a summary of the current state of investor sentiment.
The MSI and ST-MSI
At the Sentiment King we keep two master sentiment indicators, one long term and one shorter term. Each is a composite indicator made by combining different sentiment indicators into one. The master sentiment indicator ((MSI)) is composed of nine indicators and is updated weekly. The short term master sentiment (ST-MSI), is updated daily and composed of seven indicators.
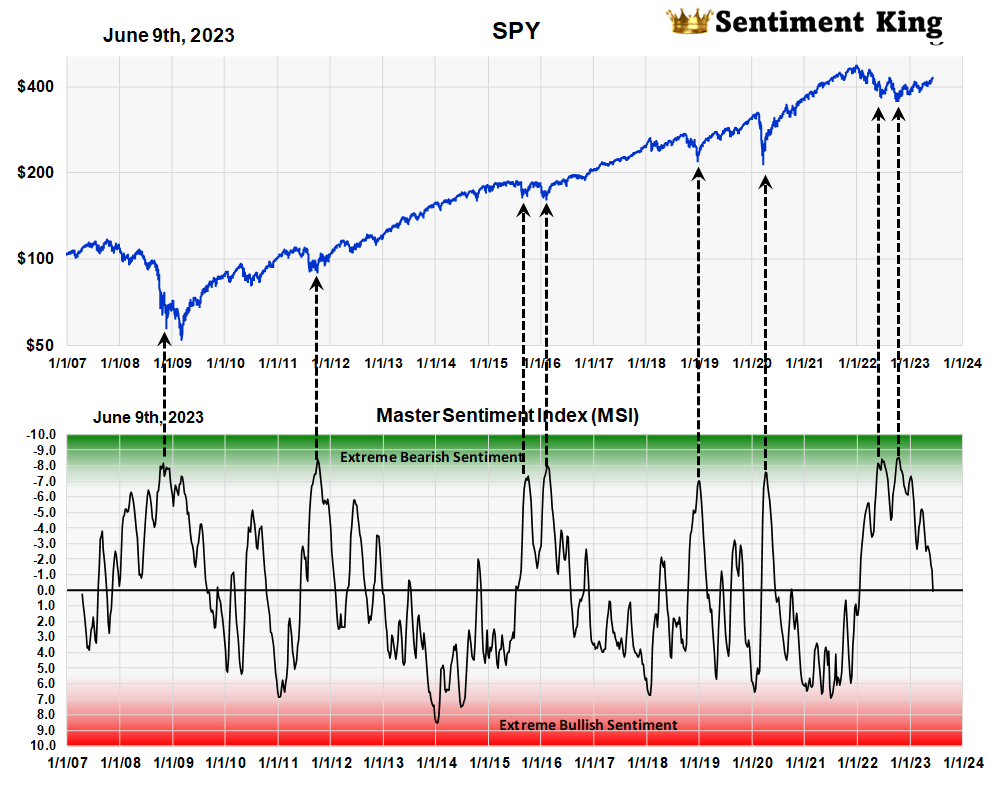
We'll first look at the Long term MSI.
The Master Sentiment Indicator (Sentiment King)
This current market advance started in October and after 7.75 months investor sentiment is just now reaching neutral (zero) on MSI bullish bearish scale.
Even though numerous people have now officially declared it a new bull market, there is a reluctance amongst many investors to agree. This is good for a continuation of the rally. From a sentiment point of view, investors shouldn't worry about a reversal in the bullish trend until the MSI enters the red zone.
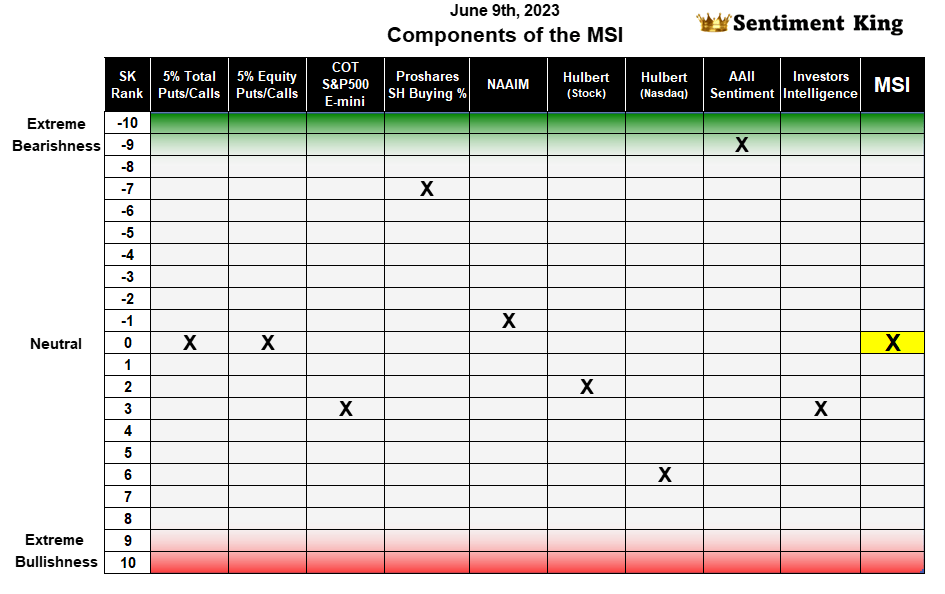
We'll review the current reading of the nine indicators that make up the MSI. They're contained in the table below.
Master Sentiment Indicator Table (Sentiment King)
Total Puts and Calls Ratio - Our time weighted moving average of the ratio of "puts to calls" of all CBOE options is .94. This ratio is right in the middle of historic norms and is completely neutral.
Equity Puts to Calls Ratio - The time weighted moving average of the ratio of equity "puts to calls" is .63. It too is right in the middle of its historic norms and is completely neutral.
S&P 500 E-mini COT - Asset managers of E-mini S&P futures are doing less shorting, which shows growing optimism. It's currently at 26%. This indicator has a ways to go and would enter its red zone if it reached 20%.
ProShares S&P 500 short fund ( SH ) – Purchase levels of this short fund have been declining but at 12% of assets it’s still near the green zone representing bearishness.
NAAIM Exposure Index - While the exposure index jumped to 90 last week, our moving average of this metric puts it in the middle of historic norms and it's therefore neutral.
Hulbert Stock Survey - Our moving average of the Hulbert stock market survey puts it just to the bullish side of neutral.
Hulbert Nasdaq Survey - Our moving average of the Hulbert Nasdaq survey indicates a little more bullishness as you can see from the table. This is to be expected with the strong NASDAQ rally but its not yet worrisome.
The AAII Member Sentiment Survey - Our long term moving average of the AAII survey still shows it near the green zone of extreme bearishness, but it should start to swing more toward a neutral reading.
Investors Intelligence Advisors Sentiment - This granddaddy of all sentiment indicators shows that 51.3% of advisors were bullish last week. This is the highest number in over a year. As you can see from the table, it puts our moving average of this metric on the bullish side of neutral.
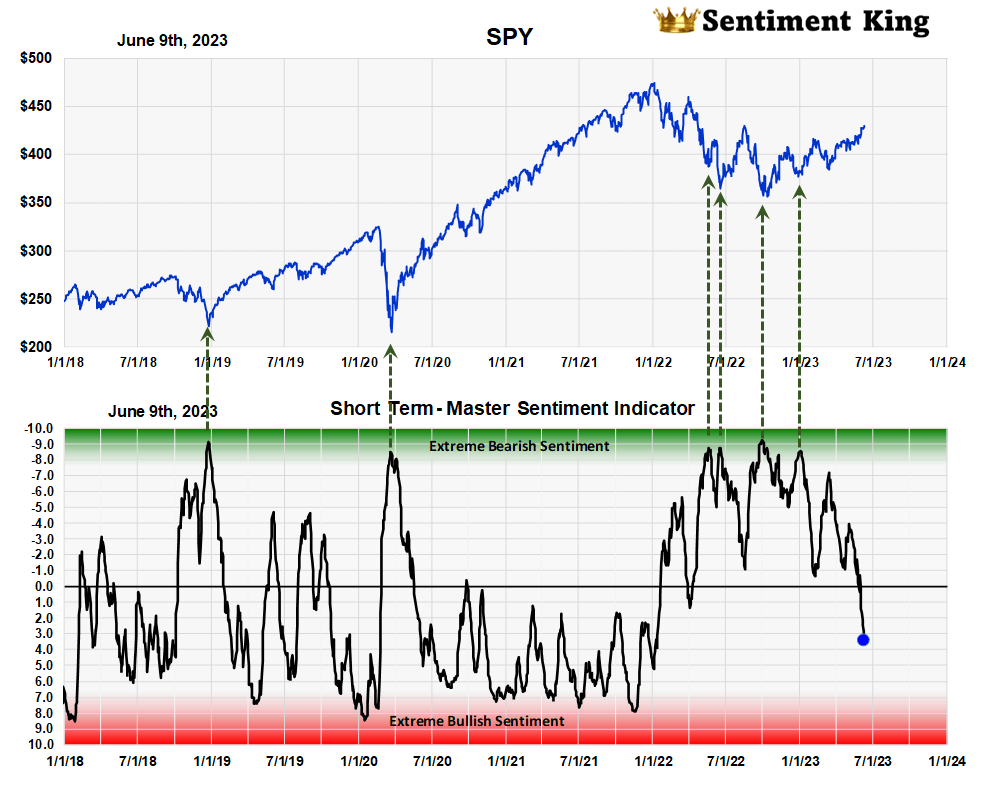
The ST-MSI
The chart below is a graph of the short term master sentiment indicator (ST-MSI), which is made from seven sentiment indicators. It measures and responds to shorter term changes in investor sentiment.
As you can see from the chart it's more bullish than the long term MSI but it's still a long way from the red zone. It too is indicating a continuation of the bullish trend.
The Short Term Master Sentiment Indicator (Sentiment king)
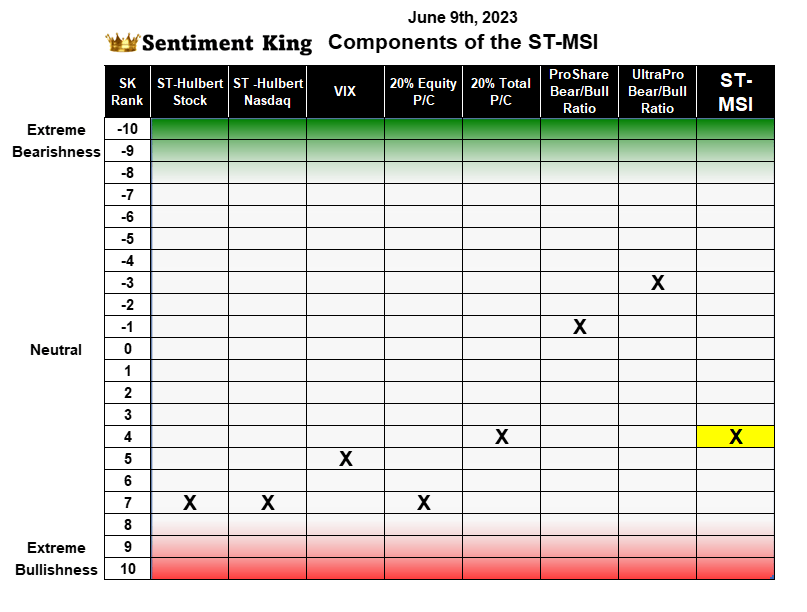
Let's look at each one of the seven components that make up the ST-MSI and see where they stand.
The ST-MSI Indicator Table (Sentiment King)
Hulbert Stock Survey - Our short term moving average of the Hulbert stock market survey puts it much closer to the red zone. Our moving average shows 55% of advisors are bullish on stocks.
Hulbert Nasdaq Survey - Our short term moving average of the Hulbert Nasdaq survey indicates it's also close to the red zone. Our moving average metric shows 65% of advisors are bullish on Nasdaq stocks.
VIX – Our measurement of the VIX shows it's below 70% of its historic range, which gives it a five ranking on the Sentiment King ranking scale. We've indicated that on the table.
Equity Puts to Calls Ratio – Our short term moving average of the ratio of equity puts to calls is .57. That puts it in the lowest 20% of historic ratios and a few numbers away from the extreme bullish rankings.
Total Puts and Calls Ratio - Our short term moving average of the ratio of all puts to calls on the CBOE is .89. That puts it in the lowest 35% of historic ratios and, as you can see from the table, on the bullish side of neutral.
ProShares Bear/Bull Ratio - Our ratio of the money going into bear funds versus bull funds in the ProShares fund family is 88%. Historically, this still indicates a little too much buying of bear funds and puts the indicator just to the bear side of neutral, as the table shows.
ProShares Ultra Pro Bear/Bull Ratio - Our ratio of the money going into Ultra Pro bear funds versus Ultra Pro bull funds is currently 72%. This still indicates a too much buying of leveraged bear funds and puts the indicator more to the bear side of neutral.
Conclusion
Overall, the combination of all the market sentiment indicators we follow points to continuing higher prices. In our opinion there is simply not enough bullishness and still too much bearishness to become worried about this market.
For further details see:
The Weekend Sentiment Review - Bulls Still Rule