DIA - The White House Fed Inflation And Flow Of Funds For February 2023
Summary
- The private domestic sector balance decreased by -$52+ billion in January 2023.
- Bank credit retraction was -$41+ billion as more loans were repaid or written off than were created.
- The seasonal pattern is downwards now into March 2023 and probably into Xmas 2023 as well. Crowned with a Fed-induced recession.
- The external sector has reversed direction and is in decline and this adds to the private-domestic sector balance.
- The Fed's demand destruction policy has baked a recession into the economic pie for the end of this year or the beginning of next.
The purpose of this article is to examine the USA sectoral flows for January 2023 and assess the likely impact on markets as we advance into February 2023. This is pertinent, as a change in the fiscal flow rate has an approximately one-month-lagged effect on asset markets and is a useful investment forecasting tool. Other macro-fiscal flows can point to events months or years ahead.
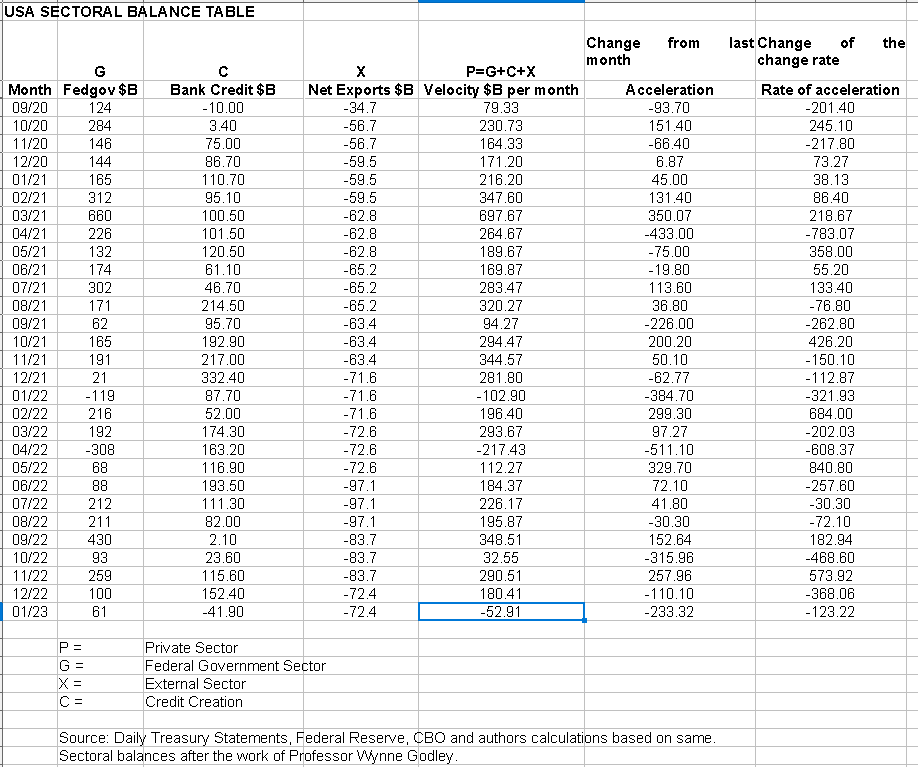
The table below shows the sectoral balances for the USA and is produced from the national accounts.
US Treasury and author calculations
In January 2023 the domestic private sector recorded one of its rare negative balances meaning that financial balances in the private sector declined overall which is very negative for asset markets.
From the table, one can see that the -$52+ billion private sector extraction of funds came from a $61+ billion injection of funds from the federal government [and this includes the new injection channel from the Fed of around $20B from interest on reserves that is discussed in more detail below], plus a -$41+ billion of credit retraction from commercial banks [IE more loans were repaid or written off than were created] and less the -$72B+ billion that flowed out of the private domestic sector and into foreign bank accounts at the Fed in return for imported goods and services. The fiscal acceleration and rate of acceleration numbers are negative because this month's number is less than last month's number and represent therefore a weakening of overall financial system liquidity flows and point to weaker asset market outcomes in February.
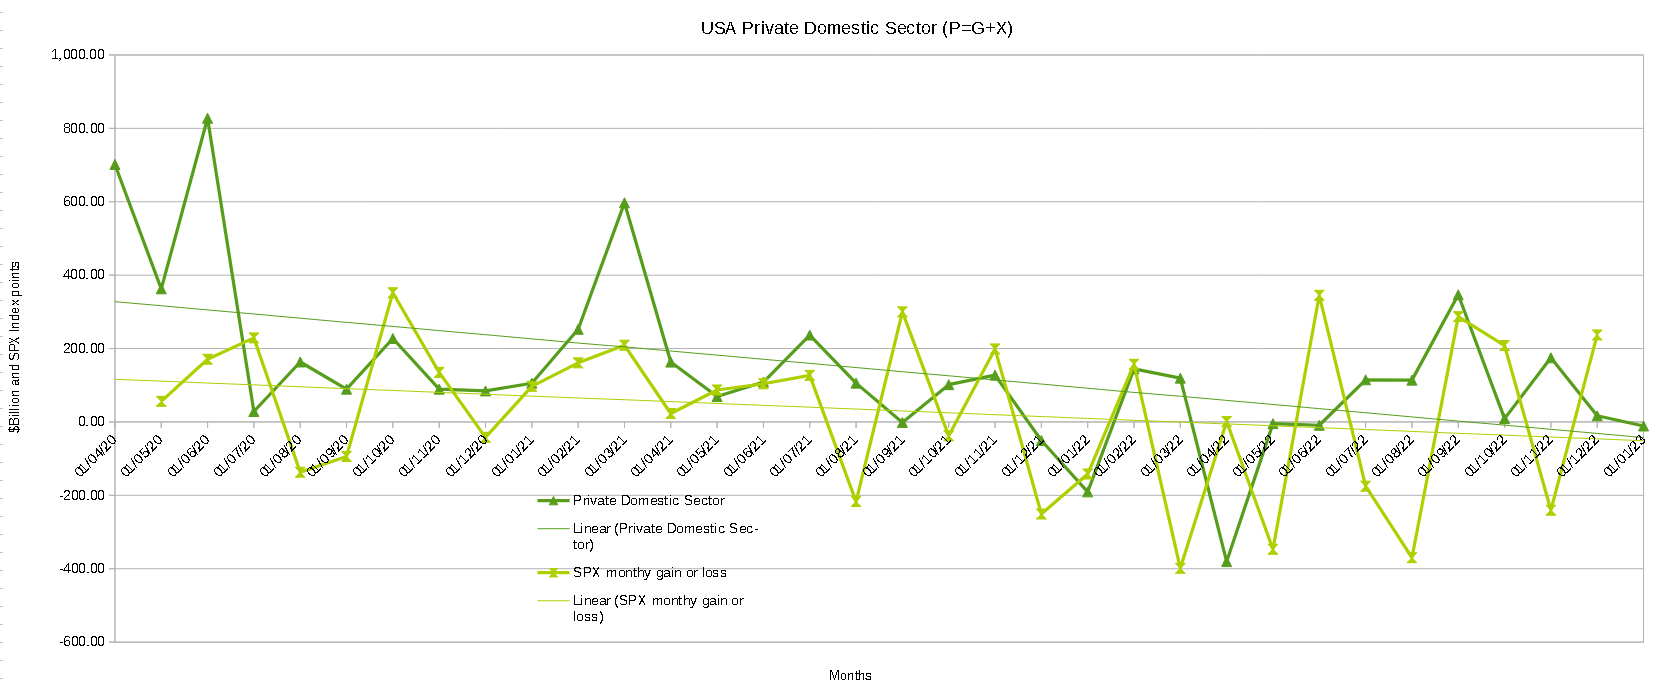
The chart below shows the above data plotted in nominal terms. A trend line has been added to give an idea of the broad direction, which is downwards for both the private domestic sector (where asset markets are located) and the SPX. The calculation is Federal government spending or G plus the external sector (X and normally a negative factor) to leave that amount of money left to the private domestic sector or P by accounting identity true by definition.
US Treasury and author calculations
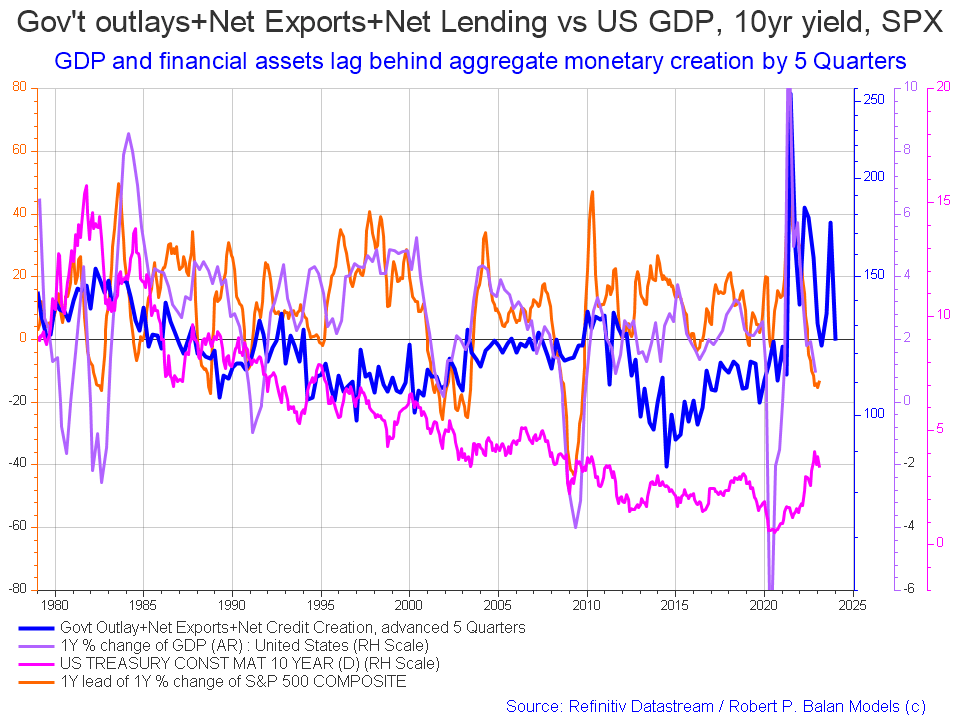
The following chart emerges when one graphs the change rate of the information in the USA sectoral balances table above and adjusts for impact time lags.
The blue line shows the fiscal impulse from federal government outlays plus bank credit creation and less the current account balance and leads by up to five quarters [a year and three months]. Though still trending downwards at present the orange SPX line is due to start trending back upwards and follow the leading blue line in about mid-2023. The big change over the last month is that the leading blue fiscal impulse line has shot down again and points to a major inflection downwards for markets in late 2024 or early 2025. The granularity of this chart does not allow for a more precise timing than this.
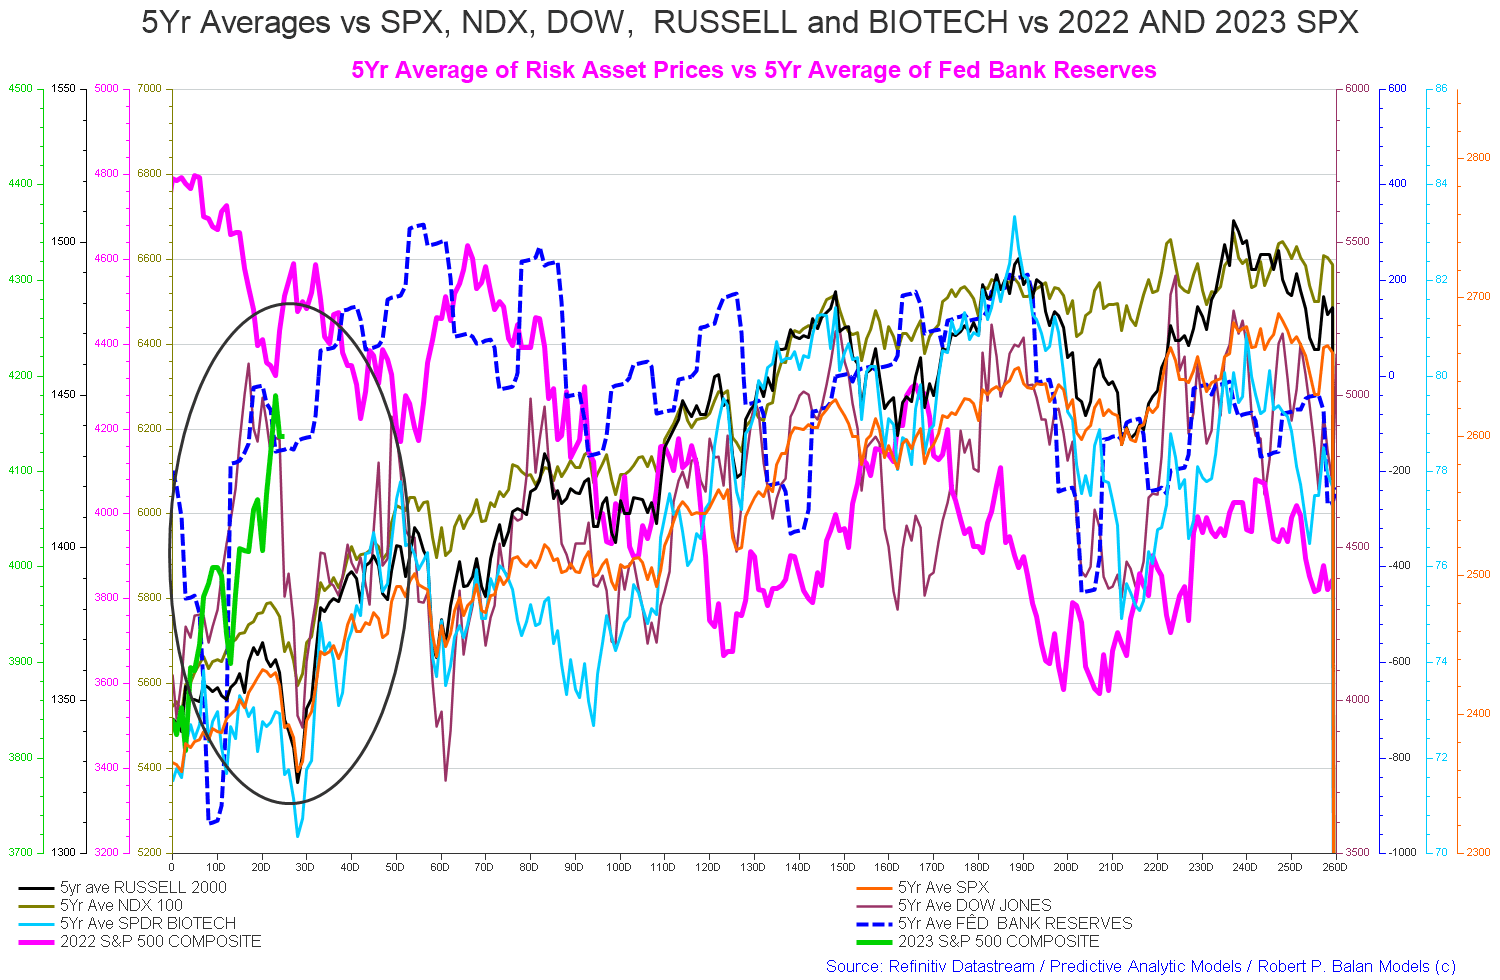
The chart below shows the five-year average of the seasonal stock market patterns for the SPX ( SPX ), NDX ( NDX ), Dow ( DIA ), Russell 2000 ( RTY ), and Biotech ( IBB ) market indexes. The black oval shows roughly where we are (trading day 26) at the time of writing and the end of the green line on the chart below.
This year is off to a good start, generally moving upward from left to right and against the bear trend from last year where the opposite was the case and general rule.
The 5-year index averages call for a sharp dip at trading day 30 and another one at trading day 60.
Tax loss selling has just ended and this month is a big federal government spending month with no major federal tax collections and there is a large treasury interest payment due in the middle of the month.
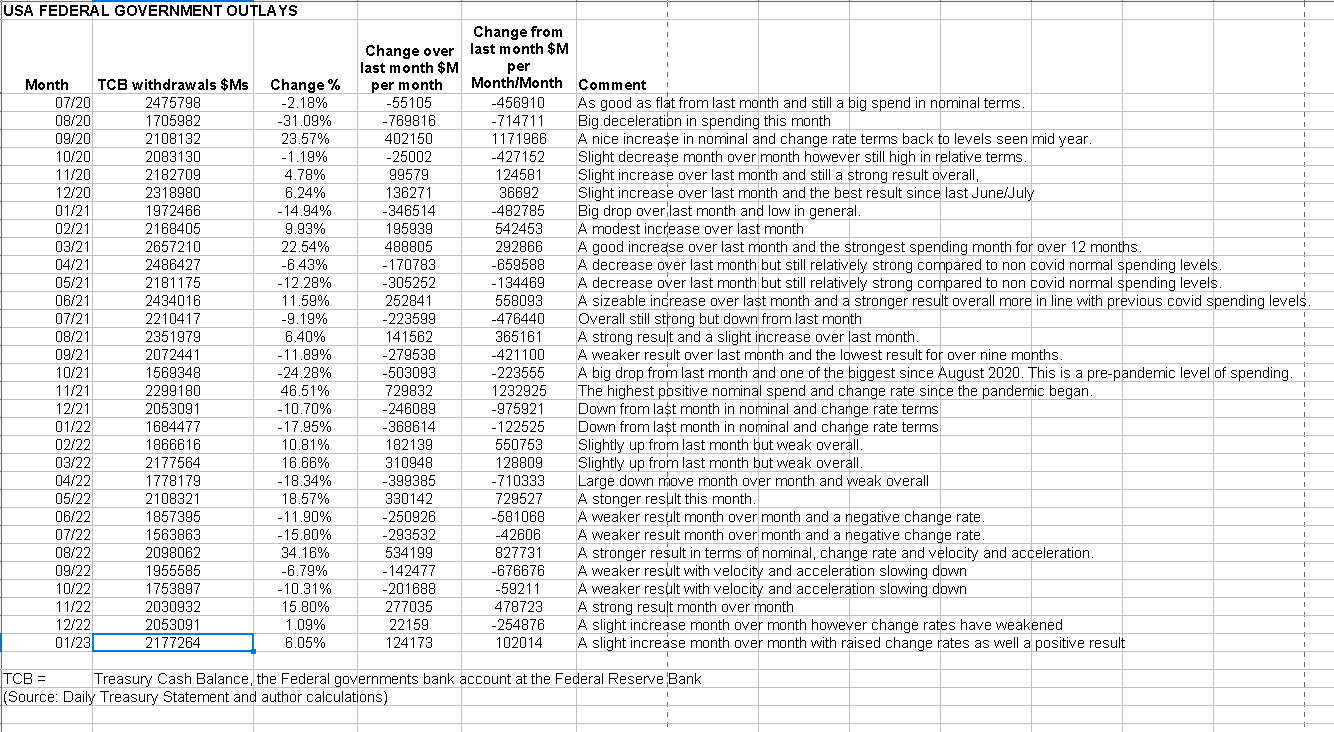
The table below shows the total federal withdrawals from their account at the Federal Reserve Bank. A withdrawal by the federal government is a receipt/credit for the private sector and therefore a positive for asset markets.
US Treasury and author calculations
The above table shows the federal government spent more strongly in January than in December and this produces positive change rates and could help engender a local high in asset markets [remembering that asset markets are currently moving down at the macro level].
The sectoral balance table at the start of this article shows that the overall federal government deficit spend [private sector surplus] was much less than in December, despite overall federal outlays being approximately the same, this was because of the large federal tax collection in mid-January made a deduction from the private sector surplus.
The good news for markets is that the February federal government spend is seasonally a large one and free from any large federal tax collections. Most likely it will be in the $200B+ range or better.
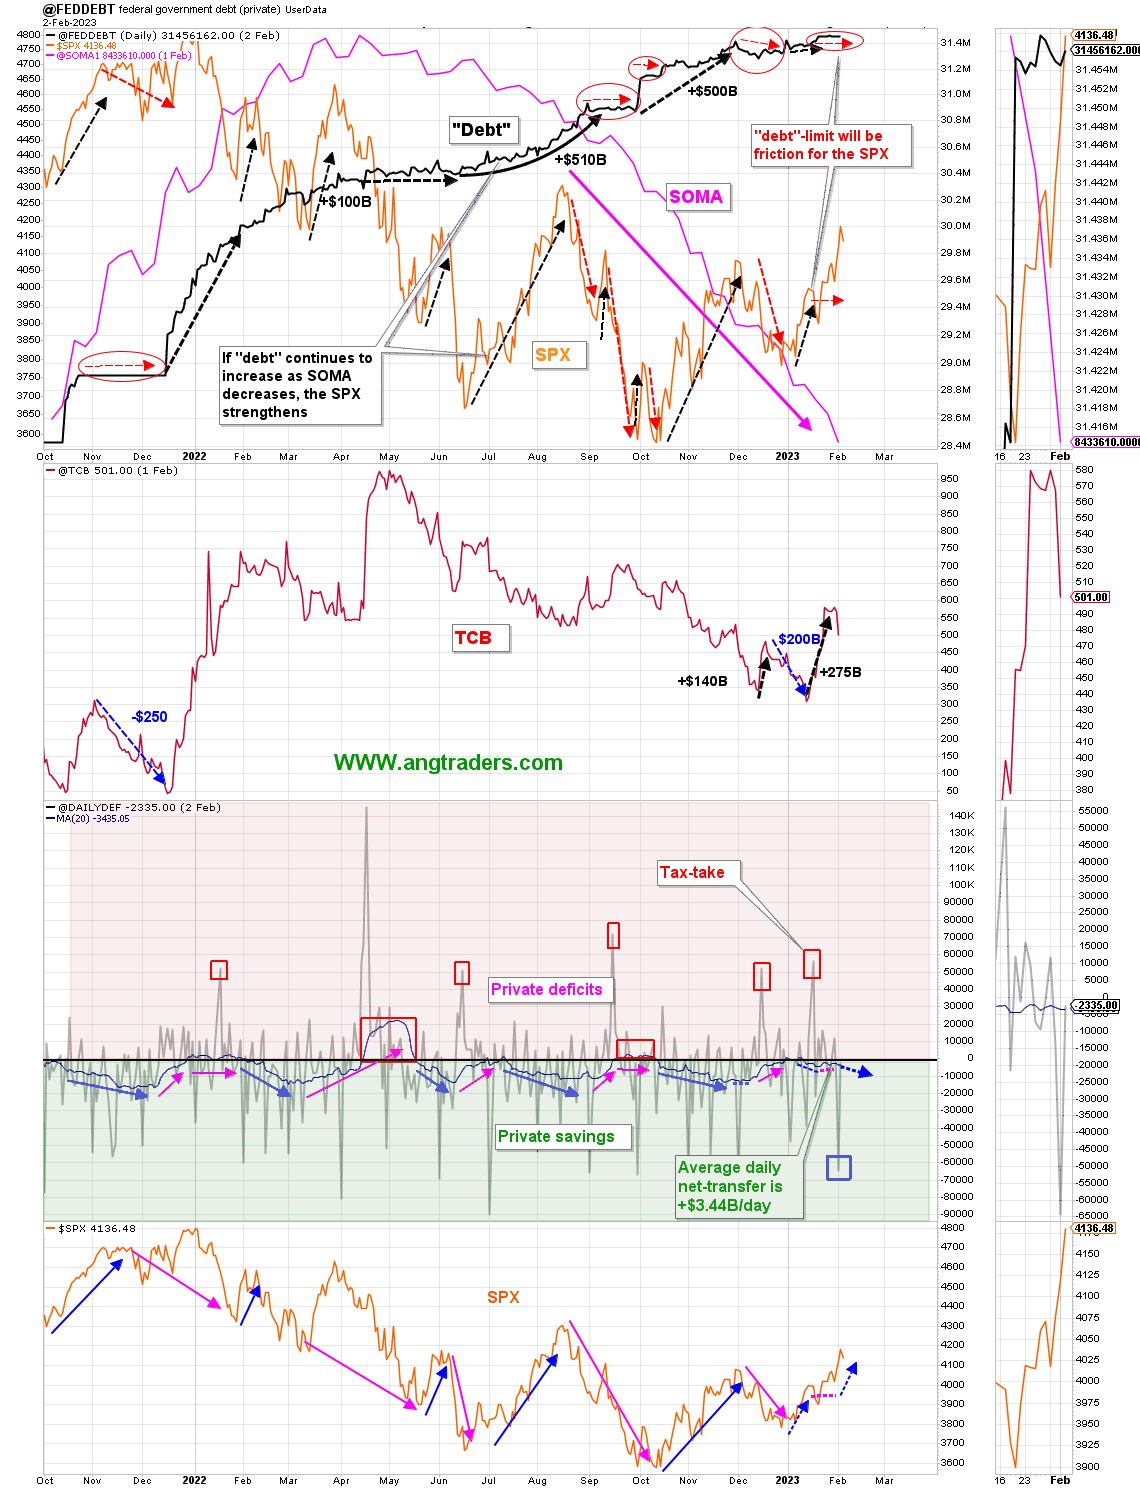
The chart below shows graphically the relationship between the federal government (currency creator) and the private sector (currency user) and is from ANG Traders of the Away from the Herd SA Marketplace service. The bottom panel highlights in red and green the financial relationship between the currency creator and currency users. One's loss is the other's gain and vice versa.
- The 20-day average of net-transfers is +$3.44B/day, which should continue to increase with the help of the Feb. 15 interest payment.
- There is a minor tax-take mid-March, followed by the big one April 15 which will cause a reduction in the net-transfers.
- The TCB still has $500B available for spending.
(Source: Mr. Nick Gomez, ANG Traders, Away from the Herd SA Market Service Weekly Report for Members).
The chart above shows that since the Fed started its quantitative tightening and rate rises the Fed's balance sheet (SOMA) has steadily fallen while interest rates have risen and markets have fallen. The new addition to this chart that is making itself evident now is that the 'Debt' line in the upper panel has now flat-lined. The stock of T-securities is the ultimate measure of system financial liquidity [money] and when this drops or stops growing then the economy will also stop growing and indeed will decline because a growing economy needs a growing money supply in the same way that a larger engine needs more fuel.
At the White House in the last month, the debt limit impasse continues causing the Treasury to move ever deeper into its range of limited extraordinary measures to find money with which to fund the government instead of not being able to create currency by issuing treasury securities of one form or another.
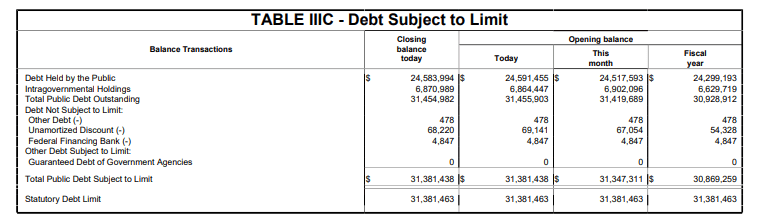
The Debt Subject to Limit is shown in the table below taken from the Daily Treasury Statement dated 31 January 2023.
In last month's report the extract from the same table above from the daily treasury statement was just shy of the statutory debt limit level and this month we have reached it.
Some wise words on the debt limit and all the other self-imposed limits to federal spending are set out below from Mr. Warren Mosler in his book 'Seven Deadly Innocent Frauds' which should be standard reading in all schools and universities as a basic building block in our national education system and that I would urge all readers to read.
Mr. Warren Mosler, 2010, Page 21
Last month in the comments section this report was honoured by a visit from the very same famed hedge fund manager, self-made multimillionaire, and founder of MMT, Mr. Warren Mosler, who made the point that we need to include in our calculations the interest being paid on T securities [which are] and also the interest on reserves that is remitted to banks by the Fed [which is new and were not], and this makes for a very interesting addition.
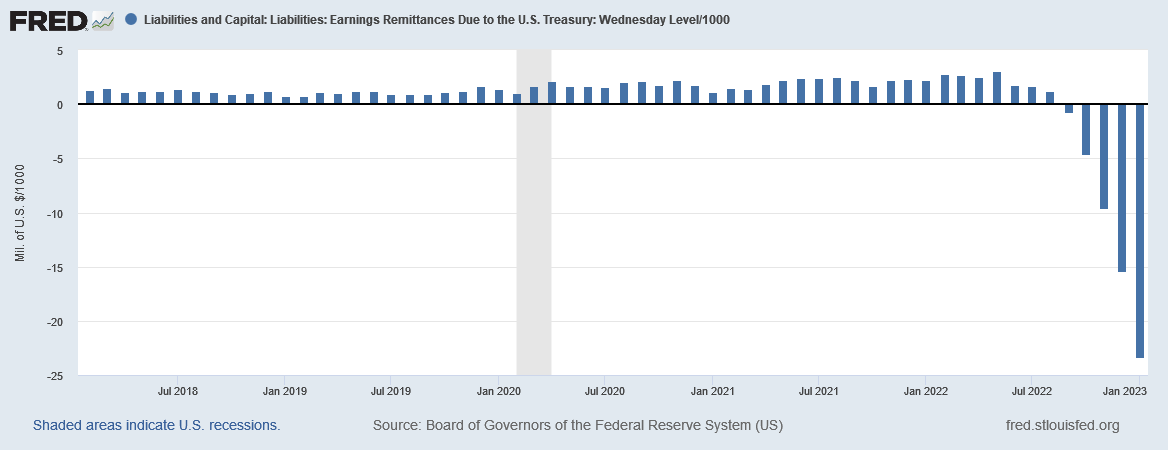
When the Fed raises the federal reserve rate, as it did just this month at its latest meeting by another quarter of a percent, it also raises the interest rate that is paid to banks on their reserves. The Fed pays the interest rate on reserves [IOR] and its other obligations out of its 'earnings' from its balance sheet of T-securities. The earnings are now not enough to meet these costs of operations and the Fed is now recording what is called a 'deferred asset' and what we in the private sector would call a negative bank balance. Given the Fed is the currency creator it amounts to de-facto currency creation and is now running at the rate of over $20B+ per month and increasing with each interest rate rise. This represents as much as one percent of GDP per annum. The chart below shows this information.
The above cash injection is a direct add from the government sector to the private sector that is not accounted for in any other place but represents an input of around 1% of GDP, over a full year, and adds to the money supply dollar for dollar. This is a positive thing for the private sector and has been added to the USA sectoral balance table at the start of this article and also revised back for the five months that were missed before this new financial phenomenon became known. ANG Traders provides a good summary of the situation below.
ANG Traders, Away from the Herd Chat Room February 2023
For all its goodness it is not enough to change the strategic downward direction of the private-domestic sector balance.
This fiscal flow goes directly to the banking sector and adds to their income and profits and is a prime example of how the wealthy elite sculpt the financial landscape for their benefit. Based on share price performance it appears that Morgan Stanley ( MS ) and JPMorgan ( JPM ) may have gamed the system the best as their share price is benefiting the most at present as compared to their peers, as the chart below shows. Given how much interest rates are continuing to rise one can expect that over $20B per month will flow directly into the banking sector for the foreseeable future, driving banking stocks higher.
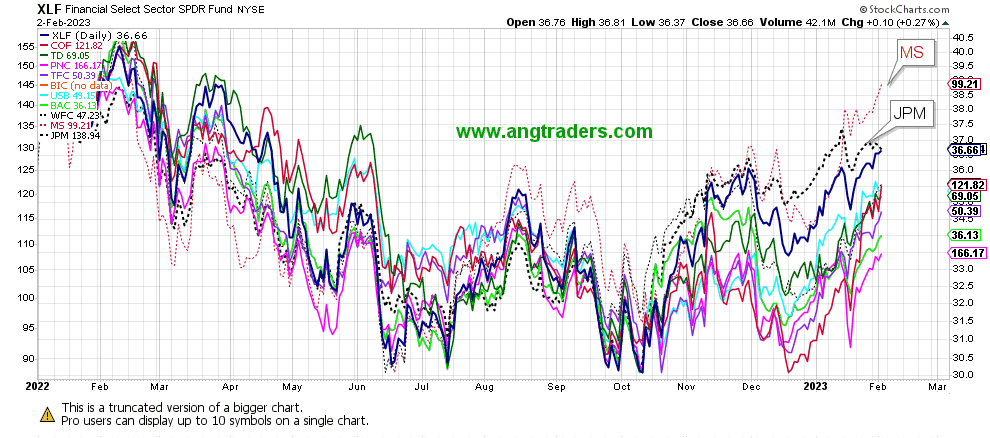
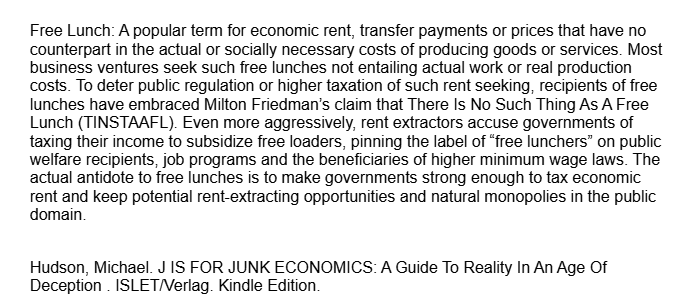
Interest on Reserves is the ultimate free lunch that is not supposed to exist according to the neoliberal economic orthodoxy led by the teachings of Milton Friedman. But does in reality.
How did this come about? How is it so that such a system come into existence?
At issue is the classical definition of economic rent as unearned income – the excess of price over real cost-value – a property claim or privilege that does not reflect a necessary cost of production. Such costs ultimately are reducible to payment for labor.
Indeed, the Labor Theory of Value was refined as a means of isolating economic rent. By rejecting classical value and price theory, today’s literally value-free economics is based on the assumption that no activities are unproductive or extractive. This inversion of language misrepresents what the leading classical economists stood for.
Adam Smith and his fellow reformers are claimed to have favored “free markets” and opposed government “interference.” What they actually opposed were governments controlled by the landlord aristocracy dominating tax policy, e.g., by the power of Britain’s House of Lords to tax labor and industry instead of land and finance. Smith criticized military adventures and colonialism for running up war debts, issuing government bonds to be paid by taxing basic consumer goods.
By the late 19th century, reform movements were gaining the upper hand. Influenced by Darwin, nearly everyone saw industrial capitalism evolving into what was widely called socialism. From Christian socialism to the “Ricardian socialism” of Mill, and from utopian socialism to the libertarian socialism of Henry George, the term “socialism” had a broad variety of constructs.
Marxist socialism described capitalism as being revolutionary in leading inexorably to stronger pubic ownership and direction of the economy, often via nationalized banking systems.
Surprising as it may seem today, classical ideas of creating a free market were to be achieved by “socialist” reforms. Their common aim was to protect populations from having to pay prices that included a non-labor rent or financial tax to pay landlords and natural resource owners, monopolists and bondholders.
The vested interests railed against public regulation and taxation along these lines. They opposed public ownership or even the taxation of land, natural monopolies and banking. They wanted to collect rent and interest, not make land, banking and infrastructure monopolies public in character.
Today, neoliberals and their libertarian mascots seek to make governments too weak to fulfill the classical program of taxing land and natural resources, regulating or preventing monopolies, or providing basic financial and economic services by public infrastructure investment. Denigrating regulation as “central planning,” the effect is to leave planning to the world’s financial centers from Wall Street to the City of London, Frankfurt and the Paris Bourse, all of which lobby on behalf of their rentier clients. What calls itself libertarian thus has become a financially sponsored counter-Enlightenment against democratically empowered governments.
Hudson, Michael. J IS FOR JUNK ECONOMICS: A Guide To Reality In An Age Of Deception . ISLET/Verlag. Kindle Edition.
The Fed's intrepid and misguided fight against inflation is well summarised by Professor William Mitchell in one of last week's blog entries shown below.
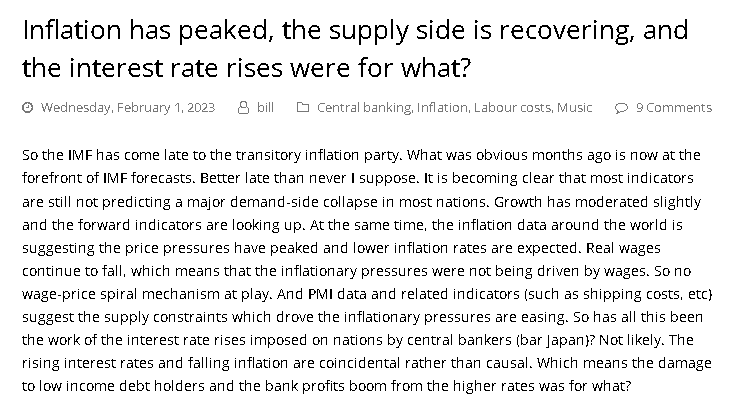
As the episodal wave of inflation moves through the economy and dissipates, given the M2 money supply is now in reverse and the shortages created by covid are easing and adjustments to the Ukraine war are made, the most likely outcome now is a phase of deflation as set out in the charts from Professor Ivan Kitov below.
Professor Ivan Kitov
In the chart above the professor shows that the producer price index [PPI] for commodities' final demand has entered minus, negative territory. This is a similar state as was achieved after the global financial crisis where there was what was coined a 'great deflation' [though there was nothing great about it] as a result of national governments around the world going into a collective policy of austerity that starved the world economy of cash. This was at a time when exactly the opposite policy was required to stimulate sagging aggregate demand. This caused the recovery from the GFC to the slowest and shallowest on record. The jobless recovery.
Professor Ivan Kitov
Similar to the chart above here we have CPI entering negative territory. The chart shows annualized monthly dCPI/CPI from 2011 to 2022. In December 2022, the rate of fall was 1.0%.
Professor Ivan Kitov
Finally, the chart above completes the picture of the CPI [Consumer Price Index] and PI [Personal Income] rolling over into a deflationary outcome.
The deflation period will last longer than the current high inflation period. The reason is simple – the consumer and producer prices in December 2022 were at a much higher level than in January 2020: CPI by 15% and PPI (FD) - 17%. There is no money in the PI to match the new level of consumer and produced demand as expressed in new dollars,....The total price fall will be larger than the growth by 15% -17% because price deflation is a self-promoting process.
Source: Professor Ivan Kitov.
One wonders if the Fed and other world banks have access to this sort of information and if so why they ignore it and carry on with unnecessary and destructive rate increases. Perhaps it is political and the need to be seen to be doing something. Similar to an eighteenth-century doctor bleeding his patients in an attempt to cure them of anemia, it made the situation worse but he was seen to be doing something, and that was the main thing.
The housing chart shown below [and the business cycle is the land cycle given the size of the capital invested in it], appears to be making a bottom and has had several months of sustained growth. This could be green shoots that herald the beginning of the next upcycle or the formation of a double bottom given a recession is likely at the end of this year or the beginning of next.
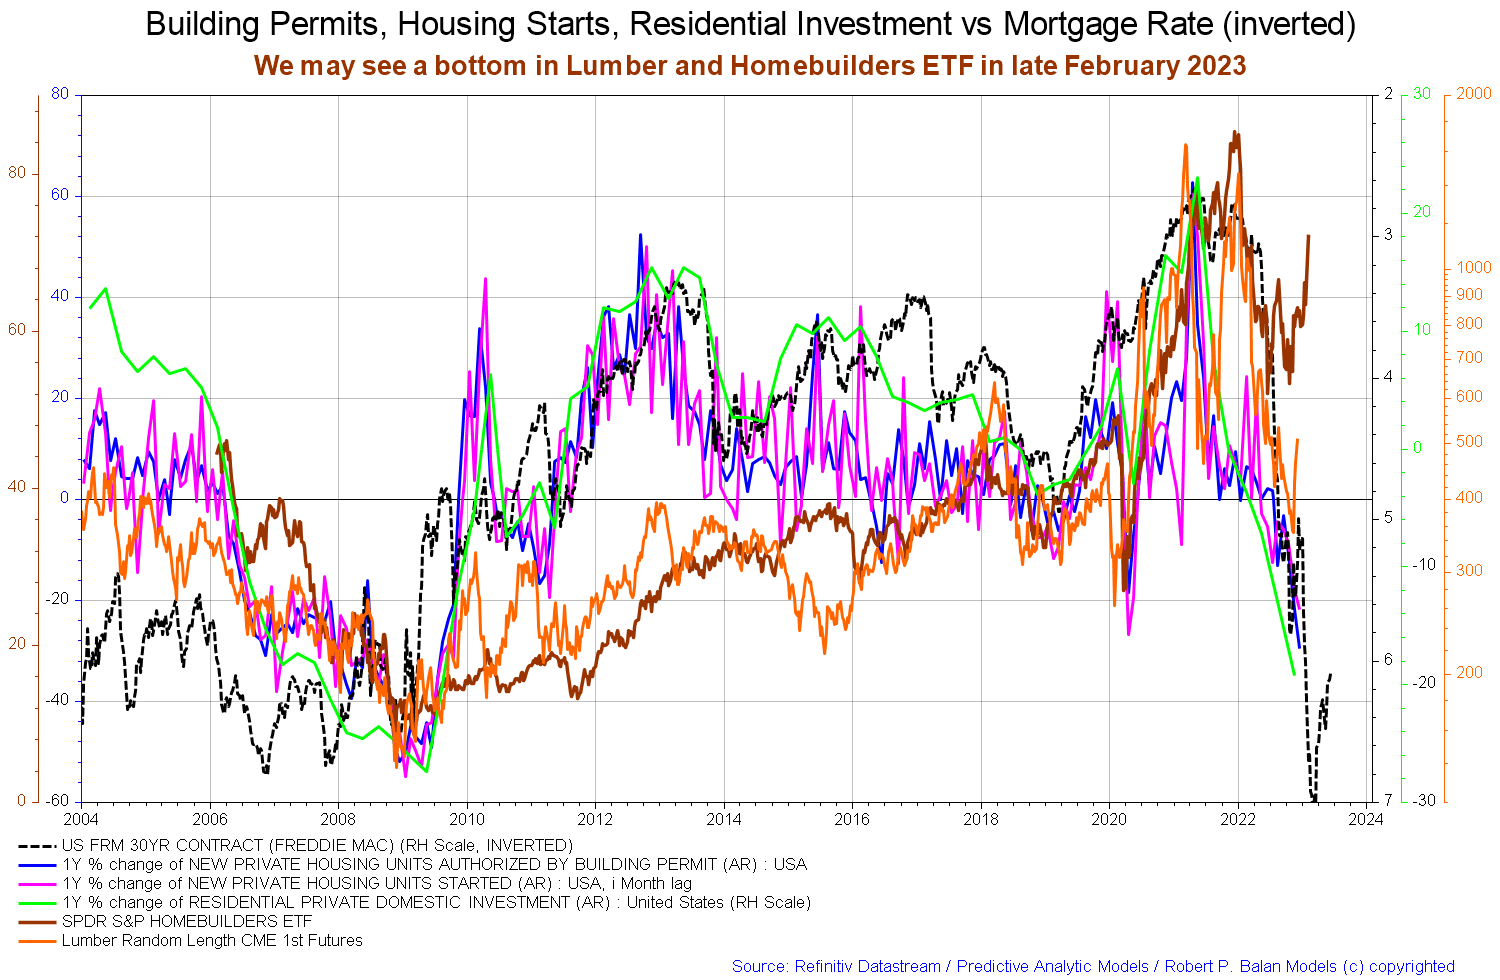
On the larger world macroeconomic side, we have the G5 chart below. The chart below comes from Mr. Robert P. Balan of Predictive Analytic Models. The chart shows the level of money creation by the top five world governments (the G5) in a change rate format, along with a host of other indexes. This chart gives a sense of important inflection points and direction.
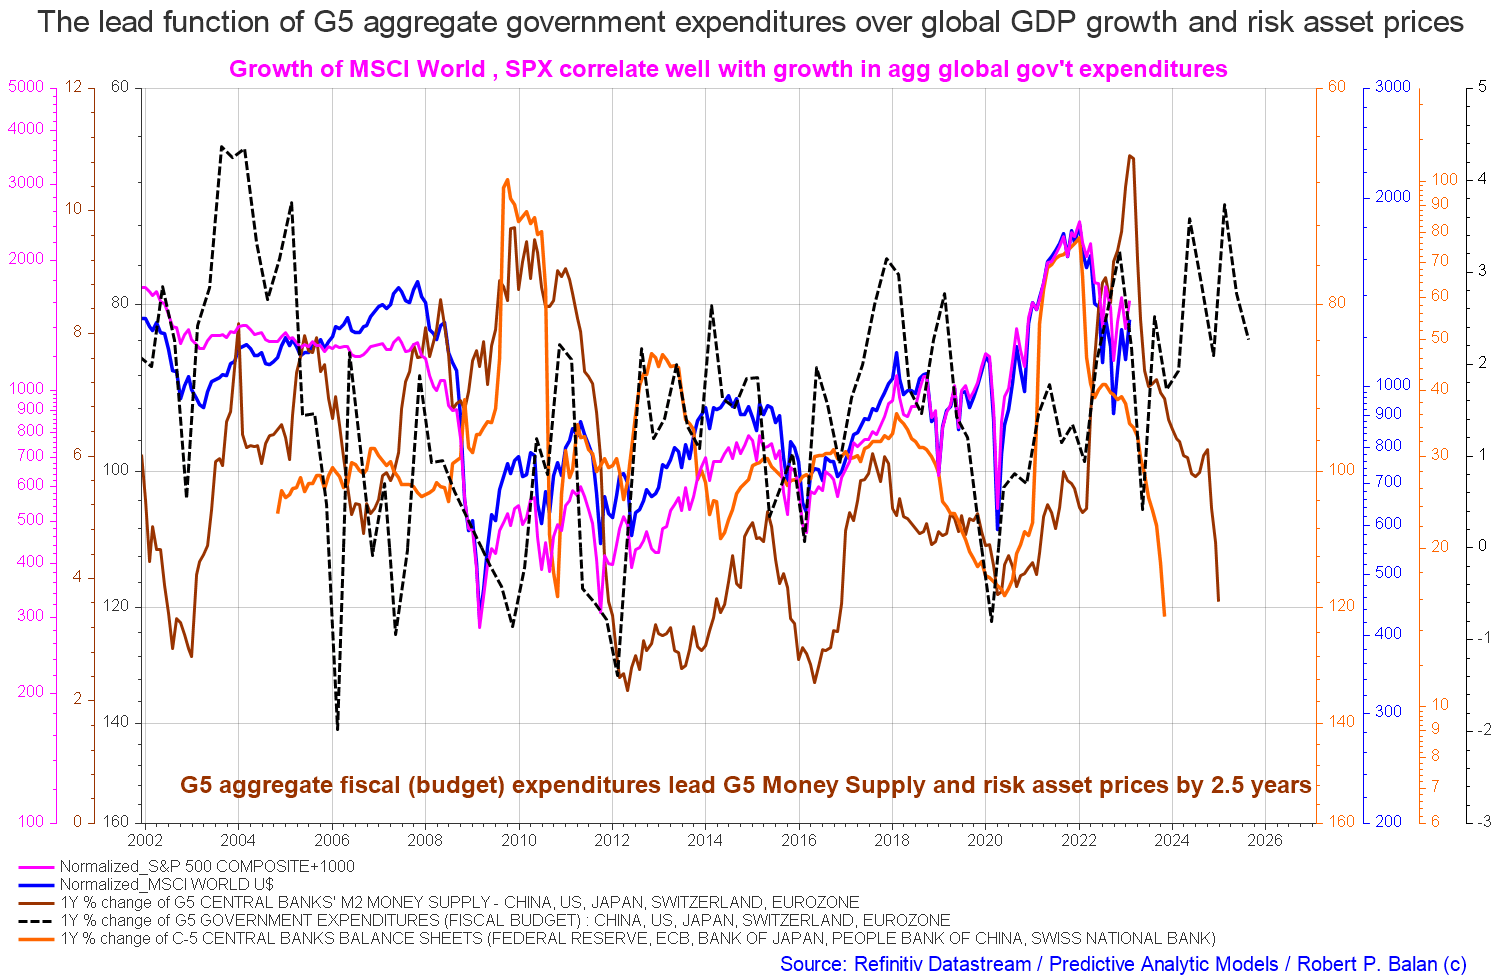
The chart above shows that central bank balance sheets and M2 [brown lines] are still falling hard. At the same time, total G5 expenditure is generally rising even though at present it is at a low and looks to rise strongly into the rest of the year [black dotted line]. One wants to see all the co-variables rising and falling together and not in divergence as is the case at present.
The macro direction is still downwards with local rallies that should be sold.
If you are looking to make a market entry, sometime in the last quarter of 2023, the first quarter of 2024, is likely to be a good time judging by the macro tidal forces that underpin the asset markets. Best to wait now until the recession has come and gone.
For further details see:
The White House, Fed, Inflation, And Flow Of Funds For February 2023