VTI - The Worst Month Of The Year: 3 Reasons To Sell
2023-09-06 16:29:06 ET
Summary
- September historically has been the worst month for stocks, but recent years have seen positive returns.
- With that said, there are a few reasons why this September could be bad.
- Renewed bank stress, dollar strength, and surprise inflation are just a few.
Thesis Summary
Looking at long-term history, September is statistically the worst month for stocks, but to be fair, this effect has been broken in the last few years.
With that said, I'd like to mention three reasons I think stocks could fall in the coming month in this article.
After a quick selloff, we are back near the recent highs, but I still see significant banking and real estate risks.
Dollar strength and higher rates will be a headwind for risk assets, and higher-than-expected inflation could put a dampener on the current Goldilocks narrative.
Lastly, I can't help but wonder: how long will the market keep cheering higher unemployment?
Is September really that bad?
If we go back to 1928 and measure the performance of the S&P 500 (SP500) every month, we can see that September is the worst-performing month by quite a margin.
SPX return (Goldman Sachs)
Only May, February, and September have been negative on average over the last nearly 100 years. September has returned on average -1.5%. But why is that?
There are many possible explanations for the "September Effect." Some believe it could be a matter of large funds booking profits ahead of the quarter end. Or perhaps it is retail investors cashing out in order to pay for expenses associated with the new school year.
Ultimately, most of these explanations are unsatisfactory. The September effect can be considered an anomaly, and, in fact, September has delivered a positive average return since 2014.
My point is that if we want to defend the idea that this September will be bad, we have to come up with some real reasons relevant to today's market.
Stress In Banks and Real Estate
It seems like we have already forgotten that only a few months ago, regional banks were on the brink of collapse. High rates were threatening regional banks with huge impairment losses, and the Fed had to step in with the Bank Term Funding Program.
Today, rates are back near the levels seen in March. We've actually seen an increase of a few billion in the use of the BFPT as of the latest Fed update.
Now, by itself, this situation seems to be under control, but I think there could be another domino ready to fall here, and that would be real estate.
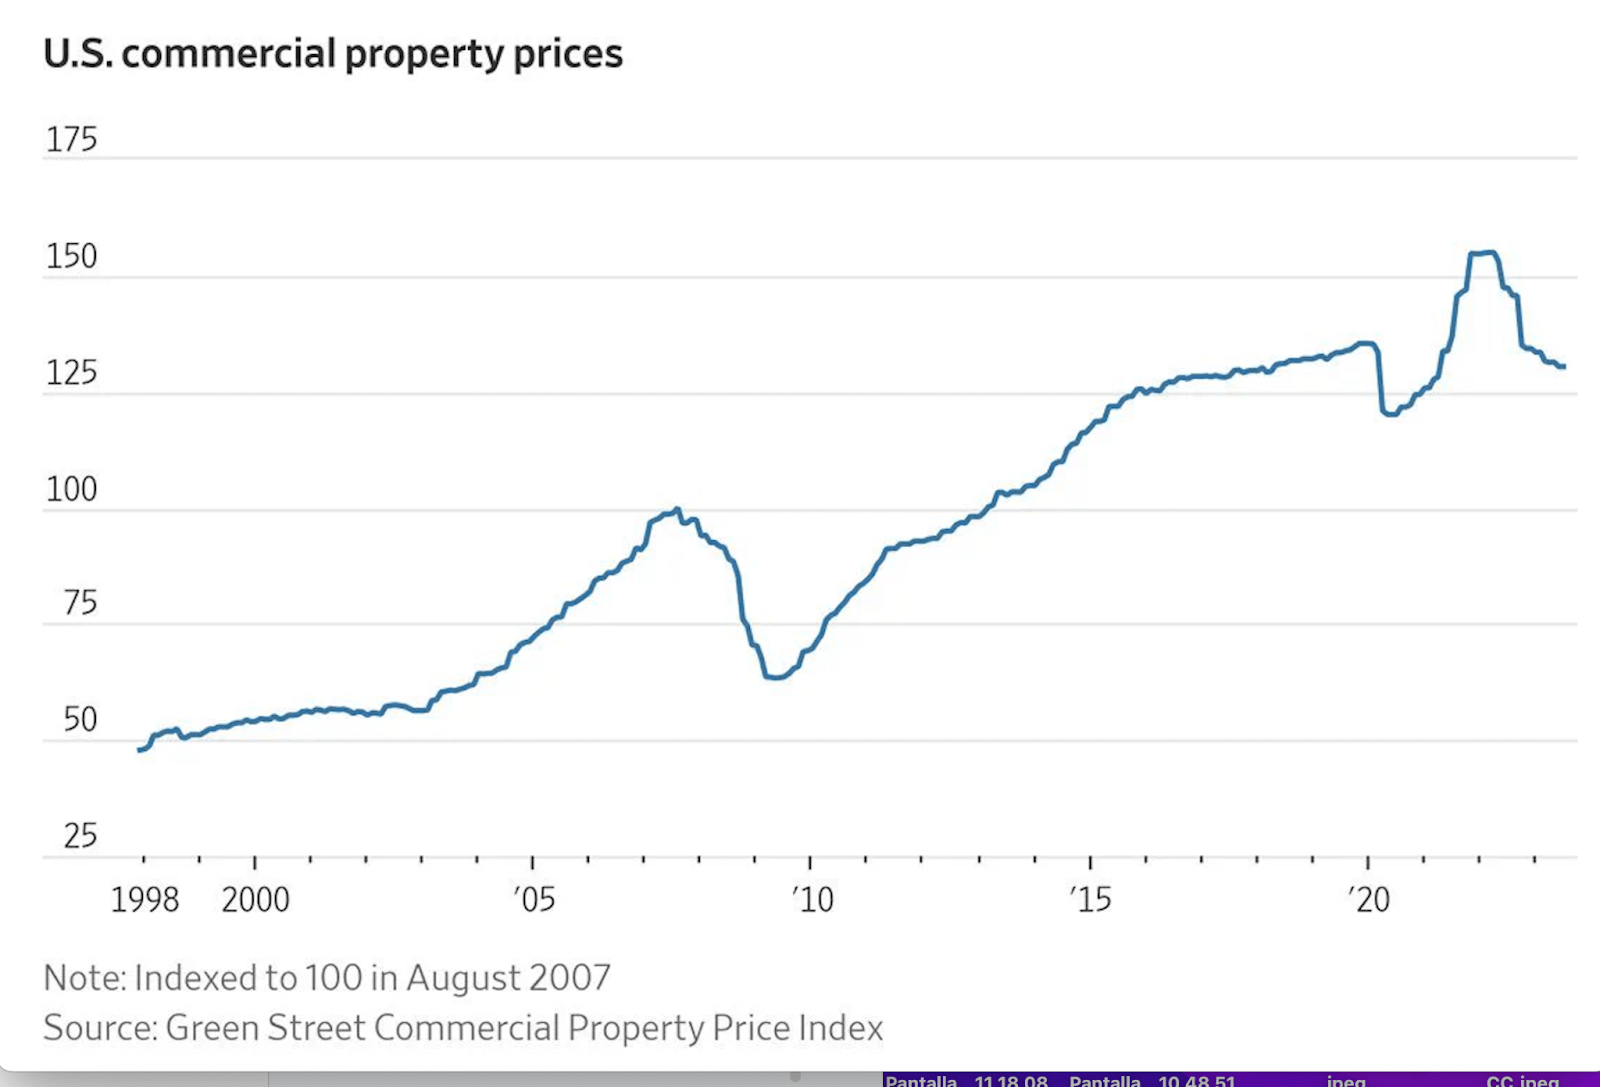
Particularly, commercial real estate has been showing signs of weakness for a while.
Commercial Property Prices (Green Street Commercial Price Index)
Commercial property prices have been falling for the last year, and quite dramatically. The move away from the office has been a big contributor, and despite the company's best efforts to bring people back, it just doesn't make sense.
In the long term, companies will save billions on costs, but this will only happen after some short-term pain, and this will take a big toll on regional banks, which have significant exposure to this market .
Dollar And Treasuries
Another big headwind for markets is, of course, the path for the dollar index ( DXY ) and Treasuries (TLT). We've seen a strong correlation in these markets over the past few years.
As the dollar rises and rates go up, this sucks up liquidity from the markets, negatively impacting risk assets.
From a fundamental perspective, the uncertainty abroad in countries like China and Japan is, in my opinion, contributing to dollar strength, which in turn is contributing to strength in treasuries.
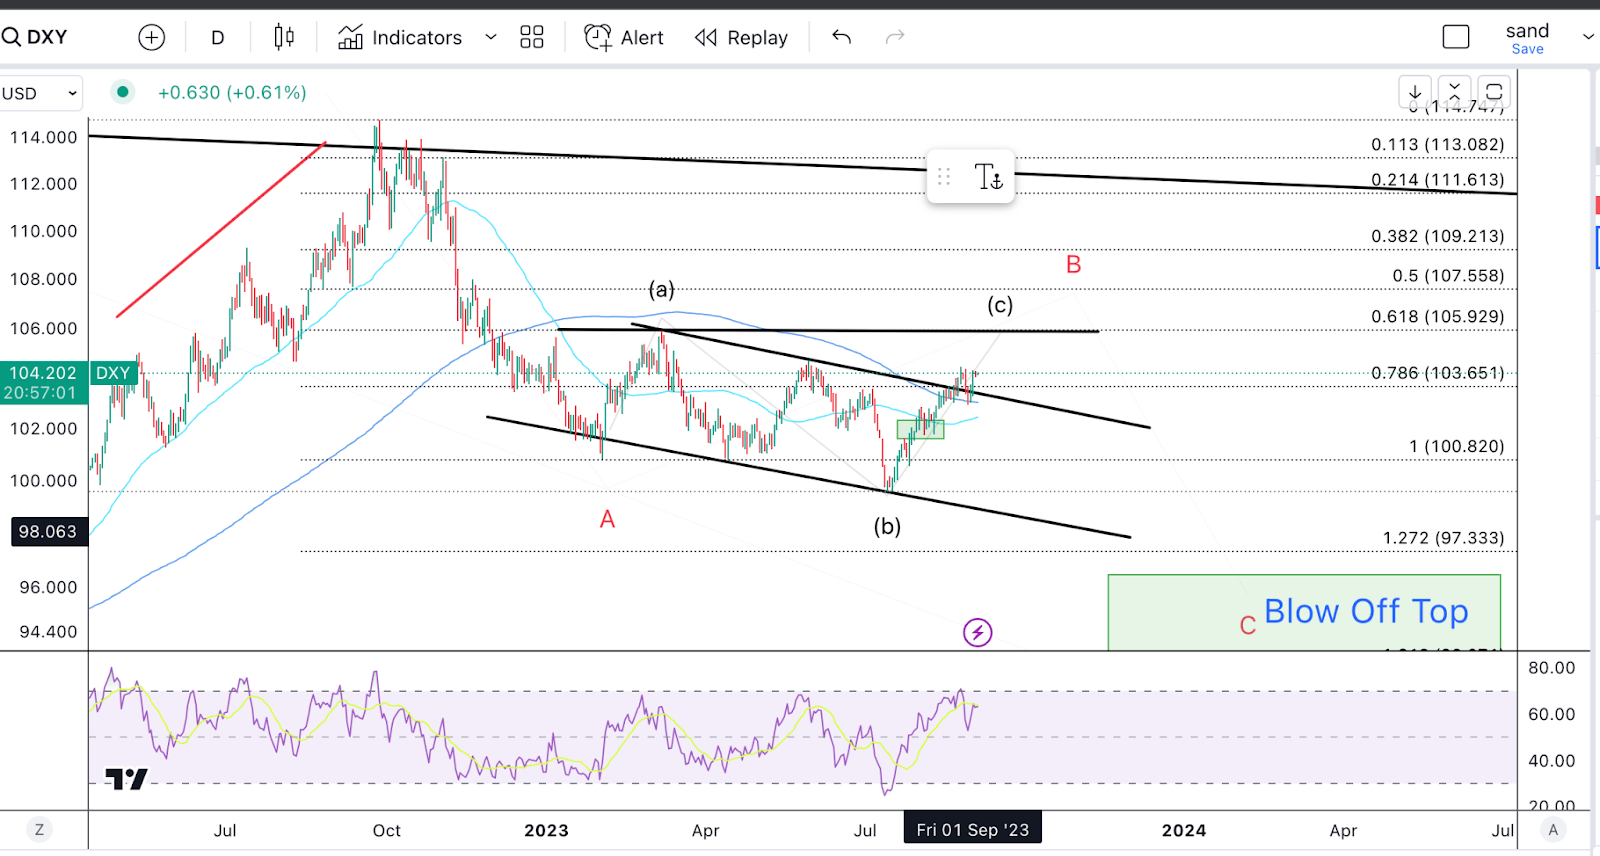
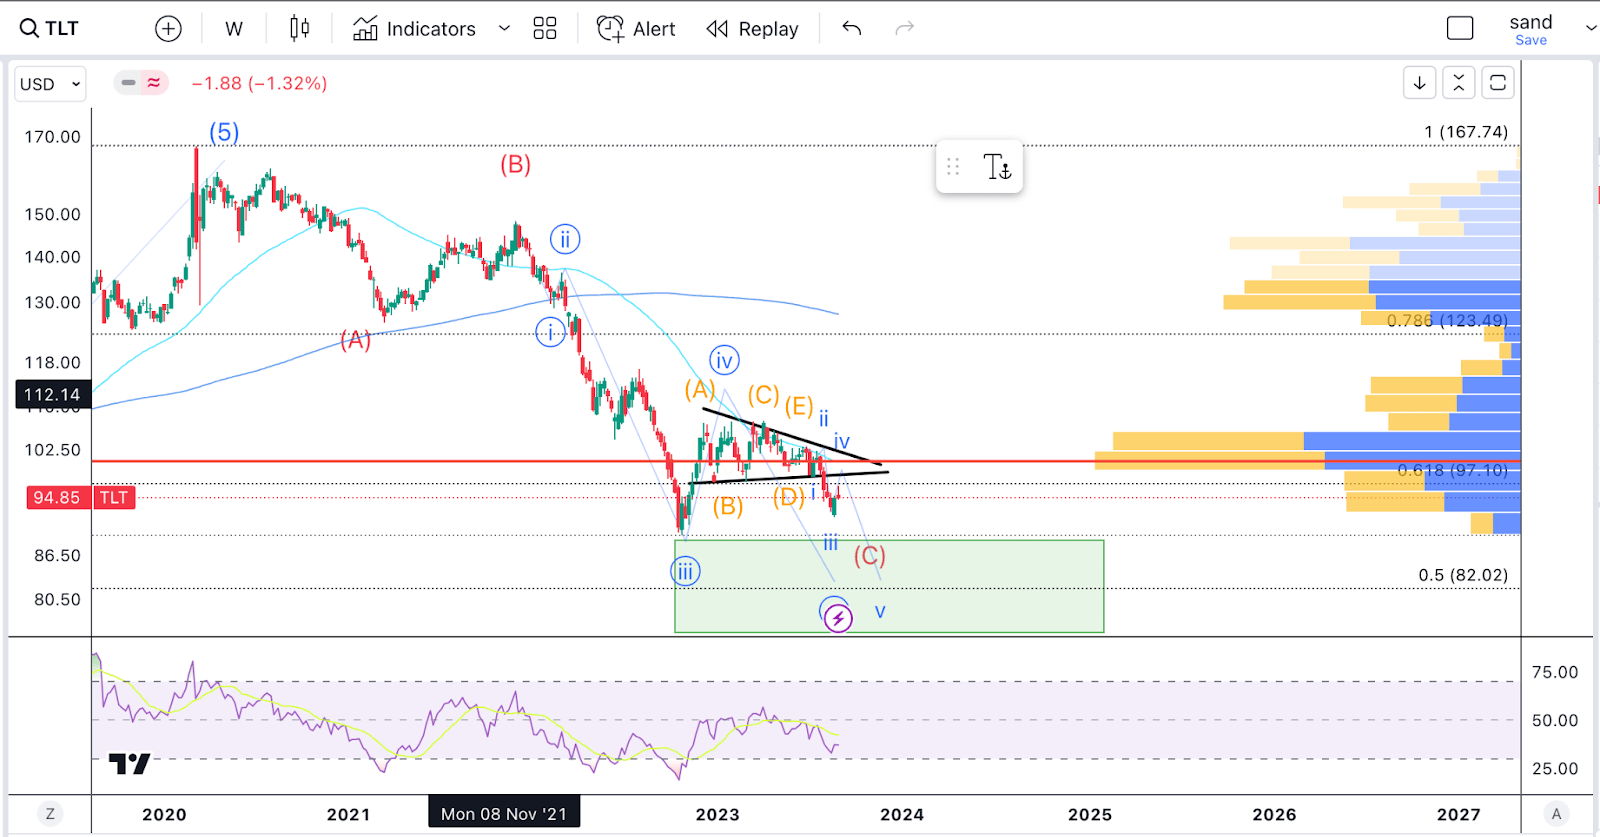
From a technical perspective, the dollar looks bullish, while Treasuries look bearish to me:
The DXY bounced from the 200-day MA, seeing also a strong reaction in the RSI. Ideally, I think the DXY could try to break above the recent high, labeled (a) on the chart, and I'd be looking for a reversal, perhaps at the 50% retracement of the whole move down from the top, which would take us to 107.5
Meanwhile, treasuries look like they need one more low. From an EWT perspective, we should at least head a little bit below the 2022 lows. I would change my view here if we can break above the resistance at 102-5.
Unemployment and Inflation
From a macro perspective, the market is now quite happy as we approach a "Goldilocks" scenario. Markets cheered the weak employment data, as this gives the Federal Reserve the perfect excuse to pause.
The next FOMC meeting is two weeks away, and hardly anyone expects a rate hike:
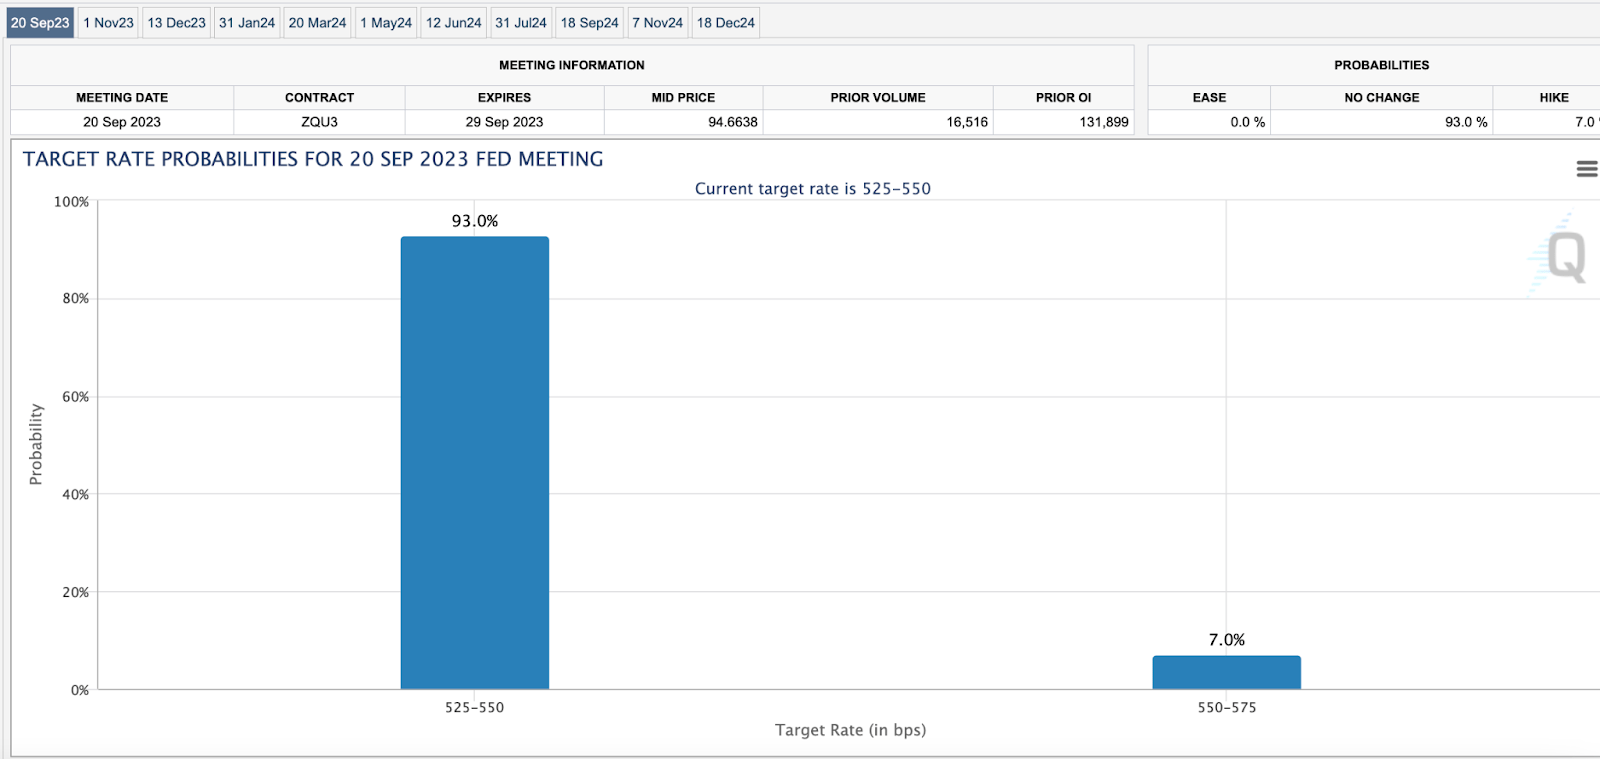
These CME predictions looked quite different before the jobs report.
While a pause, at the moment, would be very bullish, and I've made that point before, there are immediate risks that the Fed might have to hike and also risks that it might be forced to cut, which is never good for markets.
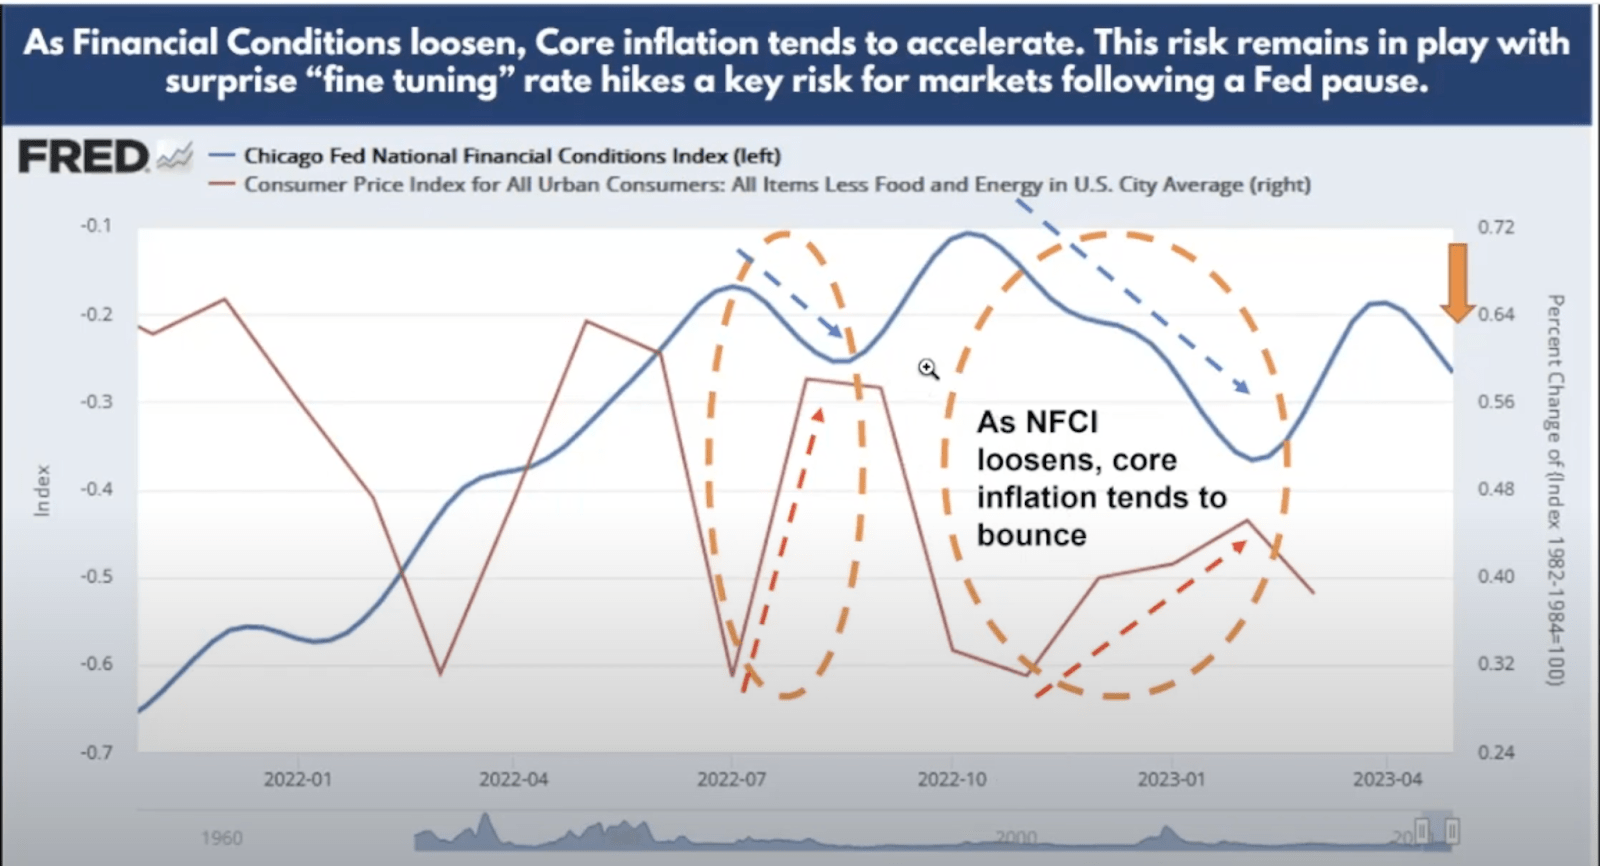
Though inflation has been coming down in the last year, there's a chance we could see some resistance in the last few percentage points.
Firstly, we can see that financial conditions have actually been loosening, as shown by the Chica Fed National Conditions Index in Blue. This has a pretty strong correlation with inflation. Looser financial conditions lead to higher inflation and vice versa.
On top of that, commodities like oil have been rallying, which is also putting pressure on prices.
Moving on to employment, it's important to point out that rising unemployment will eventually be bad for the market.
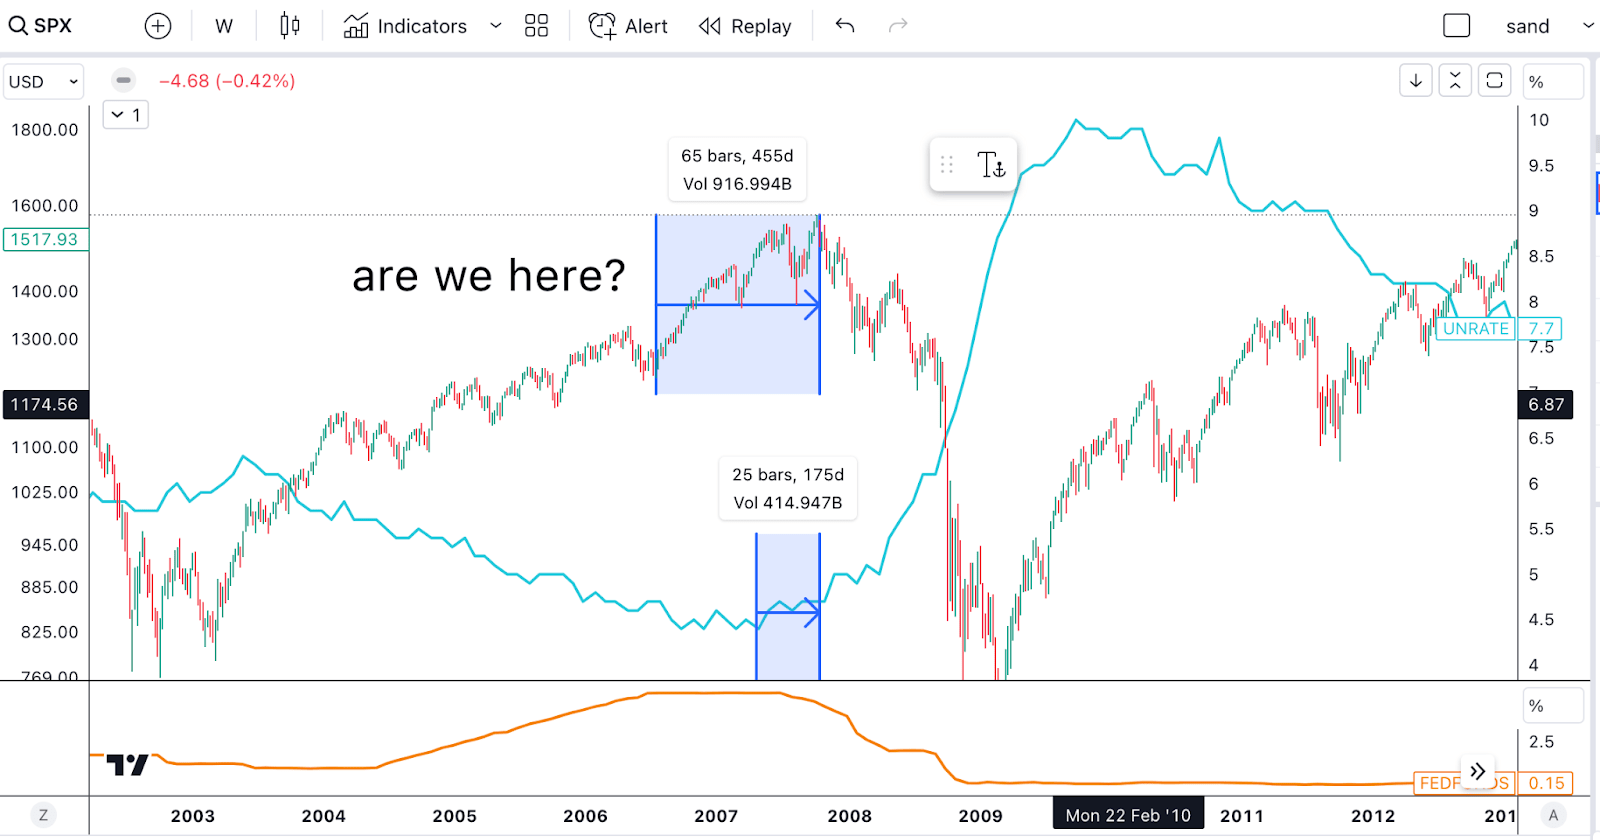
Yes, there's a sweet spot before things go south, but if we look, for example, at 2008, it was only around 175 days between the bottom in unemployment and the top in stocks. We can also see that it was about 455 days from the Fed pause to the market top.
This is ultimately an argument that we might want to sell a bit later on, perhaps in Q1 or Q2 of 2024, but it's important to point out that we are nearing the end of the cycle, and downside risk is increasing.
Final Thoughts
In conclusion, while there is no real reason beyond statistics why September should be a bad month, there are at least a few reasons why this September could be bad. Based on my technical analysis of the market, I think we are due for a deeper correction from these levels. This could be an opportunity to go long, though I might be looking at selling as we approach Q1 and Q2 of 2024.
For further details see:
The Worst Month Of The Year: 3 Reasons To Sell