FINV - Things To Know About FinVolution Before It Breaks Out (Technical Analysis)
Summary
- Assuming geo-political turbulences, any attempt of building a Chinese-oriented portfolio has to factor in the volatility and can lend to market timing.
- Chinese consumer finance FinVolution is a boring business but flying under the radar often means outsized returns for investors.
- Technical setup on FinVolution indicates a high probability of breakout.
About the business
FinVolution Group (FINV) is a Chinese consumer finance company existing since 2007, and started its US trading in 2018 on NYSE, with a current market capitalization of $1.41B. If you are considering investing in FINV, I assume that you have accepted the following risks, among others: political, currency, and regulatory, and that you are aware of the volatility that those risks pose on your investment return (need to be aware of the foreign return being different from domestic, etc.). Not to mention the linguistic barrier which remains very strong despite best attempts to provide summary translations into English from lengthy questions and answers in Chinese during the earnings calls.
FinVolution's mission is to connect borrowers with institutional funding partners, which has been realized for 100% of the new loans facilitated since 2020 (when they ceased connecting individual investors for peer-to-peer credit), strategically focusing on borrowers between the ages of 20 and 40, the young and early middle age consumers who join the FinVolution platform (PPDAI in China) for the simple and fast loan transactions.
In China alone, 78.1%, 88.2%, and 80.0% of the total loan volume facilitated through the FinVolution platform in 2019, 2020, and 2021 was generated from repeat borrowers. As indicated during the Q3 call, the proportion of category A and B borrowers in the domestic market who met the highest credit standards expanded to 75% of total borrowers from 58% in the same period last year.
FinVolution offers loans for individual consumers and for small businesses (around 60% of the latter have been in business for more than 3 years).
The annual growth of the user base numbers is visualized below with cumulative borrowers' number above 26 million (23.2 million in China and 3 million internationally:
Users base in China (FINV IR Q3 2022 presentation)
Users base internationally (FINV IR Q3 2022 presentation)
The company operates now in 5 countries. The primary market is China, but the international expansion started in 2018 with the establishment of two subsidiaries in the Philippines, 2019 in Indonesia, and 2020 in Singapore. Another market is being developed in Vietnam. The international outstanding loan balance reached RMB 640 million , representing a sequential increase of 33% and a year-over-year increase of 88%.
The management is very honest about their aim of getting to international markets as more open to the intended business operations than what is legally possible in the motherland China.
Their cumulative loan balance is RMB 566 B (as of Q3 2022 earnings reporting) and the current balance is RMB 60 B , representing an increase of 7% sequentially and 34% year-over-year. Let us put into perspective of the China consumer finance market size measured at $2.5 Trillion in 2022, according to FinVolution's own presentation .
Loan balances (FINV IR Q3 2022 presentation)
FinVolution's business model relies on collecting transaction service fees primarily from institutional funding partners. The company acquires customers through diverse channels such as online adverts, search engine marketing, or app stores, as well as through direct sales teams.
FINV ecosystem (FINV IR Q3 2022 presentation)
FinVolution relies heavily on the technological savviness of the borrowers' demographics since it uses online platforms in its respective markets for loan matching and transactions, so the borrowers need to be digitally connected and trained in using apps.
FINV platforms (FINV IR Q3 2022 presentation)
Since 2014, FinVolution has been using the proprietary credit scoring model called Magic Mirror which in essence is a huge database laying the foundation of AI algorithms and machine learning tools.
FINV digital system (FINV IR Q3 2022 presentation)
As for the financial results in Q3, the net revenues for the third quarter grew to around RMB 3 billion, up 18% YoY and growing sequentially by 11.5% from Q2, delivering a non-GAAP operating profit of RMB 683 million - which, although lower by 3.8% from Q3 2021, still grew sequentially by 3.1.
Q3 2022 revenues (FINV IR Q3 2022 presentation)
Explanation of My Technical Analysis Toolbox
I will analyze FinVolution from a perspective of a number of technical analysis tools and show the screenshots on the monthly, weekly, and daily Heikin Ashi candles charts - each timeframe presented through two separate sets of indicators - which I will complement with a simplified daily Renko chart.
The first chart setup (I will call it Chart 1) uses Bill William's Alligator indicator and Awesome Oscillator, as well as Ichimoku Clouds and On Balance Volume indicator line. For fundamentals, I show the quarterly revenue trend which I use for a quick visual triage.
The Alligator technical analysis tool uses three smoothed moving averages that are based on thirteen, eight, and five periods, called also Jaw (blue line), Teeth (red line), and Lips (green line), respectively. Due to the smoothing of each moving average, the Jaw makes the slowest turns and the Lips make the fastest turns. The Lips crossing down through the other lines signals a short opportunity while crossing upward signals a buying opportunity.
William's Awesome Oscillator (AO) is a market momentum tool that visualizes a histogram of two moving averages, calculated on median prices of a recent number of periods compared to the momentum of a larger number of previous periods. If the AO histogram is crossing above the zero line, that's indicative of bullish momentum. Conversely, when it crosses below zero, it may indicate bearish momentum.
As for the Ichimoku Cloud - I am not using a full set of lines of Ichimoku lines, only the Leading Spans A and B, whose crosses dictates the color of the Cloud and whose individual lines provide levels of the strongest support and resistance lines. Ichimoku averages are plotted into the future which in its own right provides a clearer picture but has no predictive powers.
On-Balance-Volume (OBV) indicator is a volume-based tool and is supposed to indicate the crowd sentiment about the price. OBV provides a running total of an asset's trading volume and indicates whether this volume is flowing in or out, especially when viewed in divergence with the price action.
The second chart setting (Chart 2) uses 2 moving averages (10- and 50-period), volume, and volume's 20-period average. On the screenshot from top to bottom, you will see the Composite Index Divergence Indicator (CIDI), which I learned from the book of Constance Brown, as well as J. Welles Wilder's Directional Movement Indicator (DMI). I also use MACD (Moving Average Convergence Divergence) which is well known to everybody: I seek crossovers of MACD and signal, as well as above/below the zero level.
CIDI comes from a combination of RSI with the Momentum indicator. For more literature, see Brown's paper or read her book. CIDI has been developed to solve the problem of RSI not being able to show divergence. I personally use the CIDI's crossover above and below its slow- and fast-moving averages, as well as the position of the averages against each other.
As for DMI, I skip the ADX line because it doesn't give me anything. Instead, I focus on the crossovers of the Positive Direction Indicator DI+ and Negative Direction Indicator DI-. When the DI+ is above DI-, the current price momentum is upwards. When the DI- is above DI+, the current price momentum is downwards.
On the use of Heikin Ashi candles and Renko boxes, I use them as tools for trend reversal and continuation identification. Renko charts do not have a time scale and they are built on price movements that must be big enough to create a new box or brick. Similar to Heikin Ashi, Renko charts filter the noise.
As you might have guessed, my focus is on identifying the trend reversal and filtering the noise that allows the position continuation without the risk of too many false signals. However, I will be honest with you - I am not showing here all the technical indicators that I use for screening and analysis since they belong to my secret sauce.
The Long-Term Trend
For the long-term trend analysis, I use monthly charts. I am writing this article on January 1, so I cannot see yet in the chart the final drawing of the indicators' lines that would take into account the December inputs, but we can see the monthly December candle in Chart 1 below, with the close price of Friday, December 30, $4.96. And that's how the month ended, becoming the second green Heikin Ashi candle in this timeframe. The December candle "rests" in the Alligator's Lips line (green), which crosses the Teeth (red) line which in its turn is crossing above the Jaw (blue) line; indicating an uptrend set up according to this indicator. Ichimoku Cloud's lower edge is rising and the Cloud is narrowing, potentially leading to the switch of color from red to green. Awesome Oscillator seems to have finished in red, but still in a positive number. The OBV has risen in the last 2 months, it will be clear in a couple of days how it landed for December.
Chart 1 - Monthly (TradingView)
On Chart 2, we can appreciate that November readings for the Indicators have been upwards for CIDI (purple line above the fast green moving average and above the slow orange average), while the MACD line is approaching the signal from below. As for the DMI lines, the Positive Direction Indicator DI+ has remained above the Negative Direction Indicator DI- since the beginning of 2021. The volume in the last two months has also grown substantially, but without crossing its 20-month average.
Chart 2 - Monthly (TradingView)
The long-term trend seems to be readying for the breakout, based on the narrow range of trading in the last 6 months and the upwards turns of the lines of the indicators.
The Mid-Term Trend
As we can notice on Chart 1, the Ichimoku Cloud has already turned green and the strong edge of the red cloud around $5 is the resistance line that the stock needs to cross for the breakout. We can quite clearly see the formation of a box between price levels $4 - $5. Alligator's lines haves all set up upwards and are in the positive order of Lips above Teeth above Jaw. Awesome Oscillator's bars are all on similar levels, indicating a very lull period, but the rising OBV line shows that this could have been a period of accumulation. You can see my old trendline coming from the top of the mid) June 2021 candle and coinciding with the end-May 2022 candle closing above the Alligator's Lips line. Remember that these crossings are no magic and can be arbitrarily manipulated by the choice of support points, but in this case, it has just ended up like this without my intervention. A grain of salt is needed, however.
Chart 1 - Weekly (TradingView)
On Chart 2, we can appreciate that the 10-week MA crosses the 50-month MA around mid-October and both lines are slightly rising. CIDI is boldly perking up and above both fast and slow averages - the former approaching the latter from below. Weekly MACD is above the zero level and above its signal, both positive signs. The Positive Direction Indicator DI+ has remained above the Negative Direction Indicator DI- since May and the current distance between them is the widest since possibly indicating the growing strength of the uptrend building up.
Chart 2 - Weekly (TradingView)
The Short-Term Trend
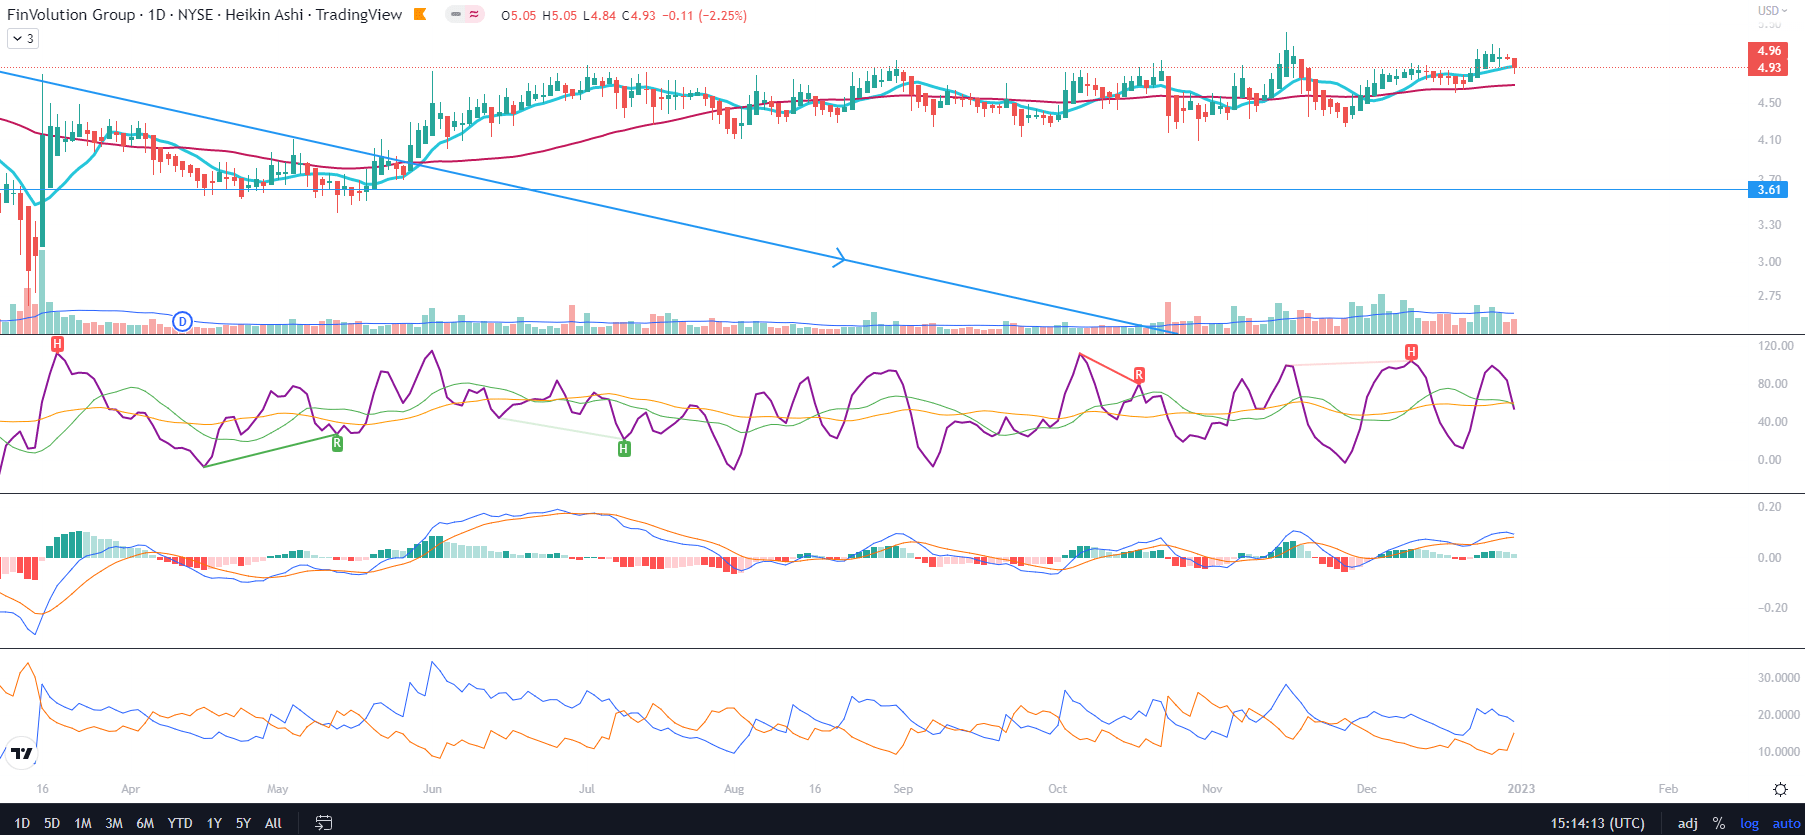
As we can see on Chart 1, on the daily timeframe the price of FINV has been showing the choppiness within the box, with Ichimoku Cloud's color, Awesome Oscillator levels, and Alligator's lines moving back and forth. The only calm trend has been in the OBV line, steadily growing, especially in the last two months.
Chart 1 - Daily (TradingView)
As for the picture on Chart 2, we can appreciate the abovementioned choppiness on CIDI, MACD, and DMI, but the positive signals are being given away by the rising of the slopes of the moving averages (including the lows of the 10-day MA getting higher lows and higher highs), while the positive volume along December has crossed the average, with selling volume keeping weak.
Price Momentum
On the Renko chart, the reading of MACD crossing its signal in June is curiously similar to the cross-over from January 2021, when the stock started its 260% rally. Nothing is guaranteed on this occasion, but this technical setup of MACD emerging almost like a diver and swimming to the zero level is the most promising when it comes to the chances of an explosive breakout.
Renko chart - Daily (TradingView)
Conclusions
For those who are willing to invest in Chinese companies and with the stomach to venture into the geo-political waters, FinVolution could be a valuable addition to the watchlist. According to my technical analysis, the stock is on the cusp of a breakout and it has been approaching it in a very unassuming way which can surprise the investors the more. I am planning to add to my existing position some dozens of this stock during the first week of January once the market re-opens.
For further details see:
Things To Know About FinVolution Before It Breaks Out (Technical Analysis)