WY - Third Avenue Real Estate Value Fund Q3 2023 Portfolio Manager Commentary
2023-10-26 11:45:00 ET
Summary
- Third Avenue Management is a New York City-based asset manager founded in 1986 that utilizes a disciplined, value-oriented, and asset-based approach to investing in publicly traded securities.
- The Third Avenue Real Estate Value Fund generated a return of +2.15% for the first nine months of the year, outperforming its benchmark.
- The Fund's performance was driven by gains in certain US and international real estate-related businesses, but offset by investments in economically sensitive areas.
- The Fund has a long-term focus and has generated an annualized return of +7.93% since its inception over 25 years ago.
Dear Fellow Shareholders,
We are pleased to provide you with the Third Avenue Real Estate Value Fund’s ( TAREX , the “Fund”) report for the quarter ended September 30, 2023. For the first nine months of the calendar year, the Fund generated a return of +2.15% (after fees) versus -4.12% (before fees) for the Fund’s most relevant benchmark, the FTSE EPRA NAREIT Developed Index. 1
The primary contributors to performance during the quarter included certain U.S.-based real estate-related businesses (FNF Group and U-Haul Holding Company) and international real estate operating companies (Wharf Holdings and Berkeley Group). Notwithstanding, these gains were more than offset by detractors during the quarter, which primarily included the Fund’s investments in areas that are perceived to be more “economically sensitive” such as real estate services (CBRE Group and JLL) and homebuilding (Lennar Corp. and D.R. Horton)—despite these businesses possessing super-strong balance sheets and prospects to gain significant market share over time.
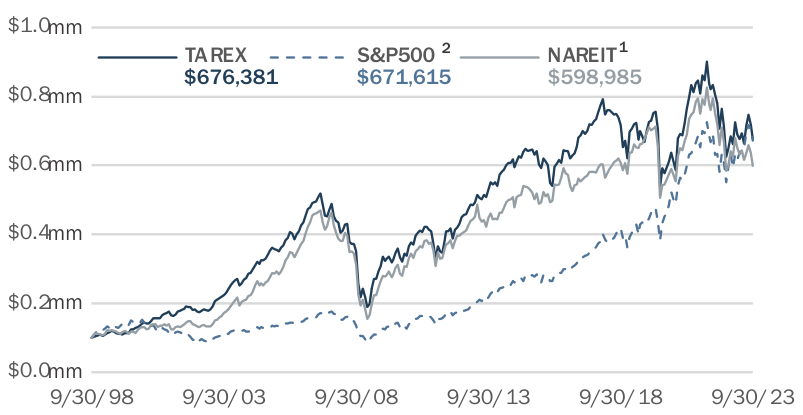
Even though the Fund has outperformed its most relevant benchmark more recently, Fund Management maintains the view that the strategy’s long-term results are the most relevant scorecard. To that end, the Fund has generated an annualized return of +7.93% (after fees) since its inception more than twenty-five years ago. As a result, this performance indicates that an initial investment of $100,000 in the Fund would have a market value in excess of $675,000 (assuming distributions had been reinvested), or more than the same $100,000 would be worth had it been placed into a passive mutual fund tracking the Fund’s aforementioned benchmark (as well as the S&P 500) over the same time period. Further perspective on the key drivers of this performance are included herein, along with more details on the Fund’s additions to Sun Communities Inc. and Big Yellow plc, and overall portfolio positioning.
VALUE OF $100,000 SINCE SEPTEMBER 1998
| As of September 30, 2023 Hypothetical Investment since September 30, 1998 (Fund Inception Date September 17, 1998). Past performance does not guarantee future performance results. |
Activity
At the end of July, the Office of Debt Management at the Department of the (U.S.) Treasury provided its Fiscal Year 2023 Q3 Report to the Treasury Borrowing Advisory Committee (“TBAC”). Within the presentation, TBAC was provided with an overview of various items, including the Treasury’s recent financial results, certain forecasts, and recommendations on financing. Most notably though, the Office of Debt Management revised certain figures from the previous quarter and projected that the Treasury’s current annual deficit (which is amongst the largest on record as a percentage of Gross Domestic Product) would largely be maintained for the next decade. In addition, TBAC received the recommendation that the Treasury fund these shortfalls by increasing its issuance of longer-dated U.S. Treasury Notes. Alongside these revelations, the capital markets recalibrated their supply-and-demand expectations for Treasuries, leading to longer-dated U.S. Notes (i.e., 10-Year and 30-Year) selling off by nearly 20% in price in the weeks after, with long-dated Treasury yields increasing by more than 1.00% and reaching their highest levels in more than 15 years. Such moves are rare, let alone when “inflationary pressures” were reported to have moderated during the same time period as measured by the Bureau of Labor Statistics Consumer Price ((CPI)) Index.
In actuality, this shift represented a reset in “real rates”, which is the difference between the nominal yields for U.S. Treasuries and overall inflationary expectations. It is also a development that has reverberated throughout the broader capital markets as the 10-Year U.S. Treasury is considered to be the benchmark rate for debt markets globally and “the most important asset in the world” according to former Fed Governor Kevin Warsh. As a result, yields for other fixedincome securities factored in the adjustment in “real rates” during the quarter, impacting the prices for most “interest-rate sensitive” investments globally, including listed real estate.
In terms of the impact on commercial real estate markets, this adjustment in “real rates” will undoubtedly lead to more elevated costs of capital and reduced property values in the near-term—which will be particularly troubling for real estate enterprises with significant amounts of debt or meaningful near-term maturities. On the other hand, these developments seem to offer certain silver linings for distinct pockets of the commercial real estate industry, including (i) well-capitalized market participants with limited debt maturities as well as excess capital to deploy as investment opportunities arise, (ii) investors in listed real estate as the impact of higher discount rates has seemingly been factored into security prices and now offers a historically attractive basis when measured on most fundamental valuation metrics, and (iii) owners of strategic real estate assets as more restrictive lending terms will likely lead to a lack of new construction, serving to further tension the supply-and-demand picture, which could result in outsized rent growth in certain instances over the medium-term.
This final point is worth expanding on as the return potential of income-producing real estate with “pricing power” is often misperceived in a higher interest rate environment, in our opinion. For instance, if one were to hypothetically purchase 3 a portfolio of single-family rental properties at a 6.00% nominal cap rate (i.e., the “initial yield”) and the income stream were to increase by 4.00% per year, on average, over a 5-year holding period, then one would realize a return of approximately 10.00% provided the “exit” cap rate (i.e., the yield at the end of the investment period) remained at the same level—even after taking out an additional 15% expense for management fees and maintenance costs along the way. In fact, the portfolio would provide a return in excess of 5-Year U.S. treasuries (4.75%) provided the “exit” cap rate remained below 7.90% in the scenario outlined above, thus allowing for nearly a 2.00% increase in cap rates over the holding period.
Put otherwise, income-producing real estate can provide an attractive “real return” even in a higher interest rate environment—provided it has “pricing power” and modest levels of “cap ex 4 ” and “corporate overhead”. It is for these reasons, among others, that the Third Avenue Real Estate Value Fund has concentrated its “income-producing” real estate investments into very well-capitalized enterprises with similar characteristics and distinct supply-and-demand drivers (e.g., emerging self-storage platforms, industrial real estate portfolios with “below-market” rents, premier mixed-use destinations, and niche residential rental businesses). It is also the framework for the Fund’s additions to Sun Communities Inc. and Big Yellow plc during the quarter.
Founded in the mid 1970’s, Sun Communities Inc. (“Sun Communities” or “Sun”) is the largest single owner of Manufactured Housing (“MH”) and Recreational Vehicle (“RV”) communities in North America, with more than 500 properties comprised of nearly 150,000 leasable sites, and a particular focus on the Sunbelt and Midwest regions of the U.S. The company is also the largest owner of marinas in the U.S. with 135 locations and nearly 50,000 slips, as well as investments in the MH and RV space internationally, primarily through its wholly-owned subsidiary Park Holidays in the U.K. and 10% stake in separately-listed Ingenia Communities in Australia (also held in the Fund).
As outlined in greater detail within the Fund’s previous shareholder letter , these niche property types principally lease land sites (and power access) to MH and RV owners and have historically enjoyed steady demand, restricted supply, and limited maintenance costs. As a result, Sun Communities has proven capable of keeping occupancy rates above 95.0% over the past 10 years, on average, and has increased revenues (on a per-site basis) by more than 6.0% per year during that same time period, also on average—most of which has dropped to the “bottom line” given the limited reinvestment required. Consequently, Sun has been amongst the leaders in the REIT industry in terms of cash flow 5 growth and hardly ever “gets cheap” per se.
That said, Sun’s common stock has underperformed more recently. In our opinion, this not only stems from a more recent increase in borrowing and insurance costs, but is also due to the overhang of Sun’s rapid acquisition activity. Historically a very focused company, Sun has increased its exposure to international markets, as well as more volatile revenue streams relative to its traditional MH and RV businesses through a series of investments in recent years. Therefore, the company’s shares now trade at a sizable discount to its closest peer, as well as a conservative estimate of Net-Asset Value (“NAV”), in our view.
It is therefore not inconceivable that Sun’s aligned control group gets “back to basics” and refocuses the company on the core MH and RV communities in the period ahead. In the meantime, the Fund owns Sun common stock at prices that imply a cap rate in excess of 6.00%—nearly the highest initial yield in more than a decade—despite management indicating at an industry conference that they expect rental rate growth of 4-8% across the company’s key segments at the same time that manufacturing wages (a key factor in MH rents) seem to be accelerating at an even more rapid clip.
Founded in 1988, Big Yellow (“Big Yellow”) is a U.K.-based REIT that owns and operates a portfolio of 108 self-storage facilities spanning 6.3 million square feet of total space, which is primarily concentrated in London and the Southeast region of the U.K. The company is also very well-capitalized with a loan-tovalue ratio of approximately 15%, a fixed-charge coverage of nearly 6.0 times, and modest capital commitments.
Fund Management remains fond of the self-storage business as this property type tends to provide remarkably steady cash flows once leased up, while at the same time requiring minimal ongoing capital expenditures. Further, should a tenant not pay rent, the items in storage can be sold off and the space can be subsequently re-leased. Self-storage is also one of the few property types that have legitimate scale advantages as companies that control platforms can operate much more efficiently than independent owners due to various operating synergies and also significantly lower customer acquisition costs (when viewed on a per unit basis) given the transition to online procurement in recent years.
Notwithstanding, the primary drawback for self-storage facilities is that it is considered to be amongst the easiest property types to build (alongside industrial). However, Big Yellow has a unique position as the leading owner in a region with significantly less competition than its U.S. peers, as well as more restricted building codes in its core markets (i.e., there is estimated to be less than two square feet of self-storage space per capita in the U.K. relative to more than nine square feet in the U.S.). Moreover, due to the vast majority of its portfolio having been acquired or developed within the past decade, its occupancy rates have yet to reach stabilization providing a unique opportunity to match the utilization of its more established U.S. peers (i.e., Big Yellow’s portfolio-wide vacancy rate was reported to be more than 19% in its most recent financials relative to approximately 6% for the established US self-storage REITs).
When considering the fundamental backdrop (e.g., expanding awareness, demand from small business, population growth, et al), it seems as if Big Yellow has the potential to increase its portfolio occupancy rates towards 90.0% over time—which would likely allow the company to match the 7.0% increase in revenues it has posted, on average, over the last 10 years. Industry followers would also likely point out that such a development would also have a disproportionate impact on the underlying cash flows given the “fixed-cost” nature of selfstorage facilities (i.e., operating margins for its recently integrated facilities are less than 60% relative to margins for its more stabilized facilities of 74%).
Meanwhile, Big Yellow common stock trades at prices which imply an approximate 7.30% cap rate on the existing portfolio with only a slight uplift to the book value 6 of its development pipeline. In Fund Management’s opinion, this price seems very modest relative to a reasonable estimate of Net-Asset Value, as well as significantly in excess of the 5.00% estimated cap rate that Nuveen recently agreed to acquire Self Storage Group ASA (a Nordic self-storage platform) for despite that entity having substantial ground leases relative to 99% of Big Yellow’s locations now being controlled under “fee-simple” arrangements.
Outside of these additions, the Fund’s other activity was modest in nature and included a slight addition to Savills plc, as well as reductions to certain holdings for portfolio management purposes (Lennar Corp., D.R. Horton, Prologis, Segro, Weyerhaeuser and Rayonier). The Fund also extended out its hedge relating to its Hong Kong Dollar exposure during the period.
Positioning
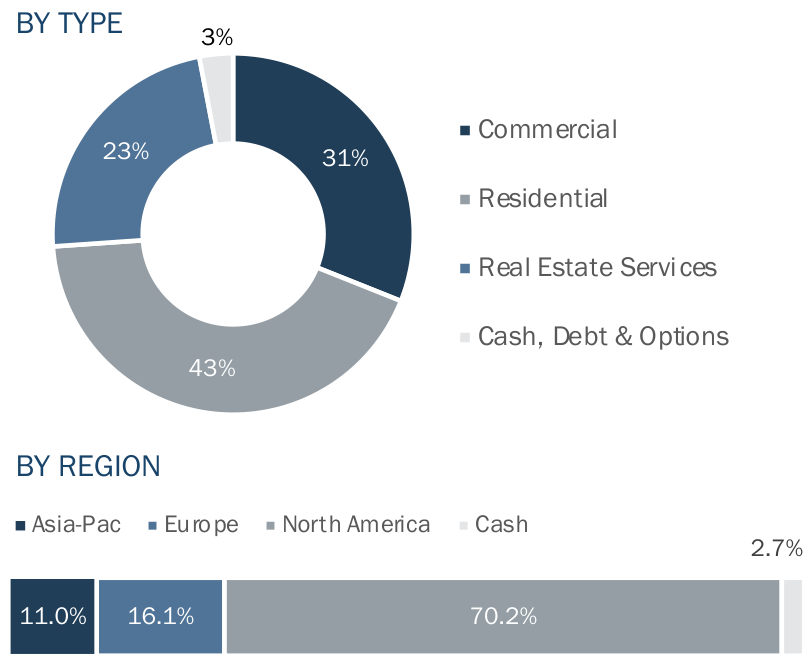
After factoring in this activity, the Fund had approximately 43% of its capital invested in Residential Real Estate companies with strong ties to the U.S. and U.K. residential markets— wherethere remain supply deficits after years of under-building. In conjunction with near record-low inventory levels, there also remains significant demand for new product at affordable price points (both for-sale and for-rent). Therefore, these Fund holdings seem positioned to benefit from a multi-year recovery in residential construction and ancillary activities, particularly as mortgage rate volatility subsides. At the end of the quarter, these holdings included a diversified set of businesses including homebuilding (Lennar Group and DR Horton), timberland ownership Aand management (Weyerhaeuser and Rayonier), planned development (Berkeley Group and Five Point Holdings), niche rental platforms (AMH, Grainger plc, Ingenia Communities, and Sun Communities), as well as other ancillary businesses (Lowe’s and Trinity Place Holdings).
The Fund also had 31% of its capital invested in Commercial Real Estate enterprises that are involved with very-select segments of the property markets. At the current time, these holdings are primarily focused on companies seemingly capitalizing on secular trends, including structural changes driving more demand for industrial properties, self-storage facilities, and last-mile fulfillment (Prologis, U-Haul, Segro plc, First Industrial, InvenTrust, Big Yellow, and National Storage) as well as the further densification and improvements taking place in select urban corridors (CK Asset Holdings and Wharf Holdings). In Fund Management’s view, each of these enterprises is very well-capitalized, their securities trade at discounts to private-market values, and they seem capable of providing compelling “real returns” in the face of higher interest rates—primarily by increasing rents, undertaking development activities, and by making opportunistic acquisitions.
An additional 23% of the Fund’s capital is invested in Real Estate Services. These real estate-related businesses are generally less capital-intensive than direct property ownership and consequently have offered much higher returns on capital over the course of a cycle—provided they have favorable positioning within their respective segments. At the present time, these holdings include franchises involved with brokerage and property management (CBRE Group, Savills plc, and JLL), investment management (Brookfield Corp. and Brookfield Asset Management), as well as mortgage and title insurance (FNF Group and the GSEs).
The remaining 3% of the Fund’s capital is in Cash, Debt & Options. These holdings include U.S.-dollar based cash and equivalents, short-term Treasuries, hedges relating to certain foreign currency exposures (Hong Kong Dollar), and an investment in the Senior Unsecured Notes of Five Point Holdings. The Fund’s allocations across these various business types are outlined in the chart below, along with the exposure by geography (North America, Europe, and sia-Pacific). In addition, the discount to Net-Asset Value (“NAV”) for the Fund’s holdings, when viewed in the aggregate, expanded to approximately 26.1% at the end of the quarter by Fund Management’s estimates, and the holdings remain very wellcapitalized (in Fund Management’s view) with an average loan-to-value ratio of 16% at the present time.
ASSET ALLOCATION
As of September 30, 2023 | Source: Company Reports, Bloomberg
Fund Commentary
During the quarter, the Third Avenue Real Estate Value Fund celebrated its 25th year of operations. As a result, the strategy now has one of the most established track records in real estate securities and has remained unique relative to other Real Estate Mutual Funds during that time span, in our view, by:
- Maintaining a Long-Term Value Focus and concentrating its capital on well-financed real estate and real estate-related businesses with securities trading at prices below their private-market values or Net-Asset Value, while emphasizing businesses that can compound corporate net worth. The Fund also tactically invests in other bargain priced securities across the capital structure (e.g., bonds, loans, preferred equity, et al) when there are opportunities to earn “equitylike” returns “higher up” in the capital stack.
- Emphasizing Total Return with a bias towards capital appreciation over current income with the view that this is a more effective way to compound capital over time. As a result, the Fund has focused more on real estate operating companies (that could retain their cash flow and reinvest in the business) as opposed to REITs (which are required to distribute their earnings and largely depend upon raising new capital to expand their business).
- Utilizing a Flexible Mandate which has allowed the Fund to invest in a wider set of real estate companies than most peers who tend to focus on companies included in relevant benchmarks. With the ability to invest in real estate operating companies, REITs, and real estate-related businesses, the Fund’s investable universe is likely two to three times larger than most real estate Funds leaving the Real Estate Value Fund with unique holdings and an “Active Share 7 ” often exceeding 90%.
- Actively Managing the portfolio by concentrating the Fund’s capital around a select set of securities (30-40 positions) irrespective of property type or region, as well as by holding cash when opportunities meeting Third Avenue’s strict value criteria are not available. The Real Estate Value Fund will also occasionally implement options strategies to hedge certain exposures and enhance the potential risk-adjusted return profile of the Fund.
Although these core tenets of the Real Estate Value strategy have remained unchanged since its 1998 inception, the process by which it is implemented has been enhanced over the years on three key fronts. One, the strategy expanded its opportunity set by pursuing value investments in select international markets, which have been additive to returns for nearly two decades now. Two, the Fund has remained concentrated—but more prudently than early on with stricter portfolio construction guidelines relating to position size, geographic exposure, and property type allocations. And three, the day-to-day management of the Fund has transitioned to a team-based effort, which utilizes a well-defined and repeatable process, making it more durable over the long-term (our primary focus).
The results of this evolution have been satisfactory. To wit, the Third Avenue Real Estate Value Fund had generated an +8.15% annualized return at its twenty-five-year mark, exceeding its primary index as well as the S&P 500 Index over that extended period of time. The results also support Third Avenue’s long-held view that an actively managed fund with a sound strategy, robust process, and aligned portfolio management team has strong prospects to outperform relevant benchmarks over the long-term, on average, and most of the time.
Notwithstanding, Fund Management believes in “continuous improvement”, including using its experience to draw upon “lessons learned” with the goal of further enhancing the process and potential results in the years ahead. With that being the case, Fund Management recently revisited some of the largest contributors and detractors to performance over the years and found three indistinguishable themes on each side of the ledger. In terms of types of investments that have detracted from performance since the Fund’s inception, the primary allocations have included:
-
- Real Estate enterprises with development-led business models—particularly those with large-scale projects that seem to inevitably take longer and cost more over time, thus diminishing returns. This has especially been the case for smaller-sized companies without substantial recurring cash flow to cover the “carry costs”, leaving Net-Asset Values diminishing quicker than budgeted for even with “overly-conservative” underwriting estimates.
- Mortgage REITs that traded at significant discounts to book value but ultimately faced structural issues given the mismatch between dividend requirements and free cash flow, as well as more substantial leverage levels relative to more traditional REITs or operating companies. Such entities were held modestly in the time period leading up to the “financial crisis” and have not been included in the Fund since.
- Retail REITs, predominantly those involved with the ownership and management of regional malls that have faced secular challenges for the better part of a decade given the rise in e-commerce and “open air” retail. The “higher-and-better-use” opportunities within this allocation proved especially challenging (i.e., conversion of department stores) and has left Fund Management skeptical of the “office-to-residential” opportunities currently being contemplated by certain entities.
Conversely, the allocations that could be characterized as the key drivers of performance over the past 25 years primarily include:
-
- Well-capitalized Real Estate Operating Companies that have compounded Net-Asset Value at above-average rates over long periods of time, not only by running efficient operations, but frequently engaging in resource conversion. Such activities are underappreciated by earnings-based investors (in our view) and have included timely mergers, acquisitions, capital infusions, spin-offs, major share repurchases and special dividends—creating significant wealth for stakeholders in the process.
- Real Estate-related businesses with leading franchises or platforms in their respective industry segments. These holdings have benefited from very strong financial positions, aligned management teams, limited reinvestment requirements and largely included (i) real estate services businesses within commercial real estate and (ii) residential-centric businesses that operate in segments of the value chain that seem to have “duopoly” like characteristics. “Special situation” investments that have predominantly included the common stocks of companies eventually “taken over” at substantial premiums, as well as capital structure investments in entities that were out-of-favor but still cash generative. In both cases, these holdings tended to possess quasi “time arbitrage” elements as the Fund was “paid to wait” through either value creation, current yield, or a combination thereof during the holding period.
While such investments haven’t represented all of the contributors (or detractors), one should expect the Fund to eschew those that could be characterized by the former, while concentrating more capital around the latter—when the price-to-value proposition is appropriate. Coincidentally now seems to be one of those moments and frankly very similar to when the Fund was launched in 1998 in a number of respects with (i) the S&P Index trading at above-average earnings multiples, (ii) Real Estate securities seemingly out-of-favor, and (iii) 10-Year U.S. Treasuries yielding around 5.00%. Similar to then, it also seems to be an opportune time to own “real assets” at modest valuations with prudent leverage, and to the extent the next few years of performance mirror those first few years of the strategy, it may prove to be a rewarding time to be invested in the Fund. However, Fund Management would be disappointed if the results were not even better given the “lessons learned” along the way.
We thank you for your continued support and look forward to writing to you again at year-end. In the meantime, please don’t hesitate to contact us with any questions, comments, or ideas at realestate@thirdave.com .
Sincerely,
The Third Avenue Real Estate Value Team
| FUND PERFORMANCE |
| 3Mo |
| 1Yr |
| 3Yr |
| 5Yr |
| 10Yr |
| Inception |
| Inception Date |
| Third Ave Real Estate Value Fund (Inst. Class) |
| -5.53% |
| 8.14% |
| 3.36% |
| -1.17% |
| 2.47% |
| 7.93% |
| 9/17/1998 |
| Third Ave Real Estate Value Fund (Inv. Class) |
| -5.60% |
| 7.84% |
| 3.11% |
| -1.42% |
| 2.21% |
| 4.96% |
| 12/31/2009 |
| Third Ave Real Estate Value Fund (Z Class) |
| -5.54% |
| 8.20% |
| 3.46% |
| -1.08% |
| N/A |
| -1.71% |
| 3/1/2018 |
TOP TEN HOLDINGS |
| Lennar Corp. ( LEN ) |
| 6.6% |
| D.R. Horton, Inc. ( DHI ) |
| 5.8% |
| U-Haul Holding Co. ( UHAL ) |
| 5.6% |
| Brookfield Corp. ( BN ) |
| 5.6% |
| CK Asset Holdings, Ltd. ( CHKGF ) |
| 4.6% |
| Berkeley Group Holdings PLC ( BKGFY ) |
| 4.6% |
| Prologis, Inc. ( PLD ) |
| 4.6% |
| CBRE Group Inc. ( CBRE ) |
| 4.6% |
| Weyerhaeuser Co. ( WY ) |
| 4.6% |
| American Homes 4 Rent ( AMH ) |
| 4.1% |
| TOTAL |
| 50.7% |
| Allocations are subject to change without notice |
| This publication does not constitute an offer or solicitation of any transaction in any securities. Any recommendation contained herein may not be suitable for all investors. Information contained in this publication has been obtained from sources we believe to be reliable, but cannot be guaranteed. The information in this portfolio manager letter represents the opinions of the portfolio manager(s) and is not intended to be a forecast of future events, a guarantee of future results or investment advice. Views expressed are those of the portfolio manager(s) and may differ from those of other portfolio managers or of the firm as a whole. Also, please note that any discussion of the Fund’s holdings, the Fund’s performance, and the portfolio manager(s) views are as of September 30, 2023 (except as otherwise stated), and are subject to change without notice. Certain information contained in this letter constitutes “forward-looking statements,” which can be identified by the use of forward-looking terminology such as “may,” “will,” “should,” “expect,” “anticipate,” “project,” “estimate,” “intend,” “continue” or “believe,” or the negatives thereof (such as “may not,” “should not,” “are not expected to,” etc.) or other variations thereon or comparable terminology. Due to various risks and uncertainties, actual events or results or the actual performance of any fund may differ materially from those reflected or contemplated in any such forward-looking statement. Current performance results may be lower or higher than performance numbers quoted in certain letters to shareholders. Date of first use of portfolio manager commentary: October 13, 2023 1 The FTSE EPRA/NAREIT Developed Real Estate Index was developed by the European Public Real Estate Association ((EPRA)), a common interest group aiming to promote, develop and represent the European public real estate sector, and the North American Association of Real Estate Investment Trusts (NAREIT), the representative voice of the US REIT industry. The index series is designed to reflect the stock performance of companies engaged in specific aspects of the North American, European and Asian Real Estate markets. The Index is capitalization-weighted. 2 S&P 500 Index, or Standard & Poor’s 500 Index, is a market-capitalization-weighted index of 500 leading publicly traded companies in the U.S. 3 It does not represent the returns of any actual investment or take into account the effects of taxes, fees, or other expenses that would reduce returns. It should not be considered investment advice or a forecast or guarantee or future results. Illustrations of hypothetical principles have inherent limitations and cannot account for future economic conditions. Past performance does not guarantee future results. 4 Cap-ex: Capital expenditures are funds used by a company to acquire, upgrade, and maintain physical assets such as property, plants, buildings, technology, or equipment. (Source: Investopedia) 5 Cash flow: Cash flow is the after-tax earnings plus depreciation that functions as a measure of a firm's financial strength” (Source: Investopedia) 6 Book Value: Book value is the sum of the amounts of all the line items in the shareholders' equity section on a company's balance sheet. 7 Active Share: Active Share is the percentage of a fund’s portfolio that differs from the benchmark index. The MSCI World Index is an unmanaged, free float adjusted market capitalization-weighted index that is designed to measure the equity market performance of 23 of the world’s most developed markets. Past performance is no guarantee of future results; returns include reinvestment of all distributions. The above represents past performance and current performance may be lower or higher than performance quoted above. Investment return and principal value fluctuate so that an investor’s shares, when redeemed, may be worth more or less than the original cost. For the most recent month-end performance, please visit the Fund’s website. The gross expense ratio for the Fund’s Institutional, Investor and Z share classes is 1.18%, 1.44% and 1.10%, respectively, as of March 1, 2023. Distributions and yields are subject to change and are not guaranteed. Risks that could negatively impact returns include: overbuilding and increased competition, increases in property taxes and operating expenses, lack of financing, vacancies, environmental contamination and its related clean-up, changes in interest rates, casualty or condemnation losses, and variations in rental income. The fund's investment objectives, risks, charges, and expenses must be considered carefully before investing. The prospectus contains this and other important information about the investment company, and it may be obtained by calling 800-443-1021 or visiting Third Avenue Management . Read it carefully before investing. Current performance results may be lower or higher than performance numbers quoted in certain letters to shareholders. Third Avenue offers multiple investment solutions with unique exposures and return profiles. Our core strategies are currently available through '40Act mutual funds and customized accounts. If you would like further information, please contact a Relationship Manager. |
Editor's Note: The summary bullets for this article were chosen by Seeking Alpha editors.
For further details see:
Third Avenue Real Estate Value Fund Q3 2023 Portfolio Manager Commentary