UHAL - Third Avenue Real Estate Value Fund's Portfolio Manager Commentary Q2 2023
2023-07-20 10:21:00 ET
Summary
- Third Avenue Management is a New York City-based asset manager founded in 1986 that utilizes a disciplined, value-oriented, and asset-based approach to investing in publicly traded securities.
- For the first half of the calendar year, the Fund generated a return of +8.13% (after fees) versus +1.57% (before fees) for the Fund’s most relevant benchmark, the FTSE EPRA NAREIT Developed Index.
- The Fund also increased its position in the common stock of Jones Lang LaSalle Incorporated during the quarter.
Dear Fellow Shareholders:
We are pleased to provide you with the Third Avenue Real Estate Value Fund’s (the “Fund”) report for the quarter ended June 30, 2023. For the first half of the calendar year, the Fund generated a return of +8.13% (after fees) versus +1.57% (before fees) for the Fund’s most relevant benchmark, the FTSE EPRA NAREIT Developed Index 1 .
The primary contributors to performance during the quarter included the Fund’s investments in leading U.S.-based homebuilders (Lennar Corp. ( LEN ) and D.R. Horton ( DHI )), U.S.-based real estate services firms (CBRE Group and JLL), and the Preferred Equity of Fannie Mae and Freddie Mac (collectively the “GSEs”). Notwithstanding, this performance was modestly offset by detractors during the period, which primarily related to the Fund’s investments in certain international real estate enterprises (CK Asset Holdings ( CHKGF ), Segro plc ( SEGXF ), and National Storage REIT ( NSA )). Further details on these holdings, overall portfolio positioning, and the Fund’s recent additions to Sun Communities Inc. ( SUI ) and JLL ( JLL ) are included herein.
Despite positive performance so far this year, Fund Management maintains the view that the Fund’s long-term results are a more relevant scorecard given Third Avenue’s primary focus: compounding capital at above-average rates over longer periods of time. To that end, the Fund has generated an annualized return of +8.26% (after fees) since its inception nearly twenty-five years ago. As a result, this performance indicates that an initial investment of $100,000 in the Fund would have a market value in excess of $700,000 (assuming distributions had been reinvested), or more than the same $100,000 would be worth had it been placed into a passive mutual fund tracking the Fund’s aforementioned benchmark (as well as the S&P 500 2 ) over the same time period.
VALUE OF $100,000 SINCE SEPTEMBER 1998
As of June 30, 2023
Hypothetical Investment since September 30, 1998 (Fund Inception Date September 17, 1998). Past performance does not guarantee future performance results.
ACTIVITY
In May 2023, the investment and philanthropic community lost a true maverick with the passing of Samuel Zell (“Sam”). Widely regarded as the premier real estate investor of the past 50 years, Sam not only served as a trailblazer for the modern-day Real Estate Investment Trust (“REIT”) market, but he was also enormously successful in other industries, a champion for continued education, as well as an independent thinker with an unforgettable sense of flair.
Fund Management had the pleasure of meeting with Sam over the years, primarily alongside his frequent visits with Third Avenue’s late founder Marty Whitman and periodic participation in the firm’s Value Conference. Throughout those invaluable interactions, it was clear that Sam had an unmatched ability to quickly breakdown investment opportunities into key supply and demand drivers, while always weighing the price paid for an asset relative to its replacement cost as a proxy for return potential and stressing the value of “liquidity”. He also had a keen desire to “keep things simple”, even once suggesting that if an investment summary couldn’t fit on one page, it was “too complicated” for him.
As many can attest, Sam didn’t hold back many opinions either, including his view that most types of commercial real estate were more commodity-like in nature or “trading sardines” as he expressively referred to them in his notorious essay Modern Sardine Management (first published in the Spring/Summer edition of the 1986 Real Estate Issues). That said, Zell’s close followers likely recognize distinctive pockets of real estate that he regarded as an exception and held for the “long haul”—including the “land lease” sector, which is largely comprised of Manufactured Housing (“MH”) and Recreational Vehicle (“RV”) communities.
While not necessarily a “core” allocation for most property investors, these niche property types principally lease land sites (and power access) to MH and RV owners and have historically offered very resilient revenue streams due to three primary factors. One, demand has largely held steady for professionally-managed locations given an affordable price point at roughly $600 per month, on average. Two, supply has been incredibly limited with industry estimates of less than 0.2% of new additions per year, relative to other property types in the 2-4% range historically. And three, capital expenditures are more limited without meaningful investment in buildings and low levels of tenant turnover (e.g., MH residents stay for 15 years on average).
With such dynamics, sector-leaders Equity Lifestyle Properties (in which Zell owned a significant stake and served as Chairman for nearly 20 years) and Sun Communities have proven capable of keeping occupancy rates above 95.0% over the past 10 years, on average, and have increased revenues (on a per site basis) by more than 6.0% per year during that same time period, also on average—most of which has dropped to the “bottom line” given the limited reinvestment required. As a result, both companies have been amongst the leaders in the real estate industry in terms of cash flow growth (on a per share basis) and total shareholder return over the past decade—and therefore hardly ever “get cheap” per se. That said, the Fund had the opportunity to initiate a position in the common stock of Sun Communities during the quarter, as its recent divergence created a rare price-to-value disconnect in Fund Management’s opinion.
Founded by the Shiffman family in the mid 1970’s, Sun Communities Inc. (“Sun”) has been publicly-traded since 1993, and meaningfully expanded its platform over the past 40 years. In fact, Sun is now the largest single owner of Manufactured Housing and Recreational Vehicle communities in North America, with more than 500 properties comprised of nearly 150,000 leasable sites, and a particular focus on the Sunbelt and Midwest regions of the U.S. The company is also the largest owner of marinas in the U.S. with 135 locations and nearly 50,000 slips, as well as investments in the MH and RV space internationally, primarily through its wholly-owned subsidiary Park Holidays in the U.K. and 10% stake in separately listed Ingenia Communities in Australia (also held in the Fund).
Notwithstanding this valuable portfolio and a conservative capital structure (Sun’s loan-to-value ratio is less than 30%), the company’s common stock has underperformed this year. Insofar as Fund Management can infer, this somewhat stems from an increase in borrowing and insurance costs, but is largely due to the overhang of Sun’s rapid acquisition activity in recent years (i.e., Ingenia Communities stake, Safe Harbor Marinas, Park Holidays UK, et al). When pieced together, these investments have accounted for approximately $3.5 billion of outlays without a significant cash flow uplift in return (per share) when factoring in much-more elevated levels of corporate overhead and a lack of synergies across segments. Moreover, these capital allocation decisions have increased the company’s exposure to international markets, as well as more volatile revenue streams relative to its traditional MH and RV businesses. Consequently, the company’s shares have “de-rated” and now trade at a sizable discount relative to Equity Lifestyle, as well as a conservative estimate of Net-Asset Value (“NAV”), or private-market value, in our view.
It is therefore not inconceivable that Sun’s aligned control group (which includes long-time CEO Gary Shiffman who owns a significant amount of stock) gets “back to basics” and refocuses the company on the core MH and RV communities in the quarters ahead. While not all encompassing, such a path could involve: (i) the removal of “targeted acquisition levels” from executive compensation plans; (ii) launching efforts to realize cost efficiencies across the expanded platform; (iii) divesting certain international holdings when capital markets stabilize; and (iv) assessing the strategic positioning of its exceptional marina business in anticipation of further industry consolidation. In Fund Management’s view, each of these actions would likely contribute to an improved cost of capital on a standalone basis (e.g., an enhanced multiple), but likely have the most significant impact if undertaken in combination.
Such a path (and outcome) would also be similar to the Fund’s experience with other previously-held real estate enterprises that expanded internationally but ultimately elected to refocus on their core business and markets (e.g., Dexus Property Trust, Wereldhave NV, Taylor Wimpey, Westfield Group, et al). However, in this case, the Fund’s preference would be to maintain exposure to these very unique MH, RV, and marina assets for the long-term (similar to Zell’s)—particularly with the “mark-to-market” opportunity in marinas and the “higher-and-betteruse” potential in the RV and MH segments over time.
The Fund also increased its position in the common stock of Jones Lang LaSalle Incorporated (“JLL”) during the quarter. As outlined in greater detail within the previous shareholder letter, JLL is a U.S.-based Real Estate Services firm with leading positions in leasing, capital markets, property management, investment management, and “prop tech” services throughout a nearly unrivaled global network (the company has a presence in more than 80 countries across five continents).
While not widely held in other Real Estate funds, Real Estate Services firms have been a critical component of the commercial property markets for centuries, essentially acting as a “toll booth” on activity by advising property owners and occupiers on leasing, financing, and investment sales transactions. However, the traditional Real Estate Services model (centered on cyclical leasing and sales activities) now largely incorporates segments with significant recurring revenues and more defensive characteristics—including in JLL’s case: (i) a facilities management business with approximately 3.0 billion square feet of properties under management, (ii) an investment management business with more than $80 billion of asset under management, (iii) a loan servicing portfolio of more than $130 billion, and (iv) the leading debt advisory business globally.
Therefore, it is Fund Management’s view that these more durable revenue streams (and other streamlining efforts) will allow JLL to remain profitable, even in the face of its higher-margin leasing and transaction advisory segments remaining under pressure. Should this materialize, JLL would not only preserve its existing capital base, but likely return to (if not surpass) previous levels of profitability when real estate capital markets stabilize.
With the addition to JLL during the period, the Fund now has approximately 11% of its capital invested in Real Estate Services firms after factoring in CBRE Group ( CBRE ) and Savills plc ( SVLPF ) . In the aggregate, these three businesses seem to offer a unique exposure in listed real estate as they nearly act as an oligopoly on essential services and inevitable transactions in key regions. They also seem well-positioned within the overall industry dynamic. Put otherwise, each of these well-financed businesses seems likely to gain market share within their existing segments (likely at the expense of certain large and less credit-worthy participants), as well as capitalize on other secular trends and ancillary opportunities longer-term (e.g., outsourcing, sustainability, “flex” offerings, et al)— a framework that is not dissimilar from the insurance brokerage or title insurance industries post “financial crisis” in Fund Management’s opinion.
The Fund’s other activity during the period was modest in nature and included slight reductions to certain holdings for portfolio management purposes (Lennar Corp., D.R. Horton, Prologis ( PLD ), and InvenTrust Properties ( IVT )). The Fund also exited its position in the Unsecured Debt of Diversified Healthcare Trust in the quarter.
POSITIONING
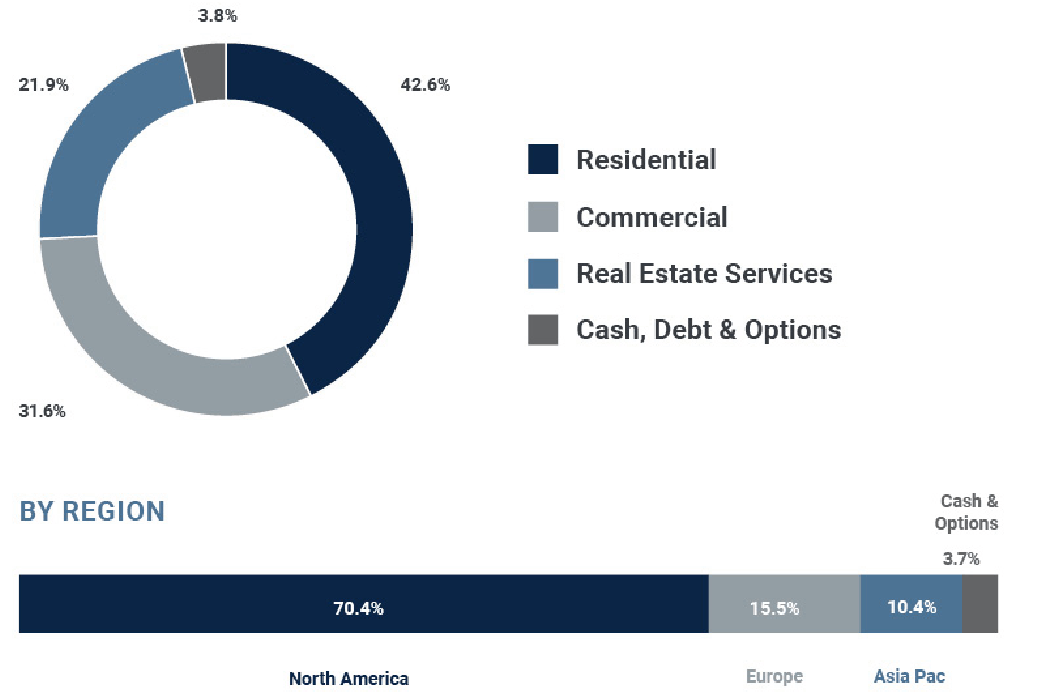
After incorporating this activity, the Fund had approximately 42% of its capital invested in Residential Real Estate companies with strong ties to the U.S. and U.K. residential markets—where there remain supply deficits after years of under-building. In conjunction with near record-low inventory levels, there also remains significant demand for new product at affordable price points (both for-sale and for-rent). Therefore, these Fund holdings seem positioned to benefit from a multi-year recovery in residential construction and ancillary activities, as further outlined in the Fund Commentary section herein. At the end of the quarter, these holdings included a diversified set of businesses including homebuilding (Lennar Group and D.R. Horton), timberland ownership and management (Weyerhaeuser and Rayonier), planned development (Berkeley Group ( BKGFY ) and Five Point Holdings ( FPH )), the ownership and development of rental properties ([[AMH]], Grainger plc ( GRGTF ), Ingenia Communities, and Sun Communities), as well as other ancillary businesses (Lowe’s ( LOW ) and Trinity Place Holdings ( TPHS )).
The Fund also had 32% of its capital invested in Commercial Real Estate enterprises that are involved with very-select segments of the property markets. For instance, these holdings are primarily capitalizing on secular trends, including structural changes driving more demand for industrial properties, self-storage facilities, and last-mile fulfillment (Prologis, U-Haul ( UHAL ), Segro plc, First Industrial ( FR ), InvenTrust, Big Yellow ( BYLOF ), and National Storage) as well as the further densification and improvements taking place in select urban corridors (CK Asset Holdings and Wharf Holdings ( WARFF )). In Fund Management’s view, each of these enterprises is very well-capitalized, their securities trade at discounts to private-market values, and they seem capable of further increasing NAV—primarily by increasing rents, undertaking development activities, and by making opportunistic acquisitions.
An additional 22% of the Fund’s capital is invested in Real Estate Services . As referenced above, these businesses are generally less capital-intensive than direct property ownership and consequently have offered much higher returns on capital over the course of a cycle—provided they have favorable positioning within their respective segments. At the present time, these holdings include franchises involved with brokerage and property management (CBRE Group, Savills plc, and JLL), investment management (Brookfield Corp. ( BN ) and Brookfield Asset Management ( BAM )), as well as mortgage and title insurance (FNF Group and the GSEs).
The remaining 4% of the Fund’s capital is in Cash, Debt & Options . These holdings include U.S.-dollar based cash and equivalents, short-term Treasuries, hedges relating to certain foreign currency exposures (Hong Kong Dollar), and an investment in the Senior Unsecured Notes of Five Point Holdings.
The Fund’s allocations across these various business types are outlined in the chart below, along with the exposure by geography (North America, Europe, and Asia-Pacific). In addition, the discount to Net-Asset Value (“NAV”) for the Fund’s holdings, when viewed in the aggregate, narrowed to approximately 19.9% at the end of the quarter by Fund Management’s estimates.
ASSET ALLOCATION AS OF JUNE 30, 2023
(allocations subject to change)
FUND COMMENTARY
In a quarter when most market participants were focused on “artificial intelligence”, many residential real estate professionals were concentrating on the “annual intelligence” provided in The State of the Nation’s Housing Report — a highly-regarded assessment of the U.S. residential markets published by the Joint Center for Housing Studies (“JCHS”) of Harvard University each year.
Truth be told, Fund Management is not aware of another publication that serves as a better starting point for assessing the fundamental backdrop of the U.S. housing markets. The report also advances the discussion around some of the key challenges in housing, including the existing supply deficit and potential ramifications of the more recent “refinancing wave”. For instance, the JCHS team observes in the 2023 Report that (i) “According to the Housing Vacancy Survey, homeowner vacancy rates remained at 0.8 percent in the first quarter of 2023, tied for the lowest reading since data became available in the mid-1950’s and under 1.0 percent for the ninth consecutive quarter” (chart below) and (ii) per the FHFA National Mortgage Database, “nearly two-thirds of outstanding residential mortgages carry an interest rate of less than 4 percent, including one-quarter of mortgages with interest rates below 3 percent— significantly lower than the 6-7 percent average on a 30-year fixed rate mortgage in early 2023.”
RECORD LOW LEVELS OF INVENTORY
U.S. rental and homeowner vacancy rates
Source: U.S. Census Bureau, Bloomberg.
Notwithstanding, JCHS reaches the conclusion that “rising mortgage costs have pushed homeownership out of reach for millions of renters at a time when large numbers of millennial households are at prime homebuying ages” and that “builders will struggle to expand home production significantly” as a result. While such a view is widely held, Fund Management tends to agree with Jude Wanninski, who asserts in his ever-important book The Way the World Works that “supply is defined as being demand”. Put otherwise, the private market economy will generally adjust production to meet demand absent any significant changes in regulation or taxes (i.e., the “wedge”).
As a matter of fact, the largest U.S.-based homebuilders have utilized their underappreciated scale to reduce average selling prices, offer other incentives (e.g., “rate buydowns”), and incorporate singlefamily rental into their product mix. The results? Large builders have defied expectations and met demand by increasing sales volumes so far this year—including the Fund’s core holdings Lennar Corp. and D.R. Horton. Such industry dynamics have also started to manifest themselves in more widely-followed data with: (i) residential construction reported to have increased by more than 20% so far this year (as measured by single-family housing starts per the U.S. Census Bureau) and (ii) new home sales taking significant share in terms of overall purchase activity (chart below) given a lack of “competition” from existing homes with 40% less listings than 2019.
NEW HOMES FOR SALE AS A SHARE OF TOTAL HOMES FOR SALE
Absent a significant reset in treasury yields, similar market dynamics could very well persist in Fund Management’s view. This is especially the case when considering that: (i) demand (as measured by the size of the U.S. population that is entering its “prime homebuying years” of ages 35-49 years) is expected to increase throughout the rest of this decade with the next three years (2024-2026) representing the largest expansion (chart below) at the same time that (ii) “remote working” has seemingly become more entrenched in working patterns thus placing a more significant premium on larger living accommodations and the single-family format per the Federal Reserve Bank study Remote Working and Housing Demand.
MILLENNIALS ARE AGING INTO PRIME HOME BUYING YEARS
Projected Population Growth
Source: U.S. Census Bureau, AMH June 2023 Investor Presentation.
For these reasons, and others, Fund Management remains constructive on the fundamental backdrop for U.S. housing, particularly the market dynamics supporting single-family construction, repair and remodel (“R&R”) spending, and niche rental platforms. Therefore, the Third Avenue Real Estate Value Fund is likely to maintain its significant (and unique) allocation to these distinct segments of global real estate—with one caveat. That is, the Fund will limit its investments to enterprises that are well-capitalized with securities available at prices that seem modest relative to conservative (and durable) estimates of Net-Asset Value. While such an approach may lead the Fund to forego certain opportunities amid this important moment for the residential markets, it is Fund Management’s opinion that such a practice will assist in guarding against any unexpected “wedges” in the years ahead.
We thank you for your continued support and look forward to writing to you again next quarter as the Fund commemorates its 25th anniversary. In the meantime, please don’t hesitate to contact us with any questions, comments, or ideas at realestate@thirdave.com .
Sincerely,
The Third Avenue Real Estate Value Team
IMPORTANT INFORMATION
This publication does not constitute an offer or solicitation of any transaction in any securities. Any recommendation contained herein may not be suitable for all investors. Information contained in this publication has been obtained from sources we believe to be reliable, but cannot be guaranteed.
The information in this portfolio manager letter represents the opinions of the portfolio manager(s) and is not intended to be a forecast of future events, a guarantee of future results or investment advice. Views expressed are those of the portfolio manager(s) and may differ from those of other portfolio managers or of the firm as a whole. Also, please note that any discussion of the Fund’s holdings, the Fund’s performance, and the portfolio manager(s) views are as of March 31, 2023 (except as otherwise stated), and are subject to change without notice. Certain information contained in this letter constitutes “forward-looking statements,” which can be identified by the use of forward looking terminology such as “may,” “will,” “should,” “expect,” “anticipate,” “project,” “estimate,” “intend,” “continue” or “believe,” or the negatives thereof (such as “may not,” “should not,” “are not expected to,” etc.) or other variations thereon or comparable terminology. Due to various risks and uncertainties, actual events or results or the actual performance of any fund may differ materially from those reflected or contemplated in any such forward-looking statement. Current performance results may be lower or higher than performance numbers quoted in certain letters to shareholders.
Date of first use of portfolio manager commentary: July 14, 2023
- The FTSE EPRA/NAREIT Developed Real Estate Index was developed by the European Public Real Estate Association ((EPRA)), a common interest group aiming to promote, develop and represent the European public real estate sector, and the North American Association of Real Estate Investment Trusts (NAREIT), the representative voice of the US REIT industry. The index series is designed to reflect the stock performance of companies engaged in specific aspects of the North American, European and Asian Real Estate markets. The Index is capitalization-weighted.
- S&P 500 Index , or Standard & Poor’s 500 Index, is a market-capitalization-weighted index of 500 leading publicly traded companies in the U.S.
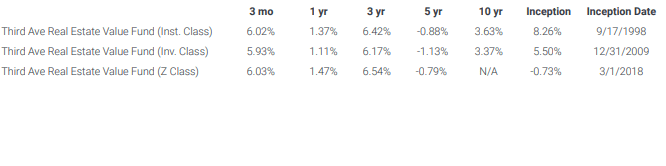
FUND PERFORMANCE
As of June 30, 2023
Top Ten Holdings
Allocations are subject to change without notice
Past performance is no guarantee of future results; returns include reinvestment of all distributions. The above represents past performance and current performance may be lower or higher than performance quoted above. Investment return and principal value fluctuate so that an investor’s shares, when redeemed, may be worth more or less than the original cost. For the most recent month-end performance, please visit the Fund’s website at www.thirdave. com. The gross expense ratio for the Fund’s Institutional, Investor and Z share classes is 1.18%, 1.44% and 1.10%, respectively, as of March 1, 2023.
Distributions and yields are subject to change and are not guaranteed.
Risks that could negatively impact returns include: overbuilding and increased competition, increases in property taxes and operating expenses, lack of financing, vacancies, environmental contamination and its related clean-up, changes in interest rates, casualty or condemnation losses, and variations in rental income.
Third Avenue Funds are offered by prospectus only. The prospectus contains important information, including investment objectives, risks, advisory fees and expenses. Please read the prospectus carefully before investing in the Funds. Investment return and principal value fluctuate so that an investor’s shares, when redeemed, may be worth more or less than the original cost. For updated information or a copy of our prospectus, please call 1-800-4431021 or go to our website at www.thirdave.com . Distributor of Third Avenue Funds: Foreside Fund Services, LLC.
Current performance results may be lower or higher than performance numbers quoted in certain letters to shareholders.
Editor's Note: The summary bullets for this article were chosen by Seeking Alpha editors.
For further details see:
Third Avenue Real Estate Value Fund's Portfolio Manager Commentary Q2 2023