LVMUY - Third Point First Quarter 2023 Investor Letter
2023-05-22 00:56:00 ET
Summary
- Third Point LLC is an SEC-registered investment adviser based in New York. The firm was founded in 1995 by Daniel S. Loeb, who serves as Chief Executive Officer. Third Point focuses on event-driven, value-oriented investing.
- During the First Quarter, Third Point returned -4.1% in the flagship Offshore Fund.
- Both areas of credit (corporate and structured) contributed positively to First Quarter performance.
Dear Investor:
During the First Quarter, Third Point returned -4.1% in the flagship Offshore Fund.
| Q1* |
| ANNUALIZED RETURN† |
| THIRD POINT OFFSHORE FUND, LTD. |
| -4.1% |
| 13.0% |
| CS HF EVENT-DRIVEN INDEX |
| 1.3% |
| 6.6% |
| S&P 500 INDEX ((TR)) |
| 7.5% |
| 8.6% |
| MSCI WORLD INDEX ((TR)) |
| 7.9% |
| 7.1% |
* Through March 31, 2023.
† Annualized Return from inception (December 1996 for TP Offshore and quoted indices.
The top five winners for the quarter were Salesforce Inc. ( CRM ), Advanced Micro Devices ( AMD ), LVMH ( LVMHF ), The Walt Disney Co. ( DIS ), and Microsoft Corp. ( MSFT ). The top five losers for the quarter were Fidelity National Information Services ( FIS ), American International Group Inc. ( AIG ), Bath & Body Works Inc. ( BBWI ), Glencore International plc ( GLCNF ) ( GLNCY ), and Alphabet Inc. ( GOOG ) ( GOOGL ).
Portfolio Review and Outlook
For the First Quarter of 2023, our returns lagged the indices despite strong performance from several new investments including Salesforce and AMD. The Quarter will be remembered for the failure of Silicon Valley Bank (SIVBQ) and the contagion that followed, which felt like the shoe finally dropping after twelve consecutive quarters of Fed tightening. It was shocking and yet predictable - like watching a rubber band being stretched and stretched until finally, it snaps. So far, four large banks have failed but despite this, the S&P rallied by 7.5% during the Quarter.
Sector dispersion was high, with Info Tech and Communications (which were down 29% and 40% in 2022) outperforming Financials and Energy by over 25%. Large-cap Tech companies that underperformed dramatically last year - such as NVDA, TSLA, META, AMD, and CRM - drove a disproportionate percentage of the gains for the overall indices (the equal-weighted S&P index was up only 2.6% in Q1). While we were on the right side in a few of these names, losses on the short side and in some Financials more than offset these gains, leading to disappointing results.
Existing positions in LVMH, Disney, and Microsoft gained while FIS, Bath & Body Works, and Colgate ( CL ) posted losses after their management teams lowered 2023 guidance despite reporting solid quarterly results. FIS and Colgate have both since "beat and raised" this guidance, indicating that many management teams are adopting very conservative tones in this uncertain macro environment. FIS and AIG were also hit by the indiscriminate defenestration of most Financials immediately following the collapse of SVB, but AIG has rallied nearly 8% from its lows, and our thesis, which we wrote about in our last quarterly letter, remains the same.
Shorts and hedges have been a significant drag on performance, costing us approximately 4% in the first quarter. Losses were both in single-name shorts that skyrocketed in January, as well as baskets and indices hedging some of our largest positions. We have re-evaluated the risk and sizing guidelines around shorts, eliminating many of the technical factors that caused this underperformance, dampening the "basis risk" and overall volatility from these efforts.
Looking ahead, we see some encouraging signs that inflation is moderating, especially in areas like freight, energy and commodities, supply chains, and even shelter. At the same time, labor markets remain stubbornly tight. While monetary policy has been firmly contractionary, fiscal policy remains incredibly supportive. With monetary policy and fiscal policy essentially pushing in opposite directions, monetary policy is likely to remain tight for longer than would otherwise be necessary. Asset prices are much more sensitive to monetary policy than fiscal, and so this push-pull dynamic is creating risk of the Fed "breaking things" in the asset markets, the long-looming concern we finally saw begin to manifest in the regional banking crisis.
Our strategy is to preserve liquidity and buying power to take advantage of markets when they "break". While overall indices remain elevated, we are finding more chances to provide liquidity across all three asset classes in which we invest - credit, structured credit, and equity - opportunities that have been key drivers of performance for the fund. Our portfolio is balanced across industries with a focus on event-driven names including companies involved in spin-offs, significant cost-cutting, or other types of under-appreciated business transformation. [[PCG]], which is still our largest position, continues to deliver strong performance, down 50bps in the first quarter but up 6.2% for the year to date after the Fire Victims Trust sold another 60 million shares in a block trade. Credit is particularly exciting, as we discuss in more detail below, and we are seeing ample opportunities in both asset-backed securities and corporate debt.
New Position: UBS
We initiated a position in the Op Co and Hold Co paper of Credit Suisse ( CS ) just prior to its takeover announcement by UBS ( UBS ). As one of the few funds remaining with the mandate to pick the "fulcrum security" across the capital structure, we determined that once the emergency rescue acquisition was announced, the equity of UBS presented the more compelling way to invest in this situation and rotated capital from CS bonds into UBS stock. We see the rescue of CS as a transformative deal for UBS at a highly compelling price and with downside-protected terms.
The pro forma UBS will be the second-largest global wealth manager and third-largest European asset manager, enhancing UBS's competitive positioning and scale in its most attractive capital-light and high return-on-equity businesses. The deal is highly synergistic - hence, UBS's early guidance that it can rationalize 50% of CS's existing expense base - but also creates additive geographic and product diversification. Credit Suisse adds to UBS's stronger footholds in Asia and Latin America and forges a more balanced asset management portfolio across traditional and alternative capabilities.
The deal came together over the course of a weekend, led by the Swiss government and regulators given the imminent risk of insolvency facing CS, and allowed UBS to acquire ~$35 billion of incremental tangible book value for ~$3.5 billion of stock. Credit Suisse's historic issues have been concentrated in its poorly risk-managed, loss-making Investment Banking division. We believe the primary execution risk around the deal is in the right sizing of this business. Alongside the highly accretive deal terms arising from the AT1 write-down and attractive purchase price, as added downside protection, the government is providing a ~$10 billion backstop for Non-Core Unit asset write-downs, following UBS's first loss of ~$5.5 billion.
We believe that early guidance will prove to be conservative, and we see significant upside as UBS integrates CS, realizing the significant cost synergies and completing the wind-down of non-strategic divisions.
New Position: Alphabet ((GOOGL))
Third Point initiated a position in GOOGL during the First Quarter. Fears around the potentially negative impact that AI and ChatGPT/MSFT may have on GOOGL's business created a unique entry point into one of the best consumer internet assets and businesses of our generation.
While ChatGPT has unquestionably captured the general public's attention (as well as several hundred million users), we believe the market underestimates GOOGL's own capabilities and opportunities in the emerging field of generative AI. GOOGL has been a leader in the broad field of AI for years, with the company's scientists pioneering several of the software and hardware innovations that underpin current advances, most notably the Transformer architecture in 2017 that served as a key building block for GPT-3. Fruits of these investments were visible at last week's developer conference, Google I/O, where GOOGL previewed their latest large language model (LLM) and an impressive slate of AI-powered product improvements across their Search, Maps, Gmail, Workspace, and Cloud offerings. We believe these new products now put Google on the offensive in the dawning age of AI, allowing it to further grow consumer engagement with Search, make its Workspace products more competitive against Microsoft Office, and differentiate its Cloud offerings to accelerate share gains from AWS and Azure.
We are also encouraged by GOOGL's commitment to "durably reengineer its cost base" to deliver sustainable and consistent margin expansion for investors. While GOOGL has been more measured than peers when it comes to public headcount reductions, we believe the market underestimates the impact of GOOGL's other initiatives such as optimizing compute infrastructure, rationalizing its real estate footprint, and leveraging AI to drive automation across the organization. While management has articulated that results of this effort will be most visible in 2024 onwards, the company's most recent financials already indicate change. Reported headcount additions of 477 in the First Quarter were the lowest in a decade, and growth in operating costs (excluding one-time severance and lease break fees) slowed to 8%, from over 20% just a few quarters ago.
The opportunity to rationalize Google's cost base cannot be understated. GOOGL's total costs sum to a staggering $170 billion (excluding traffic acquisition costs), of which we estimate $70 billion comes from full-time equivalent salaries and bonuses, leaving substantial room for improvement across all aspects of the organization. Seventy percent of GOOGL's revenues come from a business with 90% incremental margins (Search) yet consolidated operating margins last year were only 32%.
While we are pleased to see GOOGL management's stated plans to reorganize its operations to improve margins, we believe that more is possible, and further improvement should unfold in the coming quarters. We have shared our views on this topic with management, who seem amenable to considering further efficiencies and better deployment of capital. We were also glad to see improvement in the company's communications around its AI capabilities at the I/O conference, which received significant attention and helped buck the negative narrative that had formed around Google's status as a technological leader.
Credit
Both areas of credit (corporate and structured) contributed positively to First Quarter performance. While corporate credit spreads have been relatively range-bound generally, we continue to see periods of higher volatility that are creating interesting entry points. We took advantage of the broader market volatility created by the banking sector turmoil in March to add to existing positions on weakness and initiate new positions. In the banking sector itself, we initiated a new position in the credit of a super-regional bank and, as discussed above, successfully invested in the more senior operating and holding company bonds of Credit Suisse prior to its acquisition by UBS. Importantly, we avoided the subordinated securities with uncertain rights that we feared might be sacrificed to enhance the dowry for CS's suitor. Our CS investment was the result of fruitful collaboration between our equity and credit teams.
The corporate credit team is also working closely with structured credit on the CRE space. While it is early days for that unfolding opportunity, we have identified some situations that are attractive today in healthier CRE sectors (health care) and/or benefiting from flexible capital structures and time seniority. Later in the quarter, as the bank panic subsided, we took advantage of market strength and excellent operating performance to take profits in our cruise industry long holdings.
Structured Credit
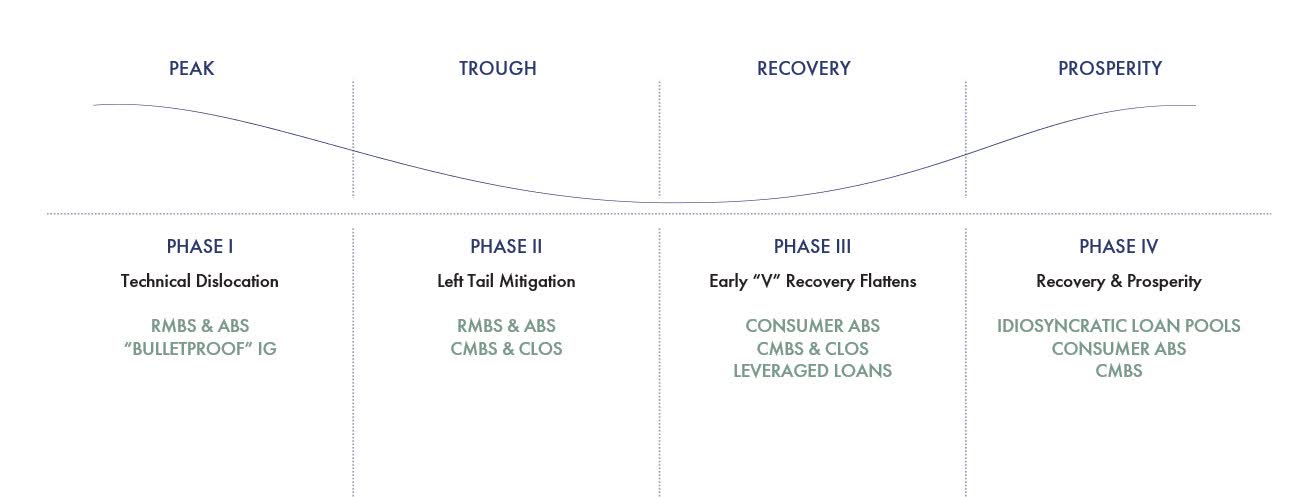
Within structured credit, residential mortgages and consumer credit outperformed to start the year, while CMBS underperformed given the well-publicized cracks finally emerging in the CRE sector. When we increased our exposure to the asset class in 2020, we believed that the COVID pandemic would result in a multi-year investment opportunity where consumer-sensitive asset classes would benefit and outperform in the first phase while corporate-driven asset classes would have delayed credit and liquidity issues. Our thesis for commercial real estate was that commercial real estate loans are effectively a bilateral negotiation between the borrower and lender that could enable multiple payment holidays for tenants and maturity extensions for borrowers which would obfuscate underlying changes in fundamentals. Higher interest rates combined with the secular changes in commercial real estate demand have been brewing for the last few years, but the dawn of strategic defaults and the need for liquidity has exacerbated the credit issues in commercial real estate and its related securitizations. The recovery phase or phase III of our chart from 2020 (below) is starting to emerge with opportunities in CMBS and CRE loans. The CRE market is approximately $5 trillion in size and the CMBS market is approximately $1 trillion. Regional banks own $2.5-3 trillion of CRE loans. While it is unclear whether banks will be forced to sell these loans, lending in CRE should tighten as the regional banks reduce exposure to the sector and pare down risk. This credit tightening should impact CMBS as properties have fewer refinancing options and may enter special servicing, creating credit defaults and further price declines.
Today, our current portfolio yield in structured credit is in the mid-teens, with a duration of 3 years. The portfolio has a 40% allocation to consumer ABS with exposure to private credit student loans, senior tranches of whole business securitizations, an amortizing pool of personal loans, and opportunistic purchases of solar and aircraft ABS. The remaining 60% of our portfolio is in residential mortgages, which consists of 10% non-qualified mortgage loans (coupons of about 8% and 750+ FICOs), 35% reperforming mortgage mezzanine tranches with positive convexity and upside in this rate environment, and 15% senior reperforming tranches, where we have been purchasing the senior tranches at a discount to par and control the ability to pay down the bonds at par.
We remain highly constructive on our residential mortgage trade because of the historically low loan-to-values, where borrowers have 40-50% equity in their homes locked at a fixed rate below 5%. Despite the steady rise in rates and 30-year fixed mortgage rates topping 7% earlier this year, we have seen home prices in our portfolio remain strong, along with pockets of refinancing when rates have dropped. We have invested in the reperforming mortgage trade for the last six years and have seen fewer loans go into the 60+ day delinquency queue than we saw during 2017-2019, which we believe reflects consumers' strong desire to hold onto their homes. Given the credit support at the asset level in residential mortgages and the potential path for rate cuts over the next twelve months, the reperforming mortgage exposure is well positioned from a credit and rate perspective.
Business Updates
We recently welcomed Jarrod Bruno to the Third Point team. Prior to joining Third Point, he spent four years at Ashler Capital (a division of Citadel) as an analyst investing in internet, video games, and payments. Before joining Ashler, he worked at Balyasny Asset Management as an analyst focused on TMT. He began his career as an investment banking analyst in the TMT group at Goldman Sachs. Mr. Bruno graduated summa cum laude from the Pennsylvania State University's Schreyer Honors College with a B.S. in Finance.
Sincerely,
Daniel S. Loeb, CEO & CIO
The information contained herein is being provided to the investors in Third Point Offshore Fund, Ltd. ("Offshore Fund"), Third Point Partners L.P. ("Partners"), Third Point Ultra Ltd., Third Point Ultra Onshore L.P., and Third Point Partners Qualified L.P. ("Partners Qualified") (collectively, the "Funds"). The Offshore Fund is a feeder fund to the Third Point Offshore Master Fund L.P. in a master-feeder structure. Third Point Ultra Ltd. and Third Point Ultra Onshore LP are feeder funds to the Third Point Ultra Master Fund L.P. in a master-feeder structure. Third Point LLC ("Third Point"), an SEC-registered investment adviser, is the Investment Manager to the Funds.
All information contained herein relates to the Third Point Offshore Master Fund L.P. unless otherwise specified. P&L and AUM information are presented at the feeder fund level where applicable. Performance, portfolio exposure, and other data included herein may vary among the Funds. Sector and geographic categories are determined by Third Point in its sole discretion.
Performance results are presented net of management fees, brokerage commissions, administrative expenses, and accrued performance allocation, if any, and include the reinvestment of all dividends, interest, and capital gains. While performance allocations are accrued monthly, they are deducted from investor balances only annually (quarterly for Third Point Ultra from 1997-2016) or upon withdrawal. From Fund inception through December 31, 2019, each Fund's historical performance has been calculated using the actual management fees and performance allocations paid by the Fund. The actual management fees and performance allocations paid by the Fund reflect a blended rate of management fees and performance allocations based on the weighted average of amounts invested in different share classes subject to different management fee and/or performance allocation terms. Such management fee rates have ranged over time from 1% to 2% per annum. The amount of performance allocations applicable to any one investor in the Fund will vary materially depending on numerous factors, including without limitation: the specific terms, the date of initial investment, the duration of investment, the date of withdrawal, and market conditions. As such, the net performance shown for the Fund from inception through December 31, 2019, is not an estimate of any specific investor's actual performance. For the period beginning January 1, 2020, the Fund's historical performance shows indicative performance for a new issues eligible investor in the highest management fee (2% per annum) and performance allocation (20%) class of the Fund, who has participated in all side pocket private investments (as applicable) from March 1, 2021, onward. The inception date for Third Point Offshore Fund Ltd is December 1, 1996, Third Point Partners LP is June 1, 1995, Third Point Partners Qualified LP is January 1, 2005, Third Point Ultra Ltd. is May 1, 1997, and Third Point Ultra Onshore LP is January 1, 2019. All performance results are estimates and past performance is not necessarily indicative of future results.
While the performances of the Funds have been compared here with the performance of well-known and widely recognized indices, the indices have not been selected to represent an appropriate benchmark for the Funds whose holdings, performance, and volatility may differ significantly from the securities that comprise the indices. Past performance is not necessarily indicative of future results. All information provided herein is for informational purposes only and should not be deemed as a recommendation to buy or sell securities. All investments involve risk including the loss of principal. Third Point will not accept new subscriptions into Partners, Partners Qualified, and Ultra Onshore LP from any non-US investor unless otherwise permissible under applicable law. This transmission is confidential and may not be redistributed without the express written consent of Third Point LLC and does not constitute an offer to sell or the solicitation of an offer to purchase any security or investment product. Any such offer or solicitation may only be made by means of delivery of an approved confidential offering memorandum.
Specific companies or securities shown in this presentation are meant to demonstrate Third Point's investment style and the types of industries and instruments in which we invest and are not selected based on past performance. The analyses and conclusions of Third Point contained in this presentation include certain statements, assumptions, estimates and projections that reflect various assumptions by Third Point concerning anticipated results that are inherently subject to significant economic, competitive, and other uncertainties and contingencies and have been included solely for illustrative purposes. No representations express or implied, are made as to the accuracy or completeness of such statements, assumptions, estimates or projections or with respect to any other materials herein. Third Point may buy, sell, cover, or otherwise change the nature, form, or amount of its investments, including any investments identified in this letter, without further notice and in Third Point's sole discretion and for any reason. Third Point hereby disclaims any duty to update any information in this letter.
This letter may include performance and other position information relating to once-activist positions that are no longer active but for which there remain residual holdings managed in a non-engaged manner. Such holdings may continue to be categorized as activist during such holding period for portfolio management, risk management and investor reporting purposes, among other things.
Information provided herein, or otherwise provided with respect to a potential investment in the Funds, may constitute non-public information regarding Third Point Investors Limited, a feeder fund listed on the London Stock Exchange, and accordingly dealing or trading in the shares of the listed instrument on the basis of such information may violate securities laws in the United Kingdom, United States and elsewhere.
The representative in Switzerland is FundRock Switzerland SA, Route de Cité-Ouest 2, 1196 Gland, Switzerland. The paying agent in Switzerland is BCGE. The Prospectus/Offering Memorandum, the Articles of Association and audited financial statements of those funds available in Switzerland can be obtained free of charge from the representative in Switzerland. The place of performance and jurisdiction is the registered office of the representative in Switzerland with regard to the Shares distributed in and from Switzerland.
Editor's Note: The summary bullets for this article were chosen by Seeking Alpha editors.
For further details see:
Third Point First Quarter 2023 Investor Letter