QQQ - This Week's Sentiment Review: Market Close To A Top
2023-07-17 03:50:33 ET
Summary
- Measuring investor sentiment is important since 50% or more of a stock's price move is driven by emotion alone - by fear and greed.
- Metrics that measure investor bullishness are not yet at levels that historically occur before a major price decline. But they are getting closer.
- However, even if investor sentiment reaches red zone readings, it doesn't mean the market will decline again. Other factors must be in place for that to occur.
Measuring market sentiment is important since 50% or more of stock's price move is driven by emotions - by fear and greed. Our work helps investors understand where the market stands in this regard.
The Master Sentiment Indicators
We've created two master sentiment indicators for this purpose. They're made by combining well tested sentiment indicators into one. One master indicator measures investor expectation's long term, the other investor expectations over the short term.
MSI (Master Sentiment Indicator)
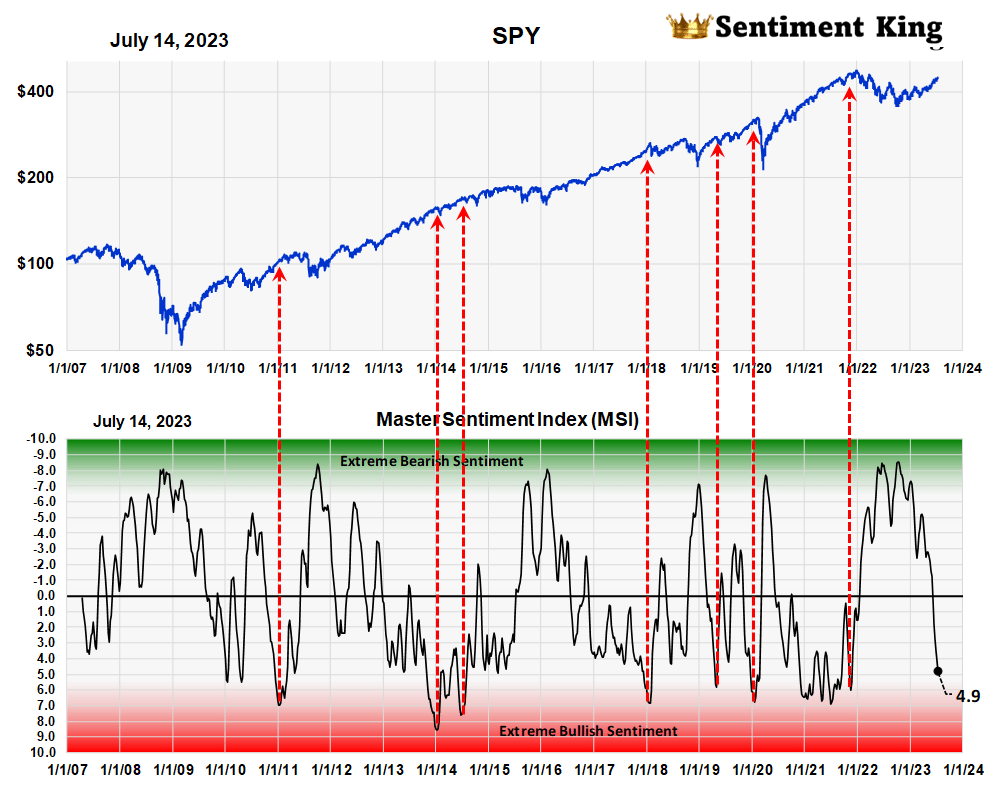
This first chart, called the MSI, is a composite made from nine indicators. It measures investor expectations for the long term. You always want to be careful when too many people expect something to happen in the stock market since it usually doesn't.
Master Sentiment Indicator 2007 -2023 (Sentiment King)
Green Zone
The Green Zone indicates when too many investors expect the market to decline long term, which means they expect either a bear market or at least a three to six month correction.
In fact it was green zone readings last October 25th that prompted this article , "The Master Sentiment Indicator ((MSI)) Still Point To Higher Prices."
Red Zone
Red zone readings, on the other hand, measure when too many investors expect the market to rise long term. We've indicated a few with Red Arrows going back to 2007. However, a red zone reading doesn't always imply a market top, but it does signal caution.
However, major declines don't seem to start until after sentiment has first gone into the red zone. We think that's because you can't get a major decline unless there are lots of potential sellers, and there isn't a large pool of sellers until after many people have become bullish and purchased stocks. Red zone readings indicate when that has occurred.
As you can see in the graph, after the extreme level of bearish sentiment last year, the MSI hasn't yet reached the red zone. The red zone starts when readings get between 6.5 to 9. It's currently 4.9.
It's our opinion this rising stock market won't stop until after sentiment measures reach the red zone.
ST-MSI (Short Term Master Sentiment Indicator)
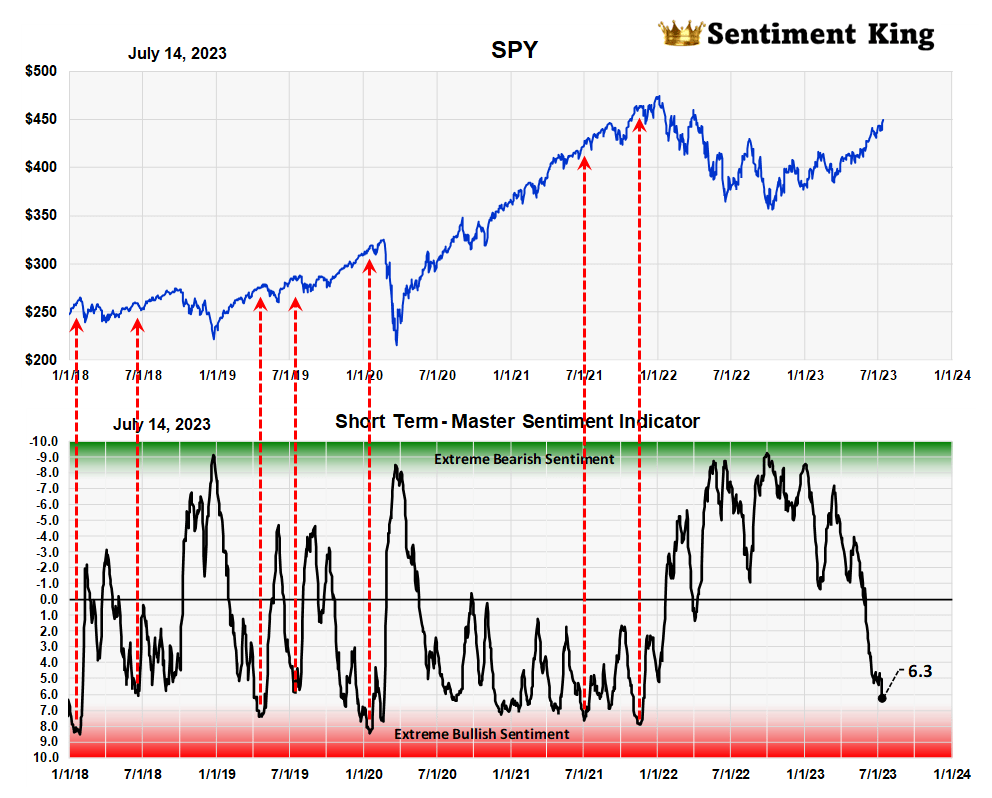
The short term master sentiment indicator shows a similar picture.
Short Term Master Sentiment Indicator (Sentiment King)
This indicator is like the MSI except it's based on indicators that measure expectations over shorter time frames - from two to six months.
In this chart the red zone starts are 7 and the current reading is 6.3, so this indicator, while getting closer to signaling caution, isn't there yet.
Investor Surveys
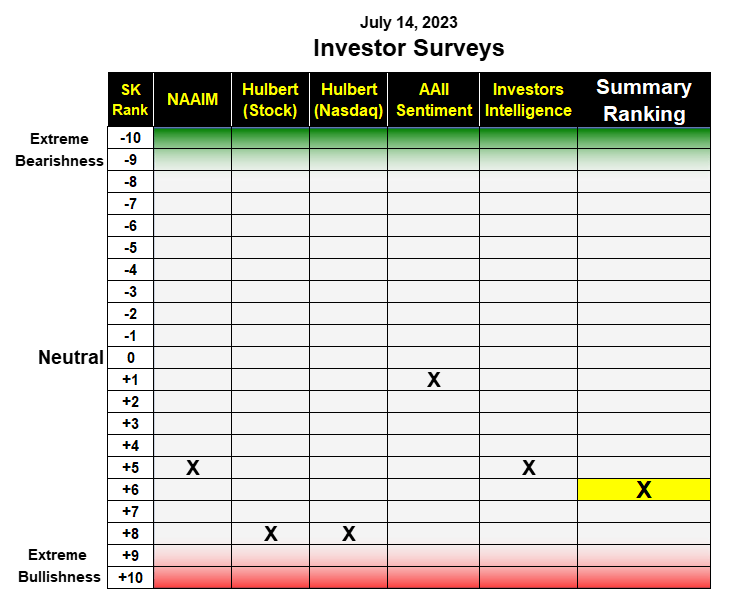
Investment surveys are an important way to measure what investors are thinking and doing. Five different surveys go into our Master indicators. They're shown in the table below.
Table of Investor Sentiment Surveys (Sentiment King)
The AAII Member Sentiment Survey - Last week 41% of members were bullish and 21% were bearish. Our calculation over the last few weeks puts it a +2, which is just past neutral.
Investors Intelligence Newsletter Survey - The latest survey of newsletter writers has 41% bullish, 18% are bearish and 31% expect a market correction. Our ranking puts it at +5, which is a few steps away from the red zone.
NAAIM Exposure Index - The latest data from the American Association of Active Investment Managers (NAAIM) shows the average investment position at of 93%, which is high. The average over the last four weeks puts it at +5 on our scale.
Hulbert Stock Survey - A time weighted moving average of the Hulbert stock market survey has a ranking of +8, which puts is right at the lower limit of the red zone.
Hulbert Nasdaq Survey - The same moving average of the Hulbert Nasdaq survey, is also at the boundary at +8. This reflects growing expectations for continued gains from the heavily capitalized Nasdaq stocks.
Investor Activity
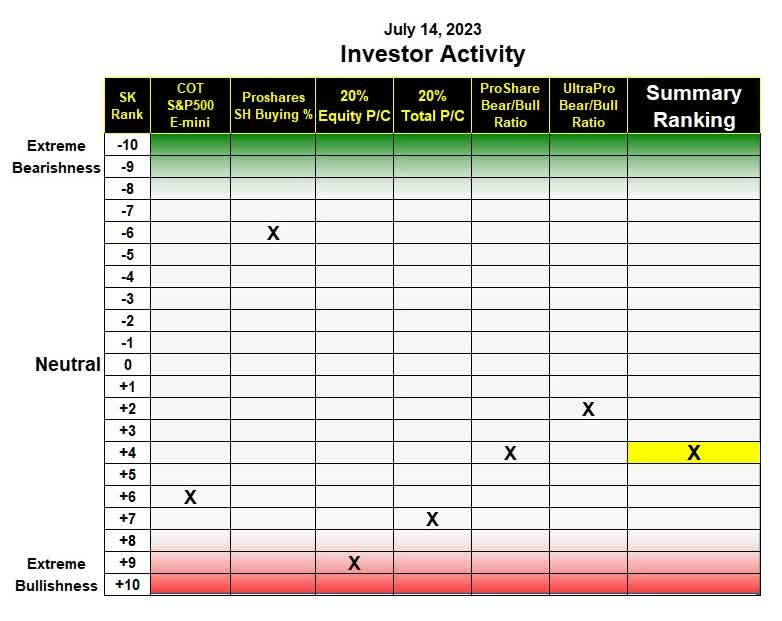
We have six metrics that analyze what investors are buying and selling. This provides insight into what they expect from the market. Five of them are calculated daily.
Table of Investor Activity (Sentiment King)
Puts and Calls Ratios - As you can see, the equity "puts to calls" ratio has finally moved into the red zone. We use a long term time weighted moving average to gain a long term perspective. The total "puts to calls" ratio is two steps away.
S&P 500 E-mini COT - The short position of asset managers in the E-mini S&P futures, who account for almost half all trading, is only 23%, which puts this indicator at +6 on the ranking scale.
ProShares Short S&P 500 ETF ( SH ) - Daily buying is down to 10% of assets, which is still rather high. Normal is 5% for this short fund. This is why it still ranks at -6. We don't believe a major decline can start until purchases levels in short funds drop even more.
ProShares Bear/Bull Ratio - Buying of ProShares short funds versus long funds has a +4 rating. This also means there is still too much shorting going on. This is a positive indicator for higher prices.
ProShares Ultra Pro Bear/Bull Ratio - Twice as much money is going into the six largest Ultra Pro long funds versus short funds, which gives it a rating of +2. Neither ProShares indicator is near the red zone.
Conclusion
Measurements of how bullish investors are, are not yet at the levels which historically occur before a major price decline. But they are getting closer. Even if sentiment gets to the red zone it doesn't mean the market will decline. Other factors must be there for that to happen. So we think investors should stay invested long term as the conditions for another major decline don't exist now.
For further details see:
This Week's Sentiment Review: Market Close To A Top