THO - THOR Industries: A Market Leader That Offers Market-Beating Returns
2023-05-03 14:29:48 ET
Summary
- THOR Industries is a market leader with a long history of profitable growth aided by acquisitions and with a proven track record of managing through business cycles.
- The company has a market-leading position in North America and Europe with focused initiatives in automation, innovation, supply, aftermarket, service and digitalization to drive future growth.
- Management has historically delivered on their own growth projections, while sustaining healthy financial conditions and achieving high returns on invested capital.
- According to my fair value calculation, the stock trades at a significant discount to its fair value and offers an attractive entry point for long-term investors.
Editor's note: Seeking Alpha is proud to welcome Michal Czechowski as a new contributor. It's easy to become a Seeking Alpha contributor and earn money for your best investment ideas. Active contributors also get free access to SA Premium. Click here to find out more »
In my opinion, THOR Industries (THO) is a business run by an experienced management team that over the years achieved high growth and profitability in the cyclical industry. At the current price of $76 per share, I assign the stock a "buy" rating. The buyer today can expect a market-beating return of 10% with an almost 50% margin of safety, in my view.
Growth Strategy Focused on Acquisitions
THOR Industries, the world's largest manufacturer of recreational vehicles (RVs), was founded in 1980. The company produces a wide range of recreational vehicles in the United States and Europe, which it sells to independent, non-franchise dealers along with related parts and accessories. Since going public in 1984, THOR Industries has achieved significant growth through a combination of organic growth, strategic acquisitions and resulting from them efficiency improvements.
In 2022, the company acquired Airxcel for $745 million , an industry-leading provider of vehicle heating, cooling, cooking, window coverings, and sidewall products. Similarly, in 2021, THOR acquired Tiffin Motorhomes for $288 million, which expanded the company's presence in the luxury RV market. Both acquisitions were part of a long-term, strategic growth plan aimed at providing numerous benefits, including strengthening the RV supply chain and diversifying revenue sources.
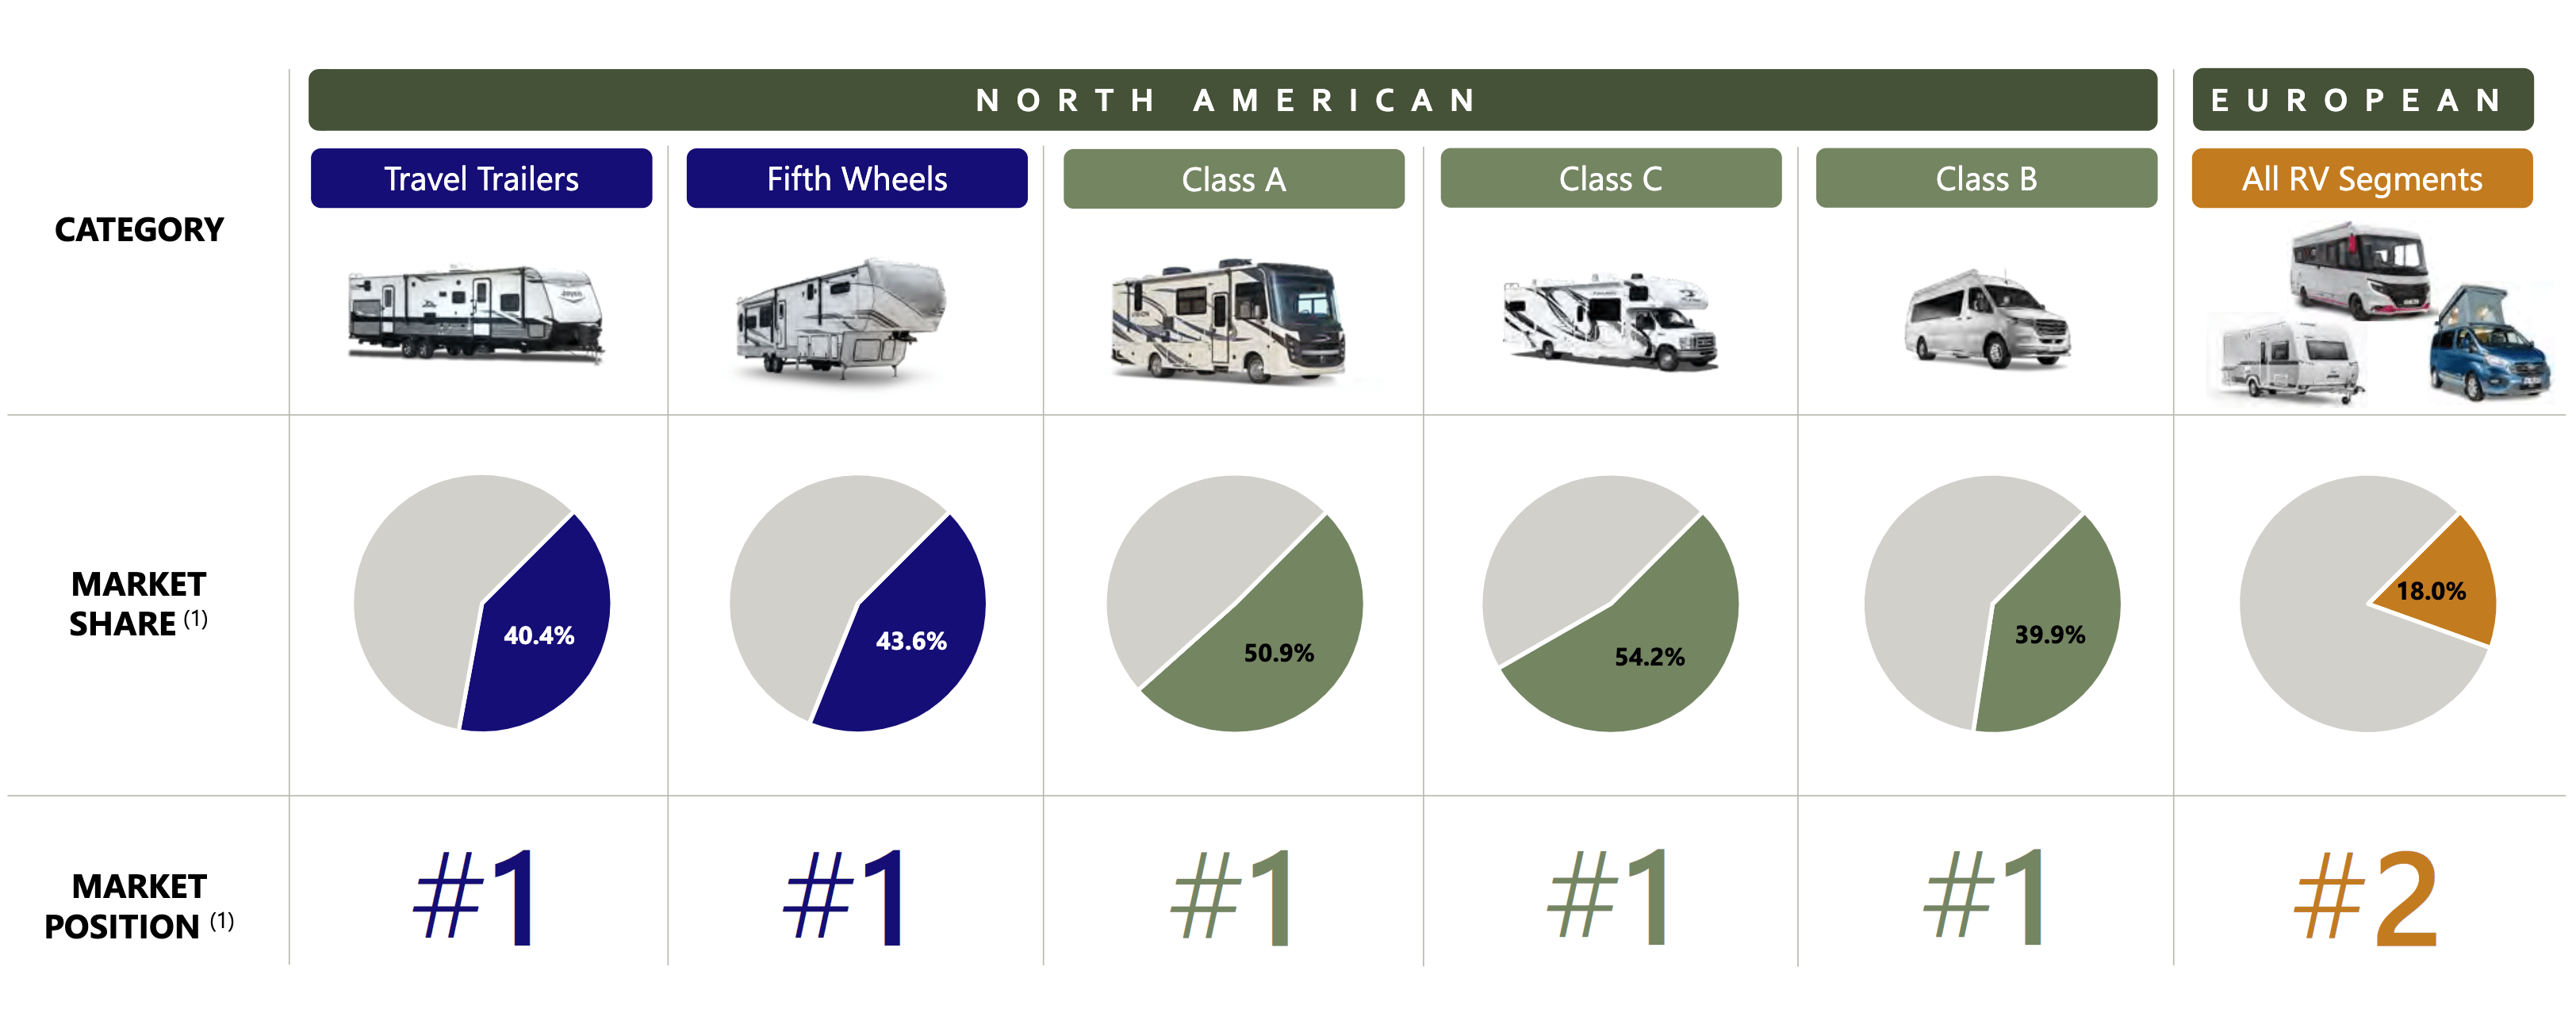
Leadership position within each product category. (2022 Investor Day presentation)
This strategy has propelled THOR Industries to the number-one market position in both North America and Europe. The company's combined market share in 2022 in the United States and Canada was approximately 41.9% for travel trailers and fifth wheels, and around 49.4% in the motorhomes segment. In Europe, THOR Industries holds a combined market share of 21.8% for motorcaravans and campervans, and 18% for caravans.
The acquisitions were financed by internally generated cash flow and debt. The company's current financial leverage ratio, calculated as Total Long-Term Debt/TTM EBITDA, is around 1.3x, with $1.78 billion in long-term debt outstanding. As I will show in my valuation current acquisition strategy requires the company to reinvest more money every year than it generates. This resulted in the growth of long-term debt from zero to $1.78 billion today.
I believe the reinvestment rate will have to go down as the company matures and the growth slows. The strategy itself is sustainable and should be part of future capital allocation strategy, but the degree to which it was utilized in the past will have to go down. As the company is getting big there will not be many sufficiently sizable acquisition targets for them to sustain historical growth. The management's task now is to find more ways to grow organically and lower the reinvestment needs.
Competition and Risk Factors
The RV industry has very low barriers to entry, making THOR Industries vulnerable to significant competition from numerous manufacturers who sell products that compete directly with theirs. According to the Recreation Vehicle Industry Association ((RVIA)), there are approximately 80 RV manufacturers in the United States and Canada, and around 30 across Europe, making it a highly competitive industry.
However, I think only a few manufacturers can benefit from the scale advantage that THOR possess. In my opinion, the industry has been undergoing consolidation for the last 20 years, and there are currently around 10 major competitors in the market, including Winnebago Motorized ( WGO ), Newmar Corp., REV Recreation Group, and Grand Design. The biggest competitor within the North American towable and motorized segments is Forest River, owned by Berkshire Hathaway, with a 28.7% market share.
In the 2022 Annual Report, the management outlined the other significant challenge facing THOR Industries - the consumer demand for used recreational vehicles and other forms of consumer leisure, outdoor or vacation spending priorities. They state that during economic downturns, the demand for used RVs negatively impacts sales of new products, and price differences between used recreational vehicles and new products play a crucial role in the decision-making process for consumers. The competitive position in the RV industry is determined by factors such as price, design, quality, and service. Thanks to THOR's dominant market position, the quality of its products, warranty coverage, and service allows the company to compete favorably with retail purchasers.
THOR Industries' business model is focused on flexibility and adaptability to changing market conditions. The company doesn't engage in heavy manufacturing that would require higher working capital investments and higher overhead costs but rather focuses on assembly.
I believe, that this decentralized business model has many advantages that allow THOR Industries to generate a high return on invested capital. However, it also makes the company's operations vulnerable to its suppliers.
In the 2022 Annual Report , management outlines the negative impact on production caused by chassis shortage.
While we are not dependent on any one supplier, we do depend on a consistent supply of chassis from a limited number of chassis suppliers. Sales of our motorized RV products, including motorhomes, motorcaravans, campervans and urban vehicles, rely on these chassis (…) It is currently extremely difficult to predict which chassis will be available from our various suppliers and in what quantities for which products, as modifying available chassis for certain motorized products to use for other products is not a viable alternative. This further negatively impacts our production schedule and cost structure as we try to balance our production and personnel staffing levels and schedules to the available chassis, often with short notice.
In my opinion, the dependability on suppliers combined with seasonality in the demand for new recreational vehicles could severely disrupt the company's short-term operations. Unpredictability is an important risk for investors that they need to consider before making an investment decision.
I believe, that cyclicality is an inherent feature of this business and given the experience of the management and their profitable history during the down part of the cycle, this is not an issue that disqualifies this investment. I see these problems as an opportunity the market offers to the long-term investor to misprice the stock. One must only incorporate these short-term headwinds into the valuation model accordingly.
Management and Profitability
THOR Industries has consistently generated positive bottom-line results without any negative earnings in its entire operating history, demonstrating the management's ability to navigate the ups and downs of industry business cycles and maintain a stable financial position.
Additionally, the company has achieved a long-term Return on Invested Capital of 18% , indicating an effective capital allocation strategy and ability to find profitable reinvestment opportunities. THOR Industries achieved this by focusing on product quality, vertically integrating newly acquired companies, and negotiating better pricing conditions with their suppliers by building good long-term relationships.
Furthermore, THOR Industries demonstrates a balanced capital allocation strategy by returning excess cash to shareholders through dividends, with a 10-year dividend compound annual growth rate ((CAGR)) of 11.1%. The company's management has recently approved a new share repurchase program, allowing them to repurchase up to $450 million of company stock by July 31, 2025, indicating their confidence in the company's prospects. THOR Industries' experienced and long-term-oriented management team, efficient capital allocation, and consistent profitability suggest a strong foundation for future growth and success.
I consider the quality of the management to be high. In my opinion, consistent profitable growth coming heavily from acquisitions is rare. The fact, that the Return on Invested Capital (that includes goodwill) is high and stable over many years shows that THOR is not overpaying for the acquisitions and generates good returns from the assets it acquires.
Future Growth Prospects
In the 2022 Investor Presentation, THOR Industries' management pointed out that they are not planning to pursue any new acquisitions in the next 3 years. Rather they want to focus on improving operational efficiency and organic growth.
For example, they plan to improve their THOR's laminated sidewall line by introducing a uniform process and increasing automation to deliver best-in-class efficiency and quality while reducing labor costs. Management assesses only a 3-year payback period for investments made in these improvements.
Another area of future growth opportunities in the North American aftermarket and service business, where the management sees a $2 billion TAM for its products. Roadpass Digital, an online tour-planning platform for road-trippers, offers a pathway for monetization in the future and enhances the customer experience by providing useful information about camping places, repair centers, and RV culture.
In my opinion, these examples show that in the coming years, the growth is going to be mainly organic. Improvements in cost structures, assembly lines and operational improvements from past acquisitions will drive margins higher during the next business cycle. The lower reinvestment rate (lack of acquisition spending) will positively affect the free cash flow generation in the near future.
Risks
As previously mentioned THOR experiences cyclicality in the demand for its products and is highly dependable on the ability of its suppliers to provide necessary components. Moreover, high inflation and the rising production costs for new vehicles, in my view, could depress margins and make it impossible to pass all cost increases on to the end customers. The more attractive spread in the prices for used RVs compared to new ones could make consumers purchase used products instead of the new ones as they would offer a better value proposition for them.
Another risk factor is that one of the dealers, FreedomRoads, in each of the last three years, accounted for more than 10% of the company's net sales. In 2020, 2021 and 2022 it was responsible for 15%, 13% and 13% of revenue respectively. As the dealers usually carry product lines of at least one of THOR Industries' competitors it is possible that they could lose this business partner or be unable to negotiate better pricing conditions, which would negatively impact the company's sales.
Valuation
To calculate the fair value of THOR Industries I go through a multi-step process. Firstly, I analyze the past to understand the past capital allocation strategy of the company, what Return on Invested Capital ((ROIC)) the company achieved, and how much it reinvested to grow.
Secondly, I calculate the net operating profit after taxes ((NOPAT)) and capital investments for each year to understand what part of the profit was reinvested into the business to fund growth. After that, I calculate the Capital/Sales Ratio to come up with reasonable estimates about future reinvestment needs.
Finally, I use management estimates and information learned from research to estimate future cash flows to calculate the intrinsic value of the company using Discounted Cash Flow Model.
Valuation Steps:
-
Calculation of Net Operating Profit After Taxes ((NOPAT)) and the Capital Investments for each year to understand what part of the profit was reinvested back into the business to fund the growth.
-
Calculation of Invested Capital and Return on Invested Capital ((ROIC)) to see how well the capital invested into the business was being turned into profit.
-
Determining the Capital/Sales Ratio to come up with reasonable estimates about the future need for Reinvestments.
-
Forecasting future Cash Flows using management estimates and information learnt from our research.
-
Using the Discounted Cash Flow model to find the Present Value of all future Cash Flows - The intrinsic Value of the Company.
Net Operating Profit After Taxes ((NOPAT))
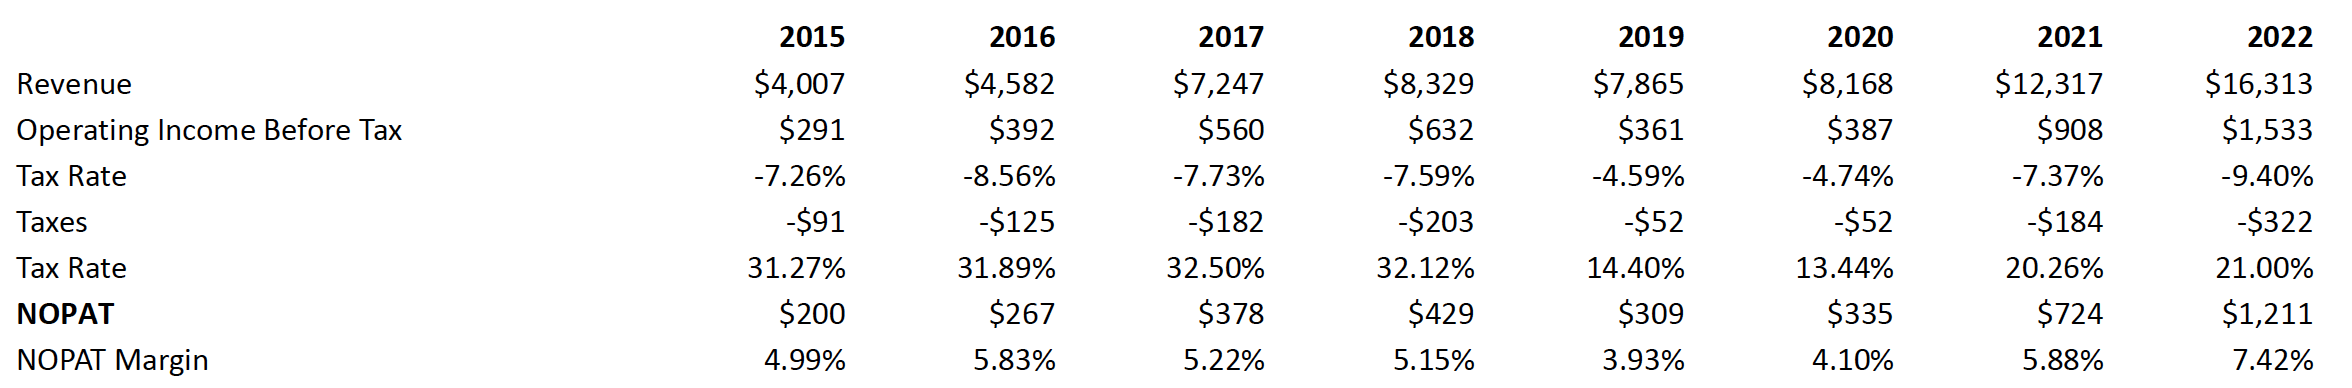
In this analysis of THOR Industries, I begin with Operating Income and calculate the tax rate for each year starting from 2015. I use the NOPAT calculation to determine the income coming from the core operations of the business that are not affected by the type of financing, such as interest paid on debt. I act as if the company had to pay taxes on this operating income, resulting in NOPAT for each year.
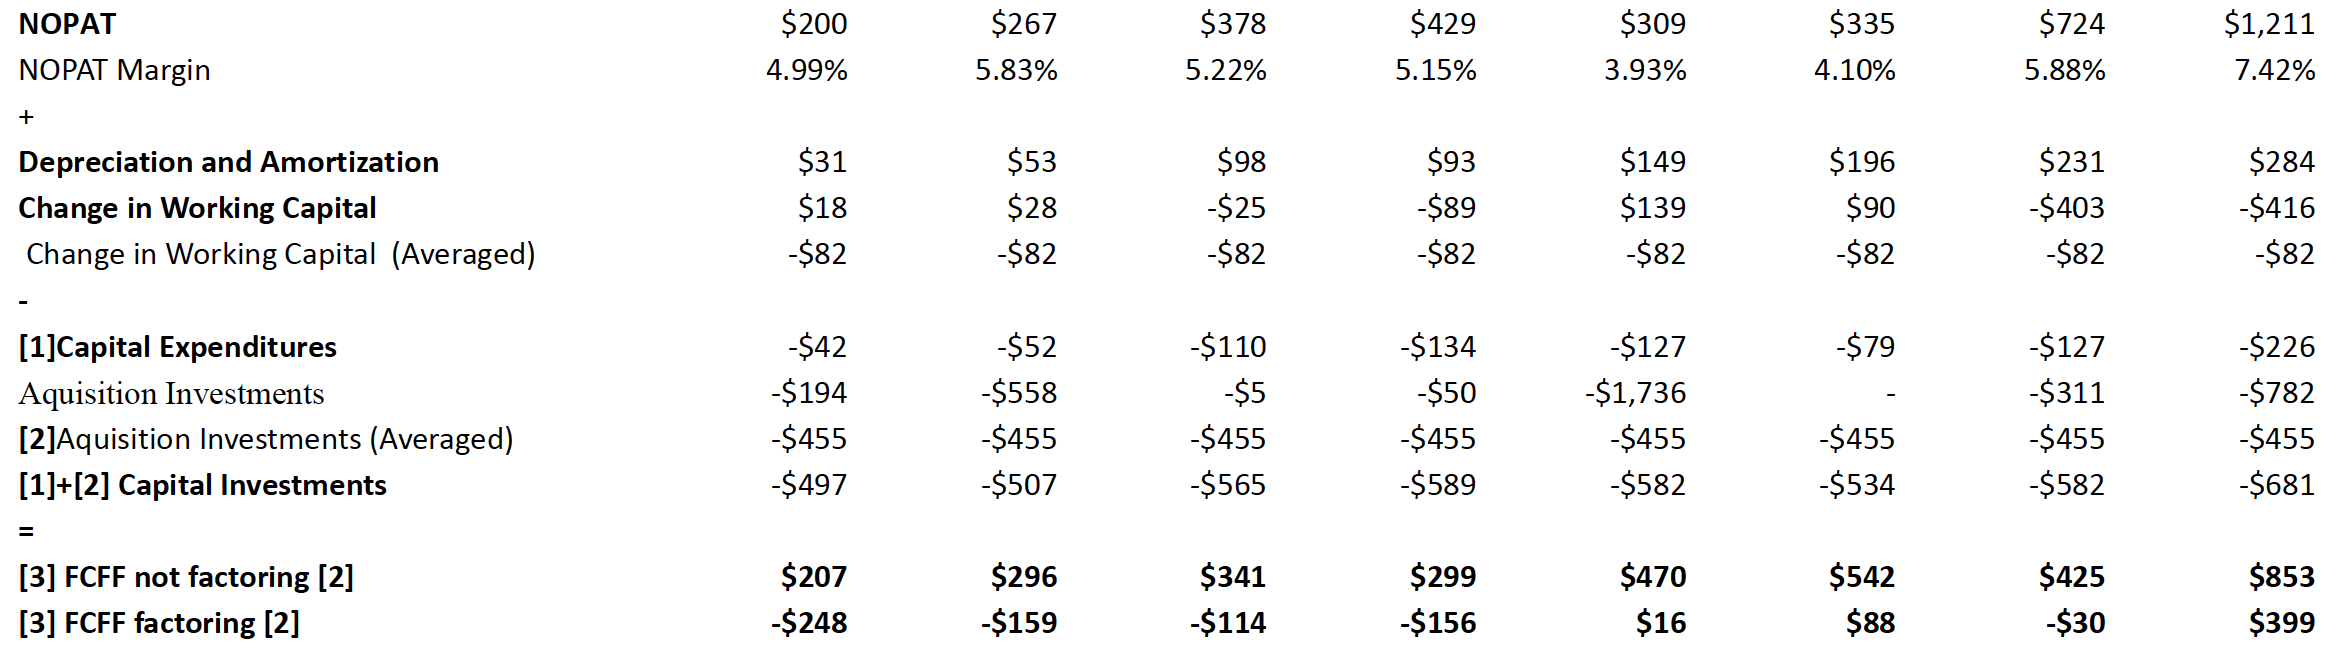
To calculate Free Cash Flow, I add back Depreciation and Amortization as non-cash expenses and take into account yearly changes in Working Capital. Finally, I subtract Capital Investments made to sustain business operations, market position, and fund growth.
When factoring Acquisition Investments, crucial for THOR to grow, I see that for most of the years, I end up with a negative number. This shows that the company is reinvesting more money than it generates. It also illustrates why the long-term debt grew during this time from zero to $1.75 billion.
Reinvestment Rate
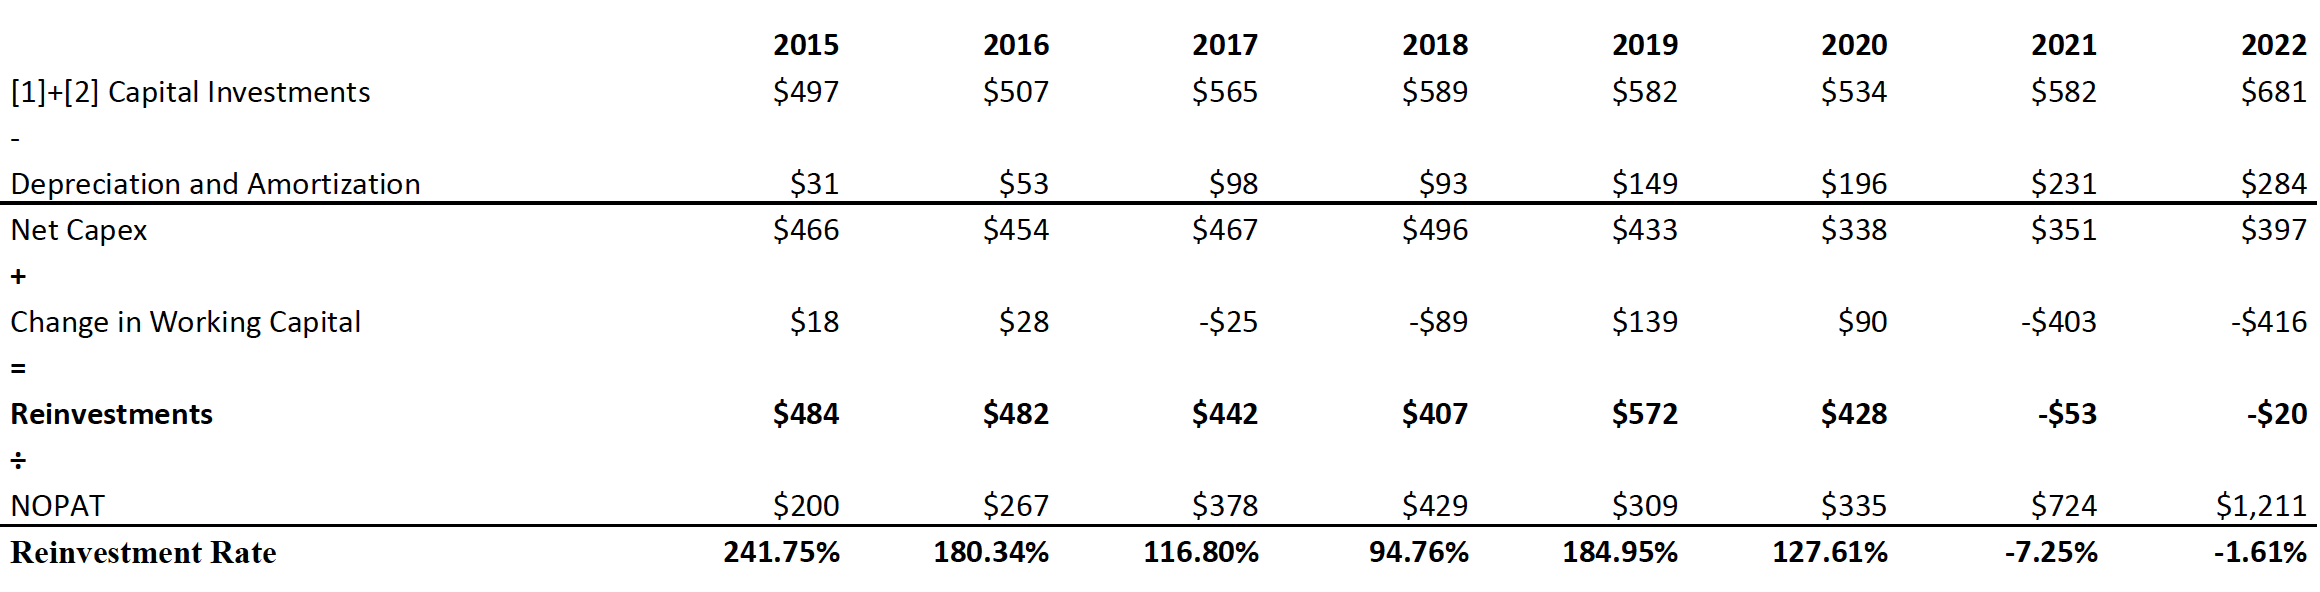
It's time to calculate the percentage of profits reinvested back into the business, known as the Reinvestment Rate. I use the following two formulas:
-
Reinvestment Rate = (Net Capex + Change in WC) ÷ NOPAT
-
Net Capex = Capital Investments + Depreciation
Reinvestment Rate tells what percentage of profit the company decided to reinvest to fund its growth. (Author's Calculations)
Since 2015, THOR Industries has been growing its revenue at an annual rate of 22.6% and its EBIT at an even higher rate of 26.8%. The company has been reinvesting on average around 120% of its profits.
To see, if this growth and reinvestments were creating value for shareholders I computed the Invested Capital for each fiscal year. There are two ways of doing it:
-
Invested Capital = Shareholders' Equity + Debt - Cash
-
Invested Capital = Working Capital + PP&E + Goodwill + Intangible Assets
The first one focuses on business financing, and the second on business operations. Both, when done properly give the same result. To compute the Return on Invested Capital ((ROIC)) I used the following formula:
- ROIC = NOPAT ÷ Invested Capital
This metric is the most important number in analyzing the company because it shows how well the company is investing its capital. If this number were lower than the cost of financing ((WACC)) it would mean that the company is destroying value and is not worth investing in.
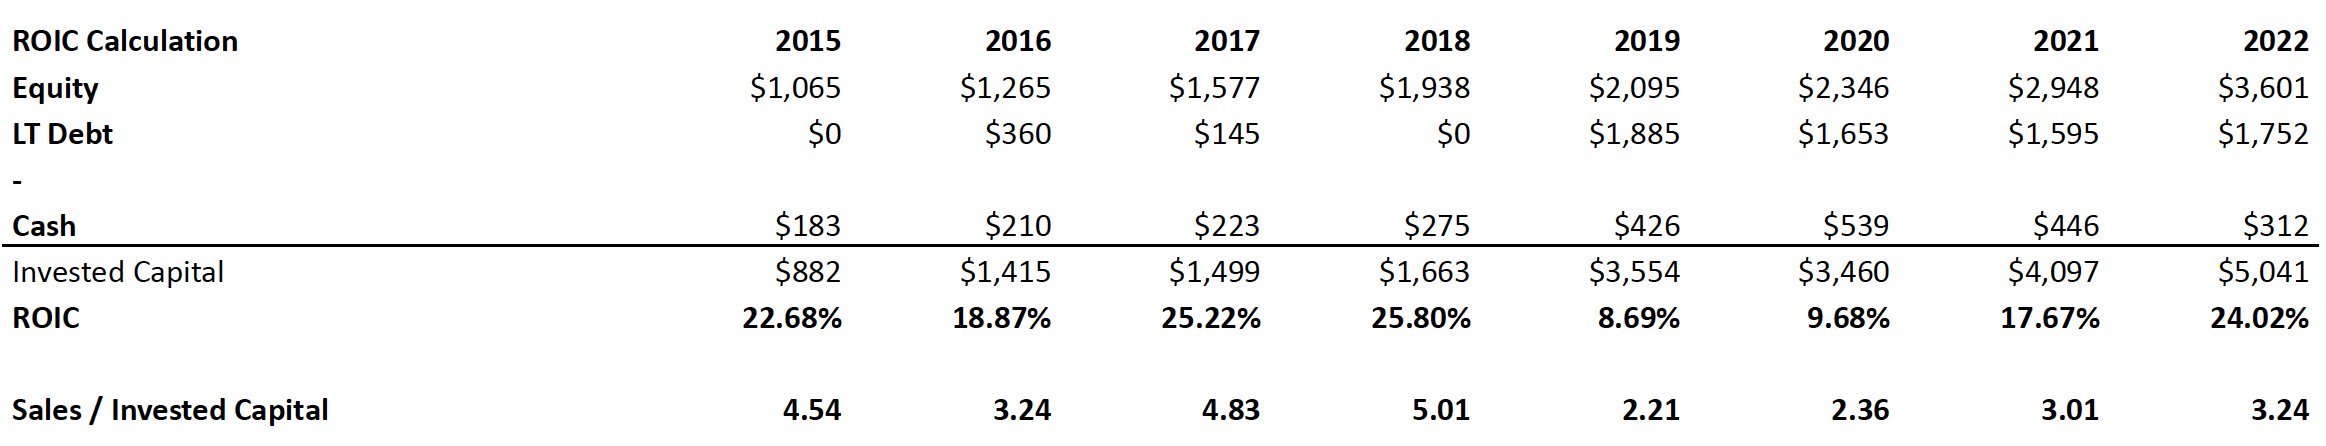
The average ROIC for this time period is equal to 19%. It means that by reinvesting and growing the company is creating value - economic profit. This is a well-run company worth taking a deeper dive into the valuation.
I also calculated the Sales/Capital Ratio, which tells me how much capital the company must have invested to generate each year's revenue. On average, THOR has a Sales/Capital ratio of 3.50. It means that for every $1 of Invested Capital, it generates $3.50 in Sales. This number I am going to use to forecast future capital requirements for funding the growth of the company.
Future Cash Flows
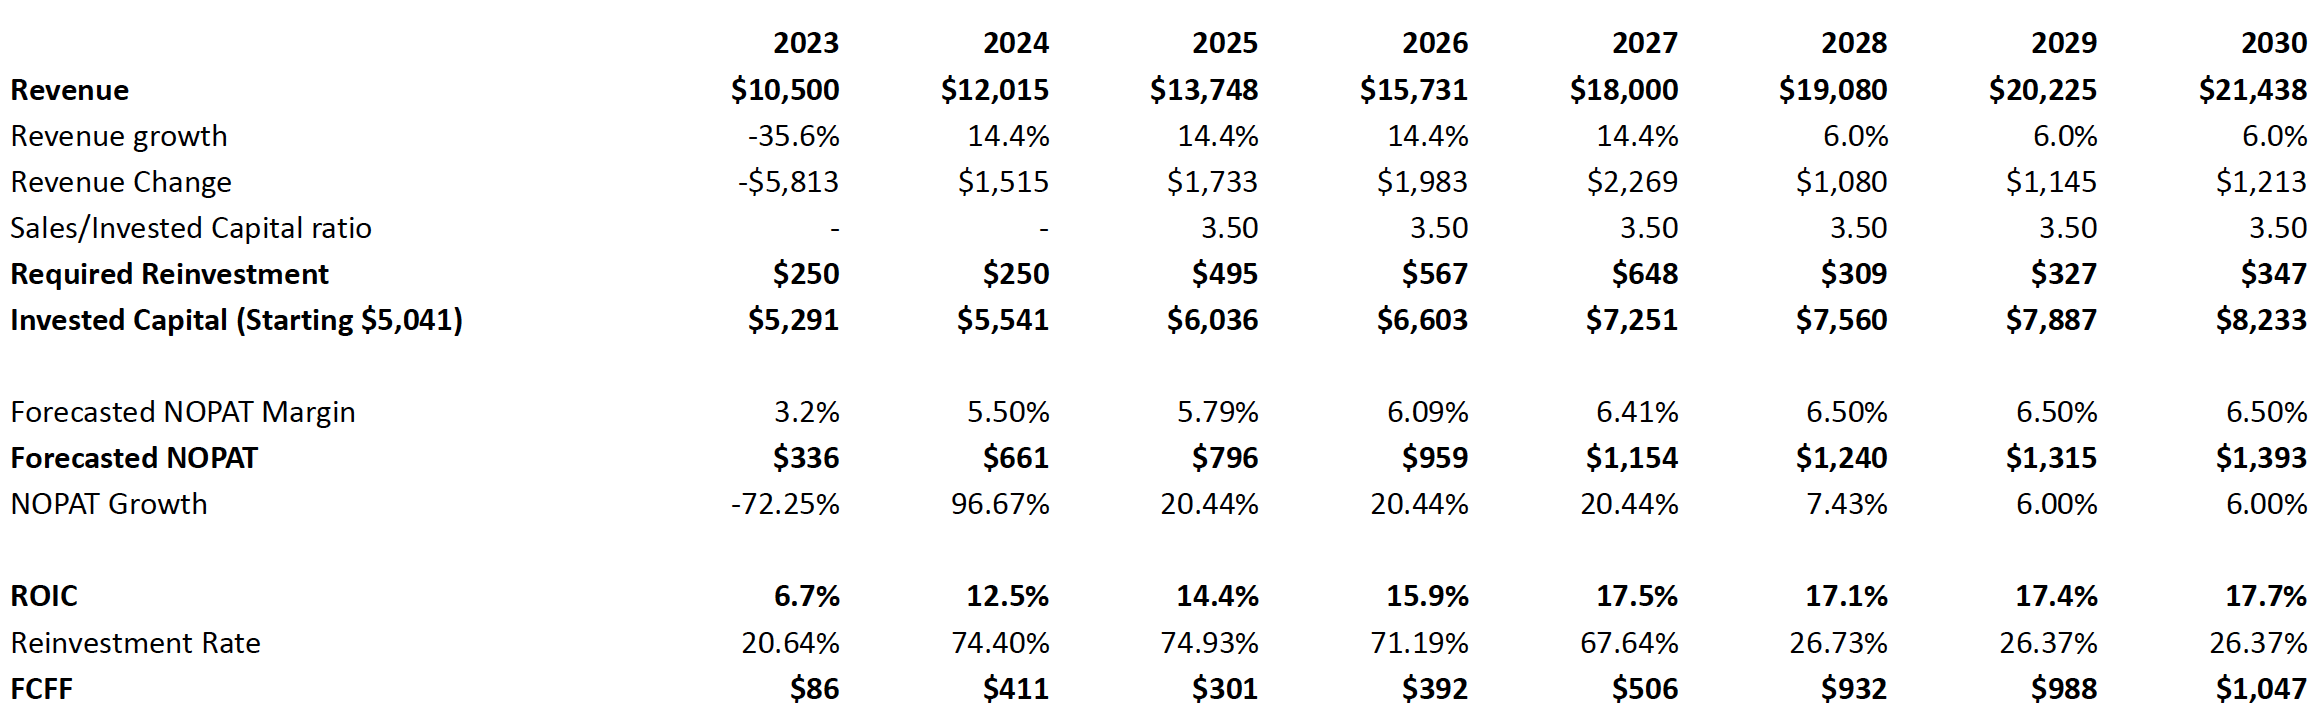
To forecast future cash flows I start with revenue growth. For the FY2023 number, I used the most recent guidance from management and took the more conservative number of $10.5 billion. Management is aiming for $18 billion of revenue in FY2027 so I assigned a 14.4% growth rate to come up with this number and for the years 2028-2030, I decided to pick growth of 6% and project $21.44 billion in revenue in FY2030.
This would mean that THOR's market share would grow from 20.6% to 27 % when the Global RV Market is expected to reach around $77 billion in Sales by 2030. Using the guidance for FY2023 CAPEX and average Sales/Capital ratio of 3.50 for the next years I estimate Required Reinvestment needed for providing such growth in Revenue. Each year's reinvestment is added to the Invested Capital.
I am forecasting the 2023 NOPAT using the management's guidance, and for the next years, I will use the average historical NOPAT Margin and grow them over time as I expect it to be higher in the future when the company matures.
I calculate ROIC for each year to check if I get a number reasonably close to the historical ROIC of 19%. In the end, I subtract each year's Reinvestments from NOPAT and come up with Free Cash Flow for the Firm.
Intrinsic Value
Using the Free Cash Flow to the Firm I calculated in the previous step, I can use the Discounted Cash Flow model to find the intrinsic value of the company.
To calculate the intrinsic value of THOR Industries, I discount the future cash flows back to their present value using a discount rate of 12%. To calculate the terminal value I use a lower discount rate of 10% because at this stage the company is going to be in stable growth and I assumed that its Cost of Capital is going to be lower than today.
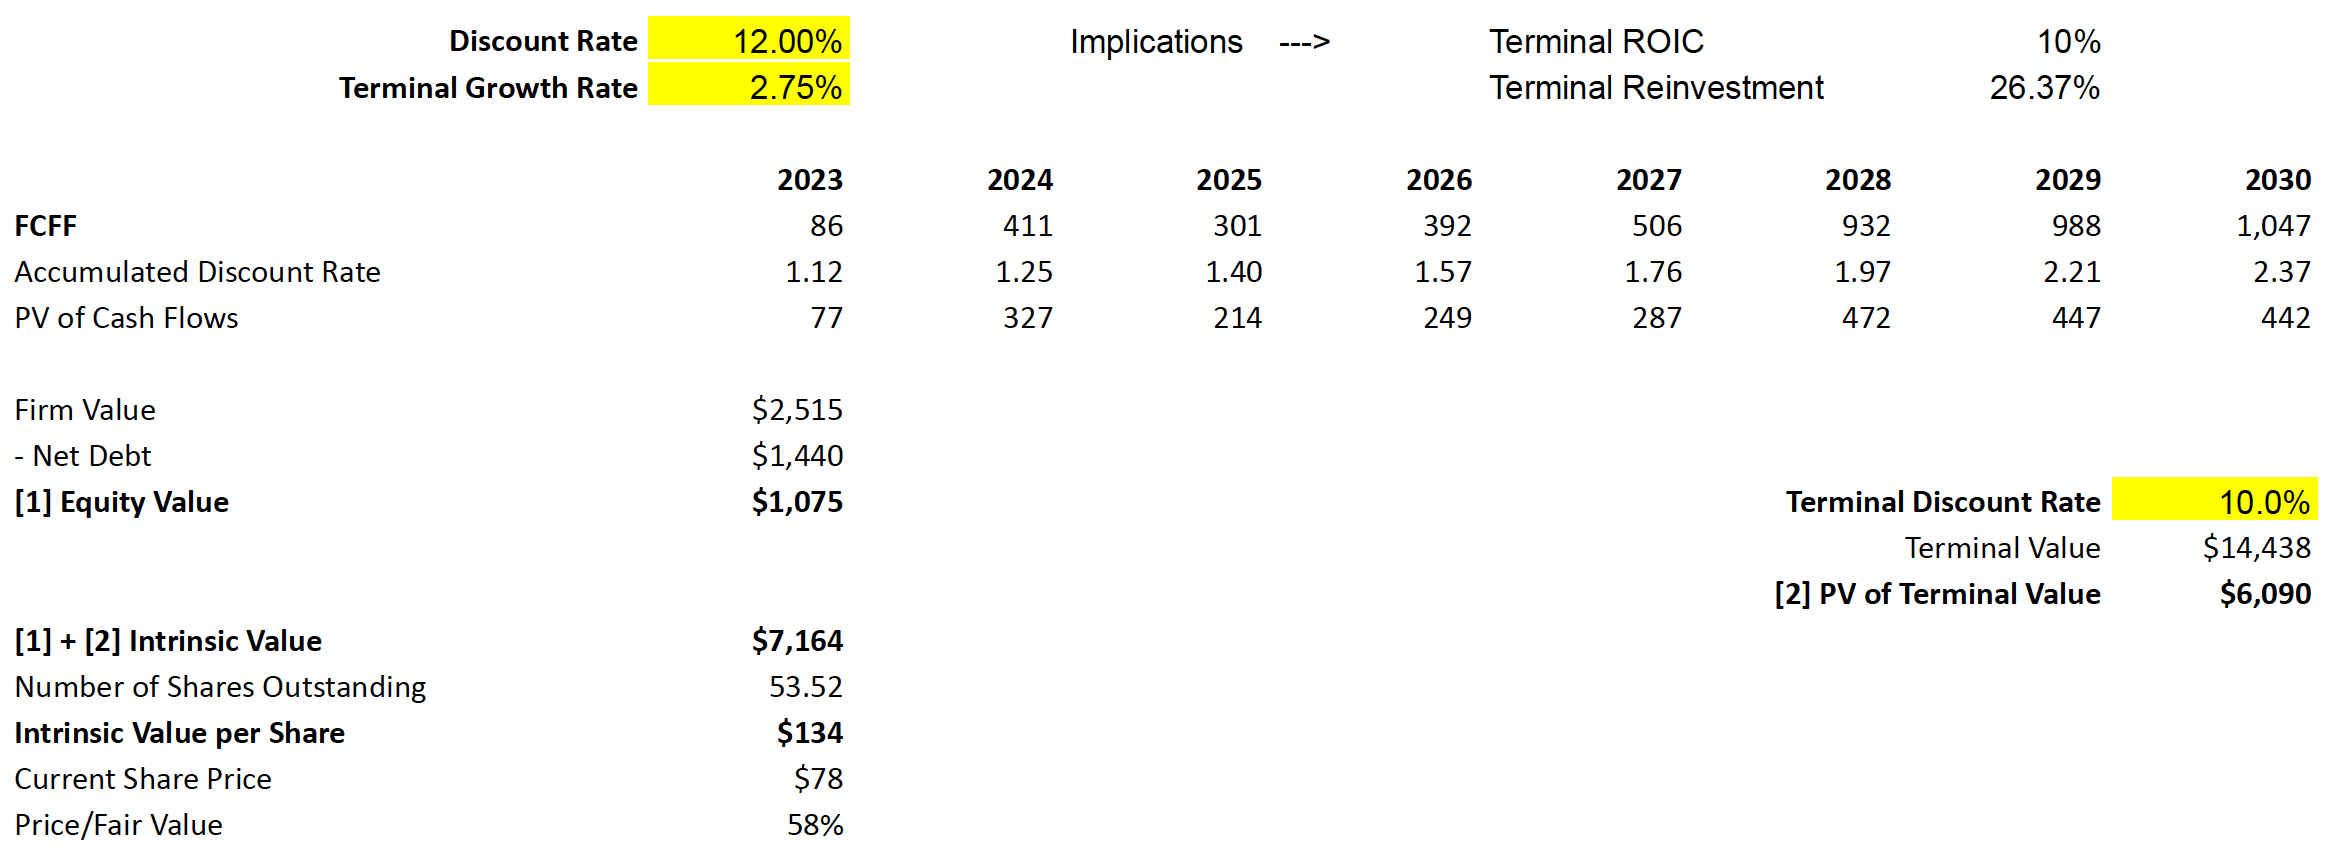
According to my valuation, the intrinsic value for THOR Industries is equal to $7.16 billion or $134 per share as of today. The current price of $78 implies a significant upside potential. Based on my analysis the shares trade at only 58% of their intrinsic value.
Conclusion
Based on my analysis, I believe that THOR Industries is a well-run company that has been able to generate highly profitable growth and reinvest a vast majority of its profits back into the business. The historical ROIC of 19%, strong market position and the forecasted Free Cash Flows suggest that the company will continue to create value for shareholders in the future.
THOR Industries is well-positioned to harness many new opportunities to grow in the RV market. The calculated intrinsic value of $134/share suggests that the company is significantly undervalued, thus providing a potential investment opportunity for long-term value investors.
For further details see:
THOR Industries: A Market Leader That Offers Market-Beating Returns