REVG - THOR Industries Soars On Stellar Outperformance
2023-06-07 06:03:40 ET
Summary
- THOR Industries' Q3 revenue fell 37.1% YoY to $2.93bn, but exceeded analysts' expectations by $110m, leading to a 17.7% increase in share price.
- Despite weak industry conditions, THOR Industries has managed its inventory well and improved its earnings per share guidance for the 2023 fiscal year.
- THOR Industries' stock is rated a 'buy' due to its inventory management, bottom line performance, and share price valuation.
June 6th ended up being a really great day for shareholders of RV (recreational vehicle) manufacturer THOR Industries ( THO ). After reporting financial results that far exceeded analysts’ expectations on both its top and bottom lines, the company saw its share price spike, closing up 17.7% for the day. The past couple of years now have been rather difficult for the firm. Significant weakness in the space, caused by falling demand in the face of higher prices, rising interest rates, and the fact that demand was front loaded during the pandemic, has resulted in a meaningful decline in both revenue and profits. But even though the firm revised lower its revenue guidance for the current fiscal year as a whole, an upward revision in midpoint expectations for profits, combined with the rather stellar quarter that was the third quarter of the year, was enough to stoke investor optimism. While some investors may view this as an opportunity to cash out before the stock pulls back further, I would make the case that further upside very likely exists.
A fantastic quarter
Whether or not you consider the third quarter of the 2023 fiscal year for THOR Industries to be positive or negative depends on whether you are putting it in context of historical results or analysts’ expectations. If you compare results to what they were a year earlier, you would end up thinking that the quarter was awfully painful. And that's because, relative to what was seen last year, it was a difficult quarter. Revenue, for instance, came in at $2.93 billion. That represents a decline of 37.1% compared to the $4.66 billion generated one year earlier. This decline in revenue was driven by some rather significant weakness. Relative to what analysts were expecting, however, the picture of the company was very positive. Revenue actually exceeded expectations by $110 million.
North American towable wholesale units, for instance, totaled 24,707 in the most recent quarter. That was down 64% compared to the 68,720 reported one year earlier. North American motorized unit sales dropped 29.6% from 8,311 units to 5,855. On the retail side, North American towable unit sales dropped 24.3% from 38,624 to 29,245, while North American motorized units declined 22.7% from 6,591 units to 5,097. For those wondering if this weakness might be company specific, the answer is that it's not. The firm did fare worse than the North American industry as a whole. But it looks as though everyone took a beating. Total shipments for the North American wholesale industry, as an example, dropped 54.2% year over year, while on the retail side they dropped 25.8%. Higher interest rates, inventory adjustments amongst dealers, and rising prices, all seem to be primary drivers of this weakness. Interestingly, the picture in Europe was considerably better, with total shipments for the company down only 12.1% a year over year. But this is a fairly small slice of the pie for the business, accounting for only 29% of overall revenue in the most recent quarter.
Generally speaking, when you see revenue fall as much as what THOR Industries experienced, you would expect the company in question to report significant net losses. But that was not the case. Net income did fall year over year, plunging from $348.1 million to $120.7 million. This works out to $2.24 per share, which fell short of the $6.32 per share reported one year earlier but exceeded analysts’ expectations by $1.12 per share. Other profitability metrics also performed better than I would have anticipated. Operating cash flow, as an example, fell from $339.4 million to $288.8 million. Though if we adjust for changes in working capital, we would get a more significant decline from $424.9 million to $197.5 million. Meanwhile, EBITDA for the company dropped from $559.6 million to $258.5 million.
The weakness experienced in the third quarter has been part of a larger trend. To see what I mean, we need only look at results covering the first three quarters of the current fiscal year relative to the same three quarters of last year. This data can be seen in the chart above. Just as was the case with a third quarter, revenue, profits, and cash flows, all have dropped materially. And more likely than not, this trend will continue for some time. Management even was forced to revise lower their expectations for this year from a sales perspective. Overall revenue is now forecasted to come in at between $10.5 billion and $11 billion. Previously, the higher end of that range was $11.5 billion.
This is not to say that all the guidance data is bad. There were actually some interesting developments. For starters, inventory levels are far better than I would have anticipated. At the end of the quarter, inventories totaled $1.86 billion. This is an increase over the $1.75 billion reported at the end of the 2022 fiscal year. And it's also above the $1.73 billion reported in the third quarter of last year. But when you consider how weak industry conditions are, it's shocking that the company does not have a glut of inventory to worry about. It also is helpful that inventories are quite low relative to revenue as a whole. If inventories were substantially higher, the prospect of significant write downs and net losses would increase substantially.
Another positive is that, while overall backlog for the company has suffered tremendously, especially because of weakness throughout North America, European backlog increased 20.7% year over year thanks in large part to higher selling prices. That took backlog in Europe up from $2.88 billion to $3.47 billion. What this indicates to me is that, even though unit shipments are down overseas, demand is still high enough for management to ratchet up prices. Moving forward, some of the backlog for both Europe and North America should increase because, as the image above illustrates, registrations for RVs remains lofty even though they were lower last year than the year prior.
The last positive development that I noticed is that earnings per share guidance has been improved. Previously, management forecasted profits for the 2023 fiscal year of between $5.50 per share and $6.50 per share. The lower end of that range has been pushed up to $5.80 per share. At the midpoint, this would imply in net income for the year of $331 million. Guidance was not provided when it comes to other profitability metrics. But if we annualize those from the first three quarters, we would end up with adjusted operating cash flow of $664.6 million and EBITDA of $842.3 million.
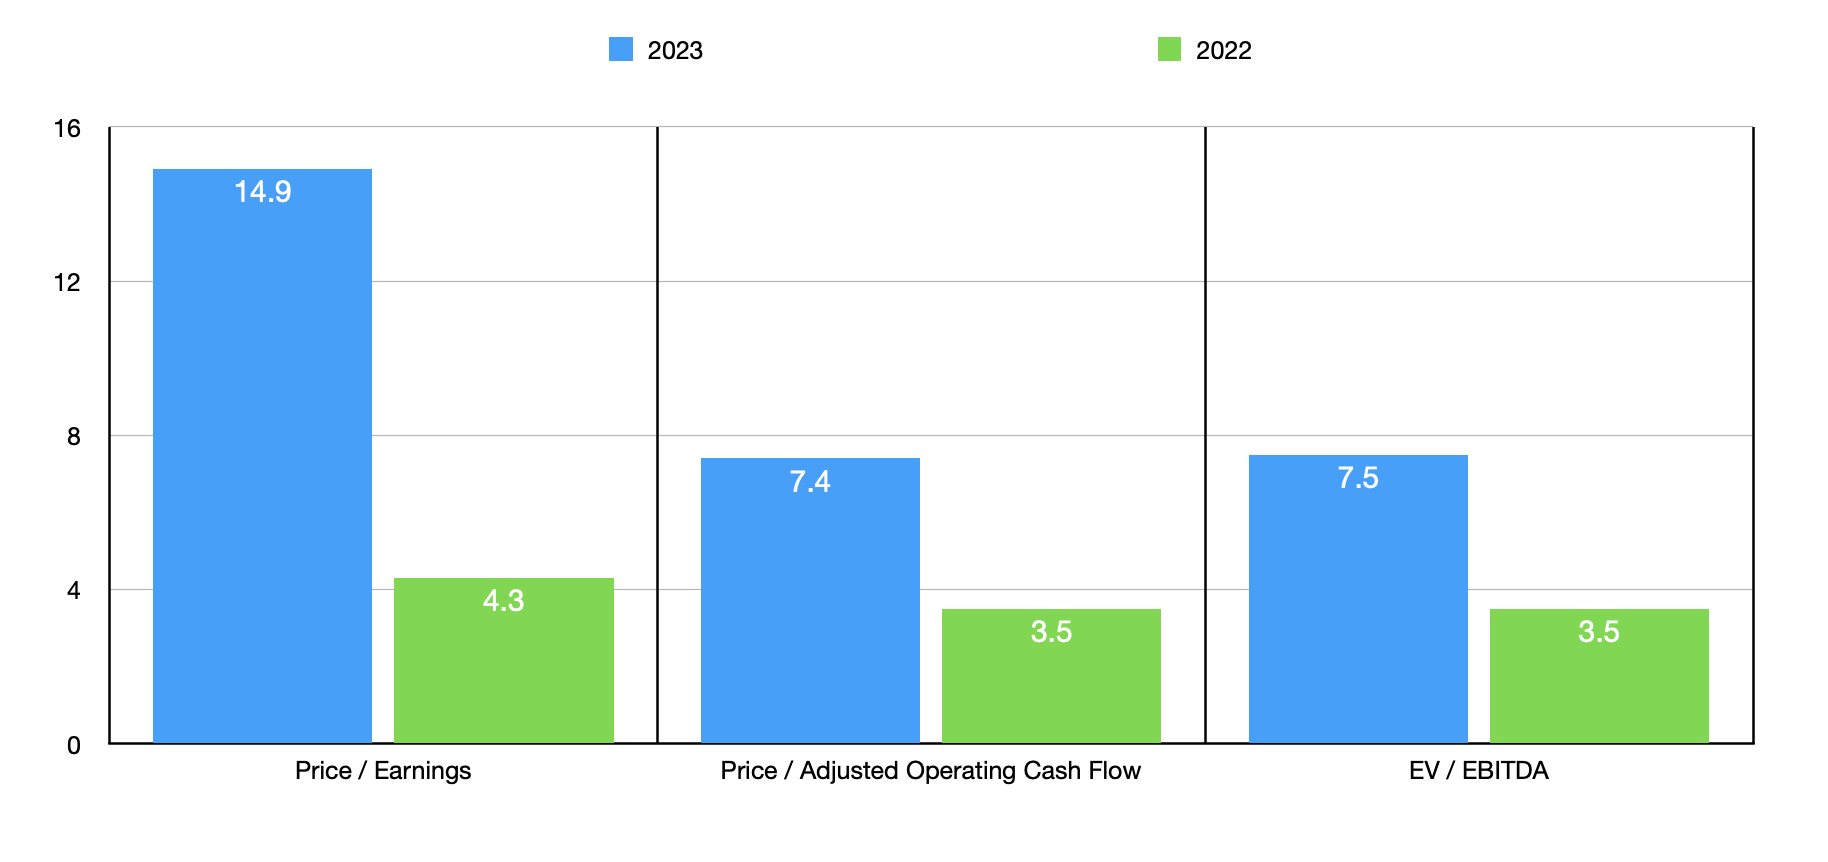
Taking those numbers, we can easily value the company. In the chart above, you can see how shares are priced on a forward basis for the 2023 fiscal year. You can also see how they are priced using data from 2022. Both years result in shares looking cheap on an absolute basis. But investors should not anticipate a return to the kind of performance experienced in 2022 anytime soon. As part of my analysis, in the table below, I also compared the company to five similar firms. On a price to earnings basis, two of the five firms were cheaper than our prospect, while another was tied with it. But when it comes to the other two metrics, three of the firms ended up being cheaper than our target.
| Company |
| Price / Earnings |
| Price / Operating Cash Flow |
| EV / EBITDA |
| THOR Industries |
| 14.9 |
| 7.4 |
| 7.5 |
| Winnebago Industries ( WGO ) |
| 6.7 |
| 5.7 |
| 4.3 |
| Lazydays Holdings ( LAZY ) |
| 15.3 |
| N/A |
| 6.4 |
| LCI Industries ( LCII ) |
| 14.9 |
| 5.7 |
| 9.1 |
| Camping World Holdings ( CWH ) |
| 12.5 |
| 2.5 |
| 7.0 |
| REV Group ( REVG ) |
| 282.0 |
| 7.6 |
| 16.1 |
Takeaway
All things considered, I would say that things are going quite well for THOR Industries. When I last wrote about the company in October of 2021, I took a bullish stance on it, but I also acknowledged that investors should be careful about the future. Sales have fallen far more than I thought they would. But when you look at the inventory data and how the company is managing its bottom line, I believe that investors have reason to be optimistic. Because of this and how shares are priced, I have no problem keeping the company rated a ‘buy’ for now.
For further details see:
THOR Industries Soars On Stellar Outperformance