FSUMF - Tidewater: This Might Be As Good As It Gets
2023-06-05 07:30:00 ET
Summary
- Tidewater Inc. operates an offshore support vessel business, facing risks in tough environments and strict regulations on maintenance and safety.
- The company's financial stability is affected by the volatility in demand for its services, which is currently driven by strong oil prices and increased day rates.
- The current positive outlook might be short-lived, as crude oil spot prices are projected to change according to the U.S. Energy Information Administration.
Investment Thesis:
Tidewater Inc. ( TDW ) operates an offshore support vessel ("OSV") business, and it is a risky business in more ways than one. These vessels operate in tough environments and the industry attracts tough regulation on maintenance and ongoing certification of vessels as well as matters affecting safety of crew. These risks are however more manageable than the volatility in the demand for the company's services, with a flow on effect on financial stability. As per Tidewater's website, the company in its present form only emerged from Chapter 11 Bankruptcy in the second half of 2017. Existing stockholders before the bankruptcy ended up with 5% of the company post financial restructuring plus warrants. But the warrants are still far out of the money, even at today's share price.
Things might look very rosy at the moment, with strong oil prices having driven up day rates, but this might be as good as it gets. I rate Tidewater at best a Hold in the short term, with existing shareholders needing to keep a close eye on the future direction of oil prices and the impact on Tidewater day rates. I rate Tidewater a Sell for those wishing to exit around the high point for a cyclical business, and with a preparedness to possibly leave some money on the table. Below, I discuss in more detail my reasons for believing this might be as good as it gets for Tidewater stock.
Latest historical and projected crude oil spot prices from U.S. Energy Information Administration ("eia") are shown in Fig. 1 below.
Figure 1
U.S. Energy Information Administration
Oil prices tend to impact on levels of offshore oil drilling, which in turn impacts on day rates for offshore support vessels operated by Tidewater, as well as on utilization rates. A combination of increased day rates and higher utilization rates is a powerful driver of revenues. Unfortunately, this works both ways, resulting in revenues falling steeply if day rates and utilization rates decrease due to reduced demand. While Tidewater has been able to negotiate new contracts at higher rates, the term of contracts is in months rather than years, so the company is always exposed to falls in rates. While the purchases of SPO's OSV business, adding 47 active vessels, and the upcoming purchase of 37 Solstad (SLOFF) vessels, appears a good move, it should be understood the sellers also would have their reasons.
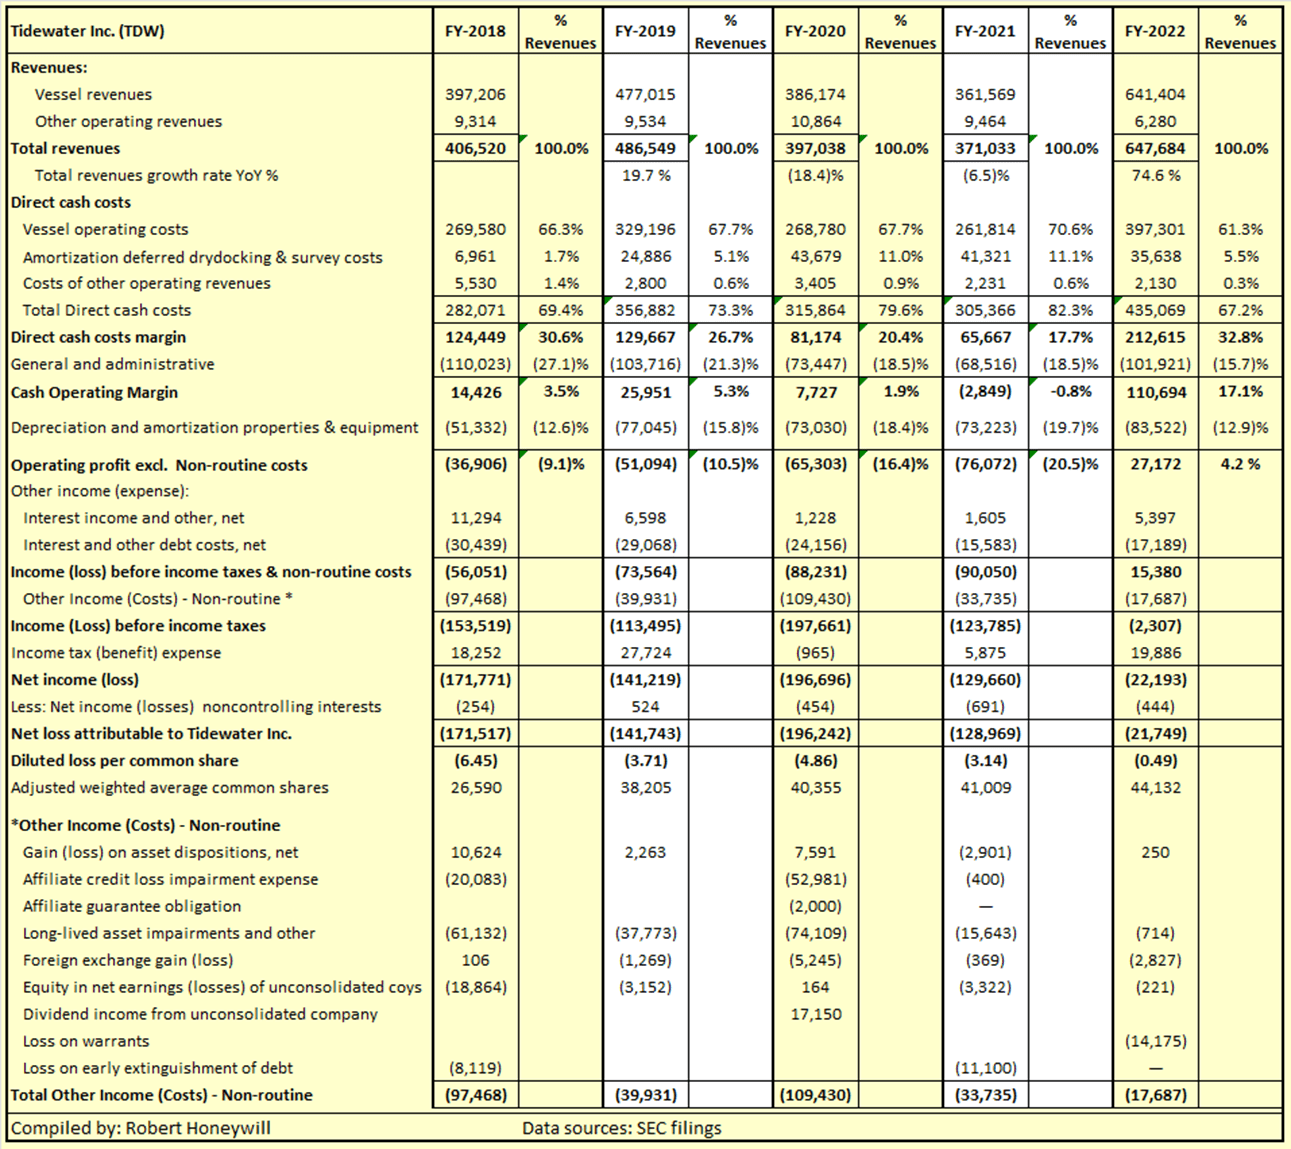
Table 1 below shows the financial results for Tidewater since emerging from bankruptcy.
Table 1
Comments on Table 1 -
- Total revenues - These increased by 19.7% between FY-2018 and FY-2019. The decreases in FY-2020 and FY-2021 are primarily related to COVID. FY-2022 reflects the recovery from COVID effect, and higher day rates and utilization, brought on by strong offshore oil activity, largely as a result of the Russian invasion of Ukraine. A more comprehensive discussion of elements impacting on revenues appears under Table 2 below.
- Direct Cash Costs - A more comprehensive discussion of elements impacting on these costs appears under Table 2 below. Note the low percentages for Amortisation deferred drydocking & survey costs in FY-2018 and FY-2019 is due to a nil opening balance of deferred costs coming out of Bankruptcy in second half 2017.
- General and administrative - A more comprehensive discussion of elements causing the significant changes in these costs appears under Table 2 below.
- Cash Operating Margin - I have included this line item to show the operating results before non-cash costs of depreciation and amortization. Excepting FY-2022 and FY-2019, Cash Operating Margin is insufficient to cover net interest costs. Note that I have treated Amortization of deferred drydocking & survey costs as cash costs as these costs are regularly recurring cash costs, required by regulation, and amortized over 30 months. Putting on my accounting hat and applying the accounting doctrine of conservatism, I believe these costs might more appropriately be accounted for by a deferral of revenue/amortization than a deferral of cost/amortization.
- Income (Loss) before income taxes & non-routine costs - Although day rates rose significantly in FY-2022, the result for FY-2022 is a modest $15.38 million, with large losses in all previous years.
- Other Income (Costs) - Non-routine - The greater part of these net costs is for asset impairments. These are a non-cash charge and are related to a revaluation of assets based on future earnings, rather than to current operations. I believe it is useful to exclude in making an assessment of current operations.
While FY-2022 results were far better than previous years, we need to look at quarterly results to gain a better understanding of what is driving profitability.
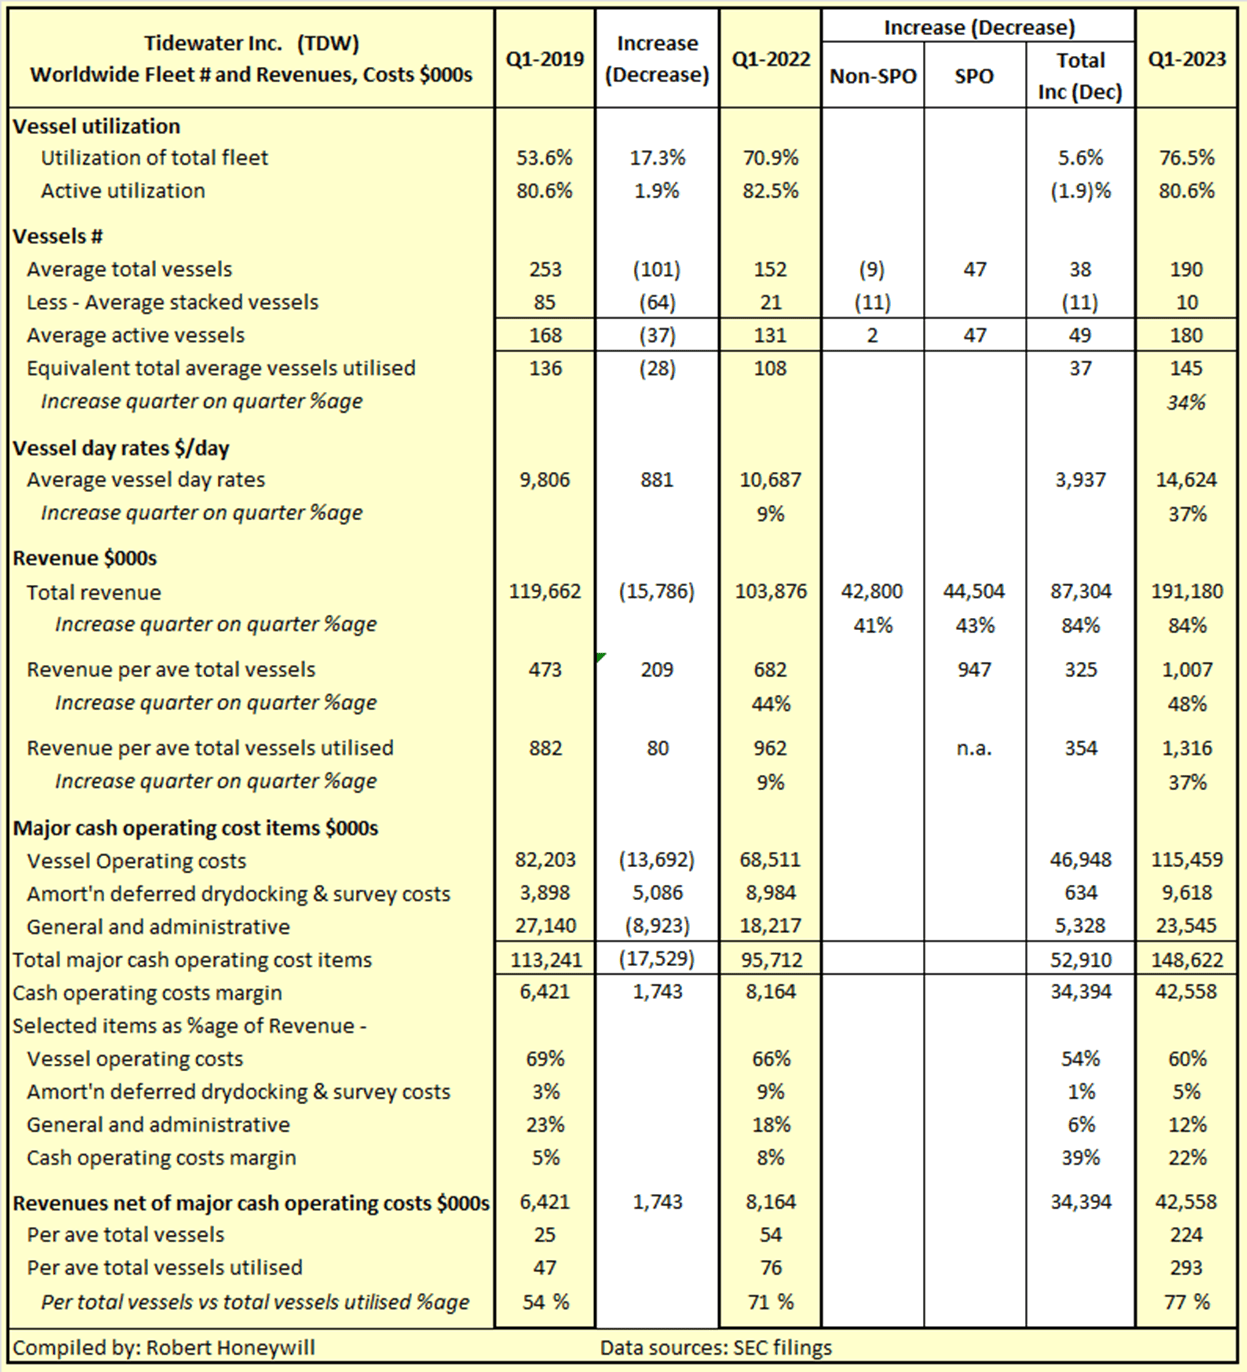
Table 2
Comments on Table 2 -
- Tidewater matching vessel numbers with demand - Table 2 reveals a story of an excessive number of vessels in Q1-2019 with low utilization at 53.6%. Disposal of 101 vessels out of a fleet of 253 at Q1-2019 reduced average total vessels at Q1-2022 to 152. This resulted in higher utilization percentage of 70.9% in Q1-2022. Stacked vessels reduced by 64, from 85 to 21 between the two periods. Between Q1-2022 and Q1-2023 total vessels increased by a net 38, comprised of 47 increase due to the SPO acquisition offset in part by 9 disposals from existing stock. Stacked vessels reduced by a further 11 to 10, resulting in total fleet utilisation increasing to 76.5%. All 47 SPO vessels were active throughout the period. The figures show that even active vessels only have an average utilization rate of ~80% due to time out for drydocking, repositioning between contracts, and other non-chargeable time. On that basis, current utilization is getting close to 100% of available utilization capacity. The proposed acquisition of 37 Solstad vessels in Q2-2023 will bring total vessels closer to, but still below Q1-2019 level.
- SPO acquisition - I have been able to garner a considerable amount of data on the impact of the SPO acquisition from commentary in Tidewater's SEC filings. While I could not complete all the squares, the data shows that over half the increase in Total revenues between Q1-2022 and Q1-2023 is a result of the SPO acquisition. This level of period on period growth due SPO acquisition will not be repeated in the second half of 2023.
- Vessel day rates and Revenue - Most of the increase in day rates and Revenue since emergence from bankruptcy has come since the end of Q1-2022. Discussion under Table 3 below provides additional information on quarterly trends since Q1-2022.
- Vessel operating costs as %age of Revenue - These costs have reduced from 69% of revenue in Q1-2019 to 60% in Q1-2023. This appears to be more as a result of higher day rates driving revenue higher, rather than increased efficiencies driving costs down.
- Amortisation deferred drydocking & survey costs - As noted above, FY-2019 had the benefit of nil deferred costs on emergence from bankruptcy. The acquisition of 47 active vessels from SPO, with no deferred costs will have also likely had an impact on deferred cost amortization, pending these vessels starting to come up for survey. A more appropriate accounting policy of providing for these regularly recurring costs by deferring revenue would likely avoid these inconsistencies in matching costs and revenue.
- General and administrative - In absolute terms, these costs were reduced by around one-third between Q1-2019 and Q1-2022. It is understood this was mainly due to a downsizing of the support workforce at the same time as vessel numbers were reduced by around 40%. In percentage of revenue terms, these costs came down from 23% to 18% between Q1-2019 and Q1-2022, and to 12% for Q1-2023. As for Vessel operating costs this appears to be more due to higher day rates and vessel utilization driving revenue growth, rather than efficiencies driving cost reduction.
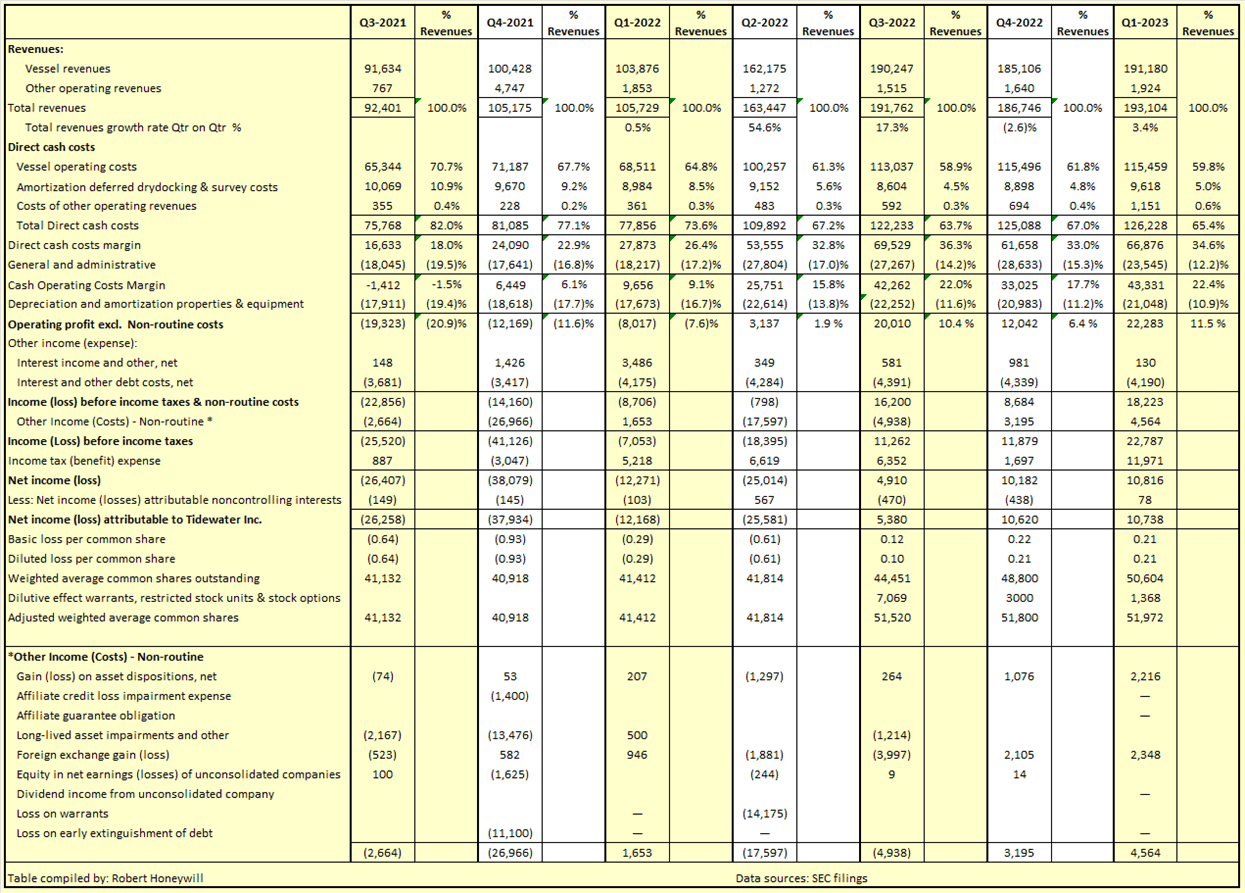
Table 3
Table 3 shows a more than doubling in Total revenues between Q3-2021 and Q3-2022. As discussed above around half of this appears to be due to the impact of the SPO acquisition and the balance due to increases in day rates and higher utilization, also contributed to by the SPO acquisition. But Q3-2022 appears to be where further growth flattened out or ceased. Revenues were lower in Q4-2022 and only slightly above Q3-2022 in Q1-2023. Cash operating costs margin has a similar trajectory, lower than Q3-2022 in Q4-2022 and only slightly higher at $43,331 Q1-2023 versus $42,162 in Q3-2022. The acquisition of 37 Solstad vessels planned to close in second quarter should result in higher revenues and earnings in the second half of 2023, even without any increases in day rates and utilization rates.
Analyst EPS estimate and P/E ratio
The sole SA Premium analyst covering Tidewater for 2023 estimates EPS at $3.32 per share. I have difficulty in understanding how Tidewater will generate an additional $3.11 EPS in the remainder of 2023. That would require average EPS over $1.00 per share for each of the remaining three quarters. That is around five (5) times the $0.21 EPS for Q1-2023, per Table 3 above. Even if Tidewater were capable of achieving EPS of $3.32 per share in 2023, that equates to a forward P/E ratio of 15.0 at the current share price of $49.94. For a non-dividend paying company in a highly cyclical industry that has mostly been reporting negative EPS since emerging from bankruptcy 5 to 6 years ago, a P/E ratio of 15.0 appears excessively high. Compare to Fortescue Metals Group Limited ( OTCQX:FSUMF ) ( OTCQX:FSUGY ), also in a cyclical business of iron ore mining, processing and sale. Fortescue has 8 consecutive years of dividend payments, supported by positive EPS in all those years, a current dividend yield of 10.19% at a payout ratio of 71%, and a TTM P/E multiple of 6.78.
Summary and conclusions:
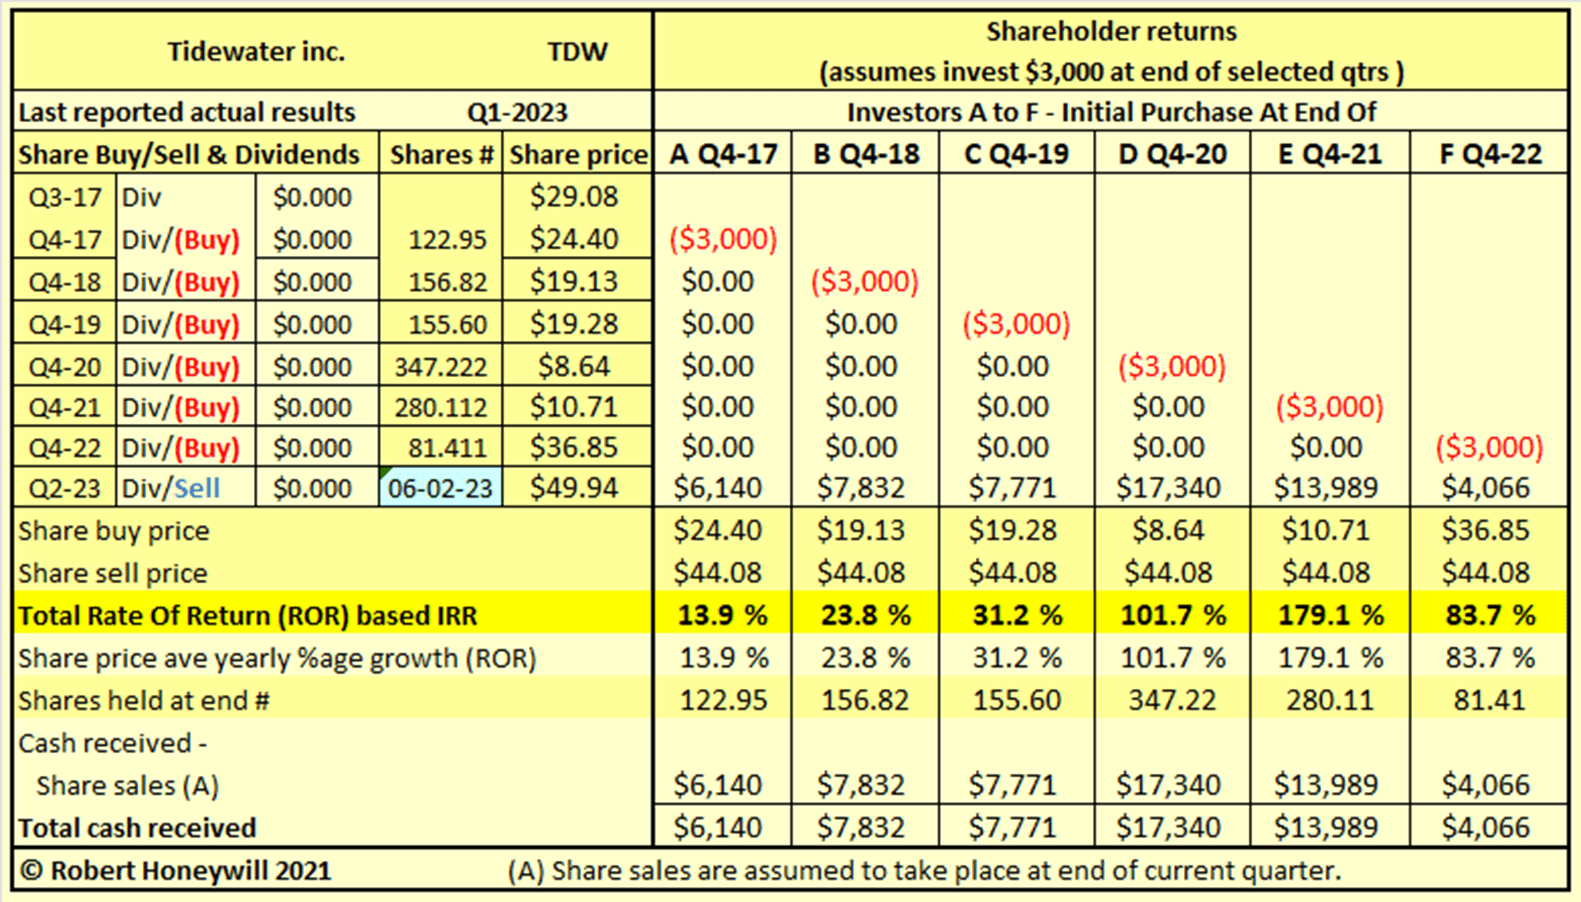
Table 4
As shown in Table 4 above, Tidewater has mostly delivered outstanding shareholder returns for those buying since emerging from bankruptcy. I say mostly, because some may have purchased in 2023 at a price above the current level. Table 4 shows there has been a great deal of volatility in the share price. This has continued into 2023, with a high of $51.88 on March 7, and a low of $37.76 on March 17. At the current share price of $49.94, now might be a good time to follow SPO and Solstad, and exit all or part of holdings to lock in gains. That might result in missing some more upside. But, given the volatility in the share price, it could also result in an opportunity to buy back in at a much lower price, if so desired.
For further details see:
Tidewater: This Might Be As Good As It Gets