IWM - TLT Could Be A Winner Even Without A Soft Landing
2023-09-29 17:18:23 ET
Summary
- Long-term treasury yields have broken through a 40+ year downward channel as investor fear over rising inflation and interest rates have led to a capitulation in the bond market.
- Sustained deviations in stock and bond returns are unlikely unless risk-premiums have substantially changed, an event I find highly unlikely.
- The trade provides asymmetric upside as cash yield will provide a comfortable return even without price appreciation.
Why TLT is a Winner, Even Without a Soft Landing
Stock and bond returns have dramatically separated over the last 18 months. While the bond market has priced in an "overheating" economy with high short-term growth with lower long-term growth (i.e., inverted 2s/10s yield curve), the stock market has rallied back near all-time-highs pricing in a "soft landing" (reduced inflation with sustained economic growth). Readers of my articles know I'm skeptical of this theory but I've lately been looking for plays that will work even if somehow the soft-landing thesis is correct. Long duration, long short-term risk free are two plays which I think have asymmetric upside with limited downside risk due to the massive dislocation between risk pricing in the bond and stock market.
Seeking Alpha
I think in the long run this dislocation is unsustainable and will mean revert as bond yields return to long-term trend levels.
Macro
Two of my core tenants for initiating any investment (which I outlined in my original article A Recession is Inevitable, Don't get Fooled by Bear Market Rallies ) are A) don't fight the global liquidity cycle and B) make trades congruent with the economic outlook for the next 18 months. Funny enough, this article was written almost exactly 1 year ago - over that time, the S&P 500 is up ~13% and TLT is down by ~9.5% (total return). Unfortunately, the market over that time has behaved in a predictably irrational pattern, pricing in a best-case scenario soft landing for stocks while pricing in sustained long-term inflation for bonds. On a probabilistic list of outcomes, this would be one of the least likely outcomes and the Fed itself has forecast a noticeable slowdown in growth by year-end .
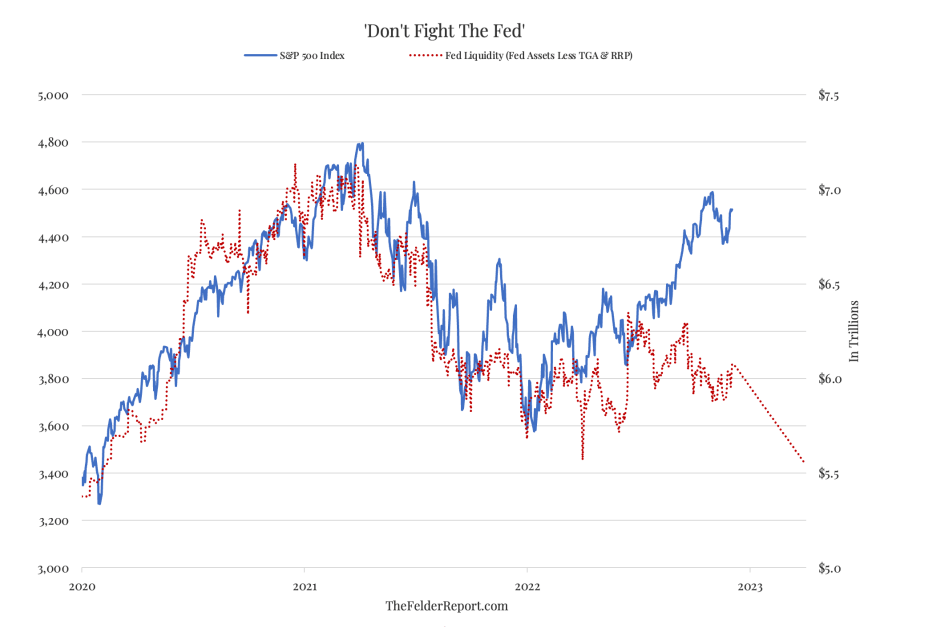
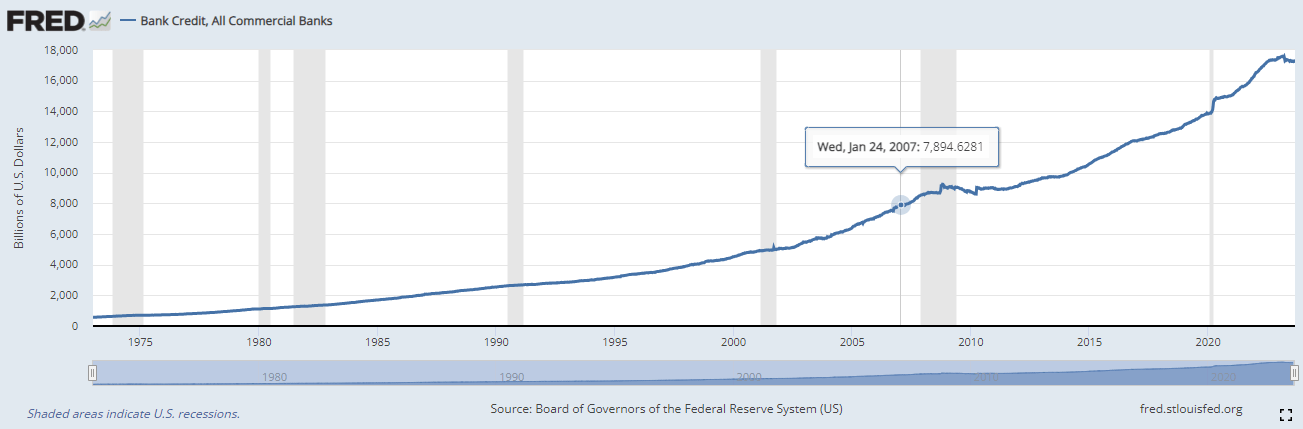
The chart above from the Felder Report shows the divergence between fed liquidity and market performance with the red dashed line at the end estimating liquidity dynamics over the next several months due to TGA balance needing to be replenished and fed tightening continuing at its scripted rate. This chart by itself makes me extremely wary of risk assets and should be at the center of every investor's mind. As liquidity tightens - cash is king and investments in risk assets should be heavily scrutinized. Combine this with tightening lending standards at the commercial banks and a restrictive credit cycle - the liquidity environment is not favorable. (Obviously, you could argue this is bad for treasuries too, I discuss this in the risks section).
Bloomberg
Bloomberg economists are predicting negative real GDP growth over the next twelve months - obviously, economists' projections (like Fed projections) should be taken with a grain of salt but combined with falling leading indicators should also weigh heavily on investors' minds as they consider the economic outlook for the next several months. As the credit cycle continues to roll over, the highly levered US economy will struggle to sustain positive output growth - ignore the credit cycle at your own peril.
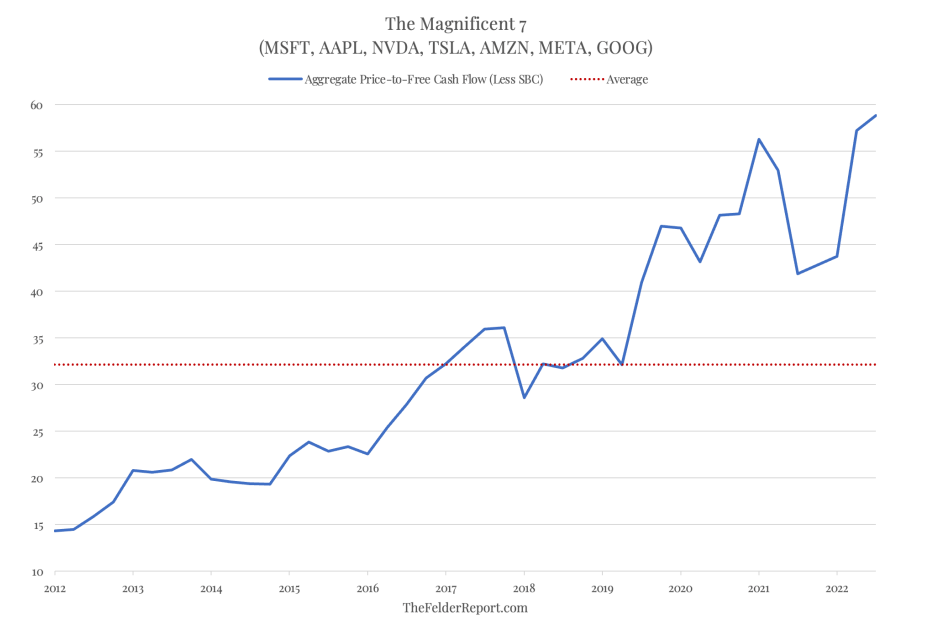
The stock market has not been as healthy as the large rally over the past 12 months would suggest. Gains have been highly concentrated among the "Magnificent 7" tech stocks, particularly for the NASDAQ and the impact can been seen in the divergence in performance between the equal-weighted indices vs. the standard index. I'm not sure anyone could convince me that 60x P/FCF is a fair price to pay for these stocks no matter how high the quality and growth. If these companies were to produce 60x the cash flow they currently produce, their output would rival many countries. It's unreasonable to assume that companies this big will continue to grow at rapid rates (if not purely for anti-trust concerns). If valuations on these stocks mean-revert this would produce tremendous pressure on the entire stock market given the concentration of these stocks in major indexes.
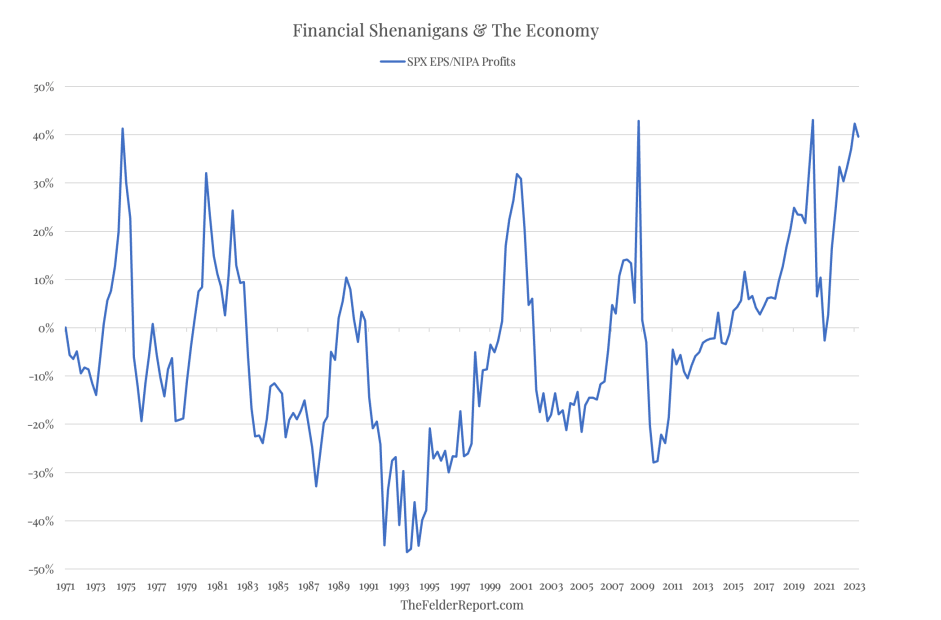
A chart I saw that really stood out to me as a strong late-cycle indicator is the SPX EPS / NIPA Profits going back to 1970. NIPA profits represent "income from current production" and are reported to the BEA for economic analysis. These profits can be thought of as "real" or "current" output vs. accounting EPS earnings which can be influenced over the short term by management teams. The idea is that in periods of declining economic activity but before the bottom falls out, management teams pull forward profits to the current period to bolster flailing earnings. However, this can only go on so long before the rubber meets the road and economic reality sets in causing accounting profits to mean revert (and often flip to a negative ratio with NIPA profits during recession. This indicator is extremely reliable in predicting recessions as you can see from the chart above and we are now at levels only seen previously 3 times since 1970. Even if there is not a recession, simple mean reversion of this ratio will put pressure on EPS across the board and should promote a more fearful / cautious environment in the stock market which should be beneficial for treasury securities.
JPM
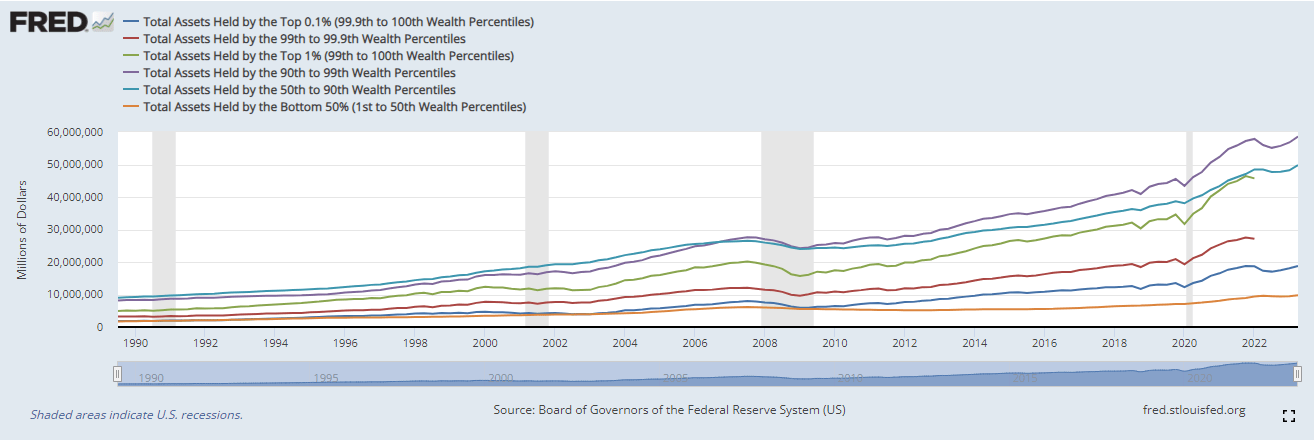
Another chart which I think is significant in assessing the current state of the cycle is the consumer excess savings chart above from JPM. The bank estimates that there are only ~$0.2T of excess savings left from COVID-era stimulus. While total savings are still at relatively normal levels, these savings are concentrated in the top 10% of wealthiest individuals in the US. As the bulk of Americans run out of excess savings, the demand impulse should continue to decrease.
The labor market has been strong over the past 18 months, but job openings have slowed and payroll gains have been in a consistent downtrend, exposing cracks in the labor market.
FRED
Auto and credit card delinquencies have picked up , again highlighting some weakness in the consumer balance sheet.
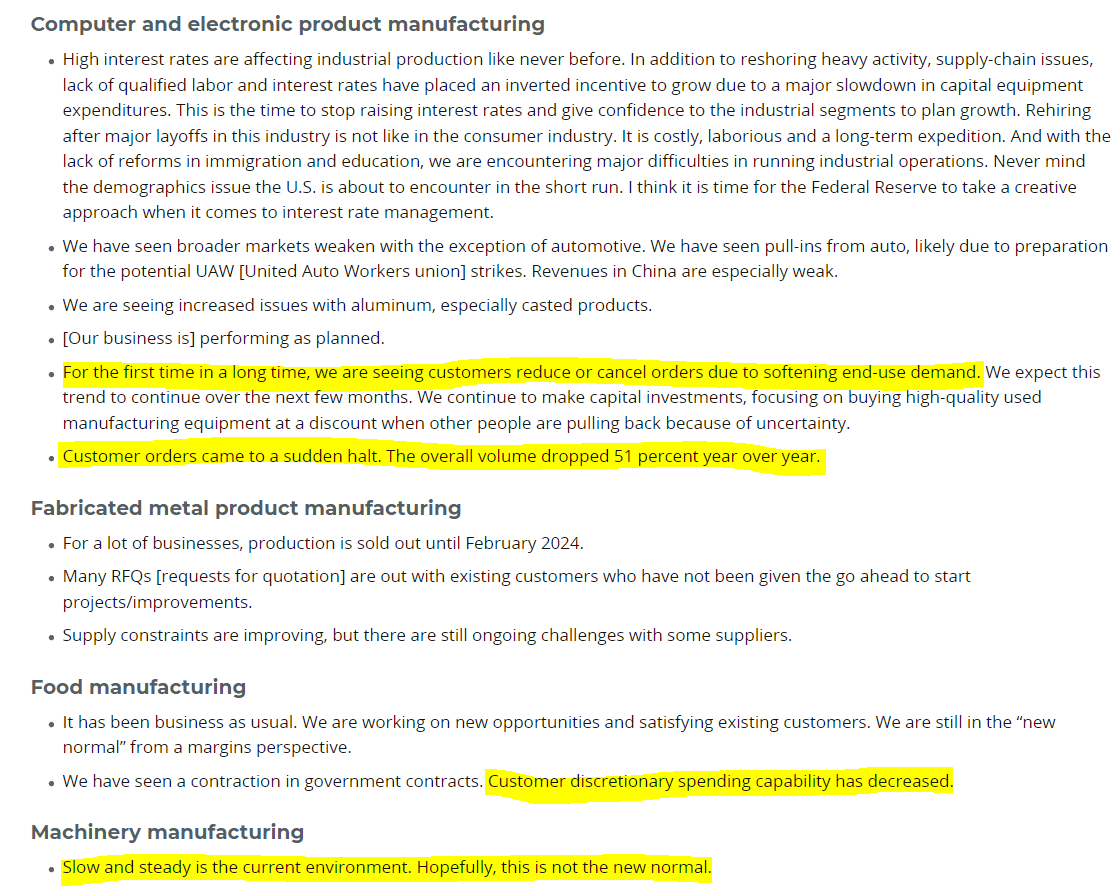
Finally, I'll end with some quotes from the latest Dallas Fed manufacturing survey which I believe are particularly harrowing, as the narrative has shifted away from complaints about input costs and labor and towards softening consumer demand. If this softening demand materializes in a broad scale across the economy then the current economic expansion will end quickly as lately it's almost entirely been driven by consumption.
Zooming in on TLT
TLT Factsheet TLT Factsheet
TLT ( which is a majority of T Bonds ) - has underperformed dramatically since the Fed began hiking rates last April. Looking at the total return performance table, the recent underperformance has been so sharp that it's dragged the 5-year performance negative. This is pretty astounding when you think about it - what is essentially the longest duration "risk-free rate" has a negative total return over the last five years, demonstrating that no asset is truly risk-free (keep in mind this is a nominal return not an inflation-adjusted return).
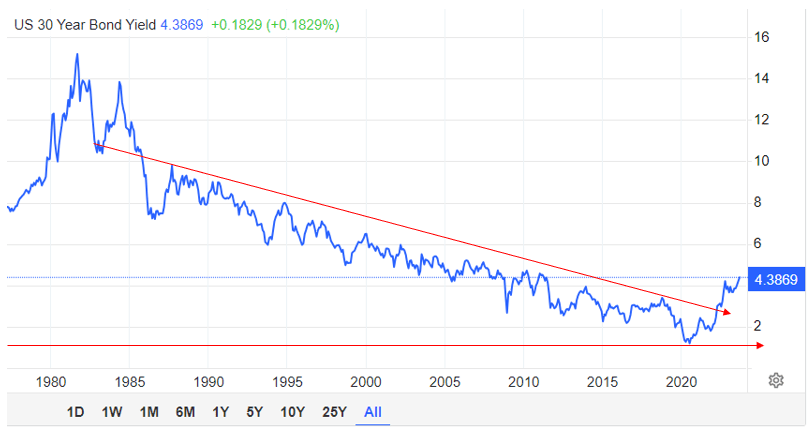
The long-term Treasury bond yield chart is one of the most important charts in all of finance - it's indicative of a number of macro trends which define the era we live in. Aging workforce, decline in productivity and labor force participation, sluggish growth, lack of innovation and perhaps most importantly uniformly dovish monetary policy which has encouraged low rates for the last 40 years. Obviously, there have been intermittent periods of rising rates but overall these brief periods barely stand out on this chart apart from the current cycle which broke one of the long-term downward channels (red lines on the chart). I would consider this a capitulation event and this early in the cycle, this is a gift from the market gods. An opportunity for a savvy and sober-minded investor who understands that the world is not ending to reinvest in one of the best performing asset classes of the past 2 generations. Opportunities like this do not appear often and what makes this even more compelling is the asymmetry of the trade.
"Buy when there is blood in the streets" - the classic value mantra applies here as the bond market has become overly pessimistic both on inflation and growth outlook. As I've discussed above, inflation is likely to be stickier than the Fed and most market participants are hoping but I also believe that the economy is in its most overheated state currently and will likely begin to slow in the coming months which will send rates lower. However, even if I'm wrong on my economic outlook (and trades should never be made on economic outlook alone - just ask Howard Marks ) and the economy does obtain a soft landing with cooling inflation, this will also result in lower rates (unless of course the economy emerges stronger than before and rate are permanently higher to compensate but that outcome is also unlikely given the demographic and long-term macro dynamics at play in the US economy).
Furthermore, I like how the 30-year has been in a relentless march upwards despite cooling inflation, a FED who appears to be tapped out on interest rate hikes (or at least close to it), and some early signs of an economic slowdown. The bond market is so fearful that it refuses to allow for any optimism and despite the 30-yr being mostly flat for the year it has made a 50 BPS surge over the past 3 months while the stock market has been mostly flat. This divergence in return will almost certainly mean revert - risk premiums have been falling over time and a large, sustained divergence in stock and bond performance is unlikely, perhaps impossible.
Risks
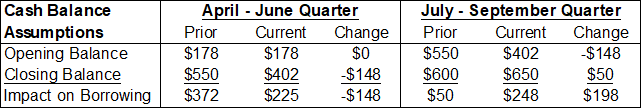
The main risk to this trade, particularly in the short term in my opinion is the imbalance in supply and demand in the treasury market. The TGA remains relatively depleted and the US Treasury estimates that issuances will increase substantially heading into the end of the year. This fear of supply-demand imbalance has fueled the treasury selloff for the last few months.
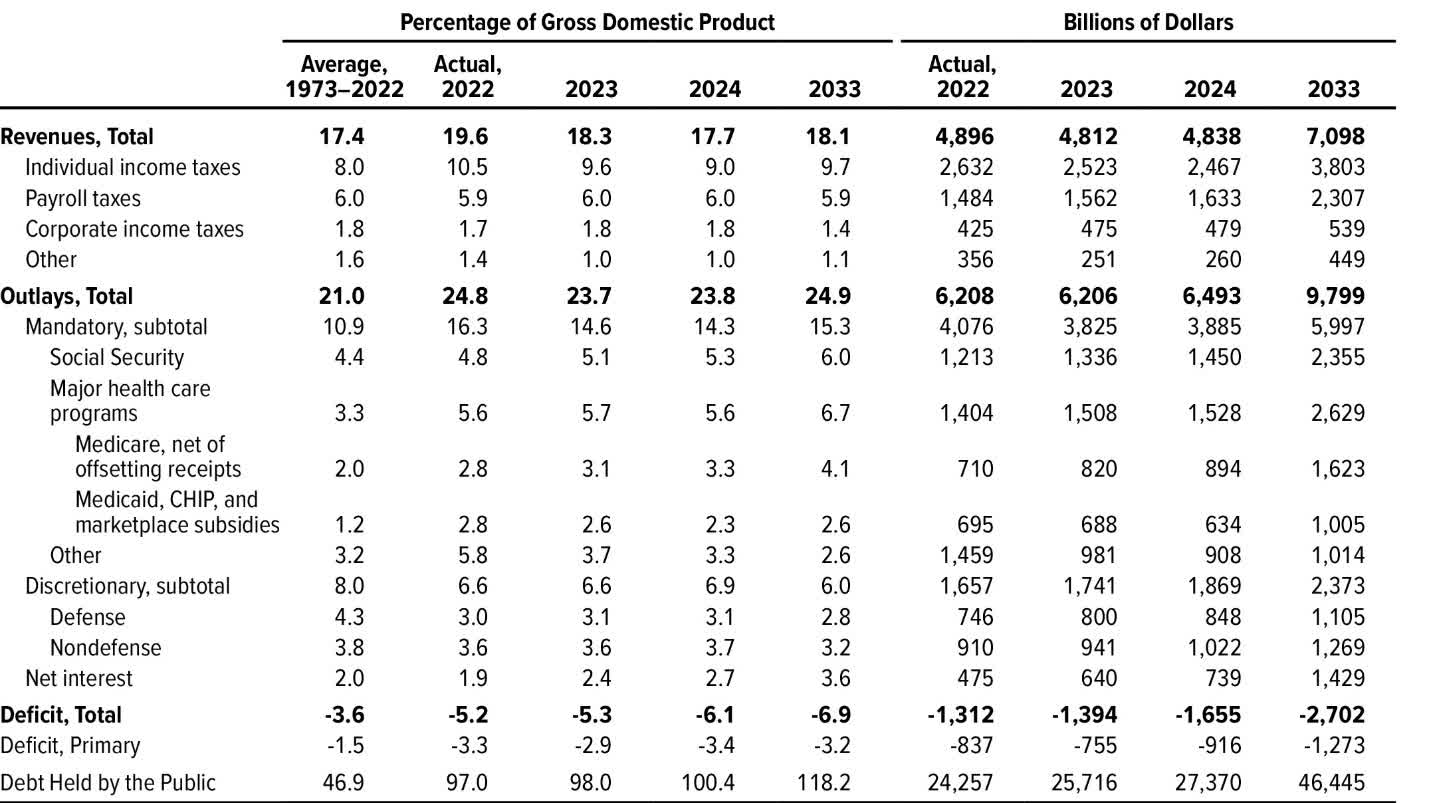
It's a little hard to predict quarterly changes in treasury issuance. Ultimately, the CBO projects the deficit to increase over the coming 10 years as social security, Medicare, and Medicaid spending growth outpaces growth in tax receipts. In general, this will put pressure on the treasury market in the absence of QE to soak up the excess supply. A) I think most of this fear is priced in and B) I highly doubt the Fed will allow the treasury market to implode given the implications for financing the US government and on the broader economy. While the Fed is not mandated to stabilize the treasury market, look at their actions since the GFC - they've been mostly committed to buying treasuries over this time period and I imagine they will return to form as quickly as possible. The US economy cannot afford massively higher rates on such a large debt balance and I feel comfortable betting on the rates mean reverting closer to pre-COVID levels. Obviously, no trade is truly risk free and if rates stay higher for longer, it will limit the upside of this trade. However, even in that case you can lock in an attractive yield at current rates which limits the downside.
Conclusion
In conclusion, the treasury bond market has deviated substantially in performance from the stock market over the past 18 months. Historically, these deviations tend to mean revert and given the long-term trend towards lower rates since the 70s, I believe rates will continue to trend lower (even if they don't get back to the pre-covid lows). Buying TLT is asymmetric due to the high yield currently and worst case, can clip a strong coupon if rates stay at current levels.
For further details see:
TLT Could Be A Winner Even Without A Soft Landing