VGSH - TLT: Forecast Using Conservative Interest Rate Assumptions
2023-08-31 00:30:28 ET
Summary
- Even using conservative interest rate assumptions and aggressive stock market expected returns, long-term treasuries have a higher expected return and lower risk compared to the stock market.
- Bond math dictates that long-term treasury returns are asymmetrically positive when the potential upside and downside moves of interest rates are assumed to be the same.
- History, the inflation mandate of the Federal Reserve, and the potential contraction of private credit suggest that interest rates have a higher probability of decreasing than increasing.
Introduction
My first article on the iShares 20+ Year Treasury Bond ETF ( TLT ) discussed the current financial environment and why low-risk assets such as treasuries are better long-term investments than higher-risk ones. My second article details different ways of investing in long-term treasuries and the product features of TLT. This article forecasts the expected return and risk of TLT using several interest rate scenarios and bond math. It shows that TLT has a superior risk-return profile to the stock market, even using generous assumptions for the expected return of the S&P 500.
Interest Rate Assumptions
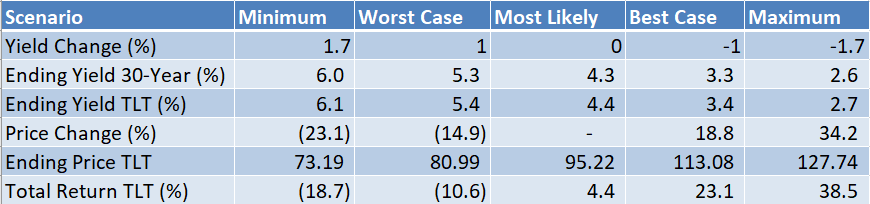
The total return for TLT is estimated for five different scenarios: Minimum (0 th percentile), Worst Case (10 th percentile), Most Likely, Best Case (90 th percentile), and Maximum (100 th percentile). To arrive at these scenarios, corresponding long-term interest rates must first be estimated. Historical data, current data, and best guesses underlie the following assumptions.
Minimum (0 th percentile): The highest possible level of 30-year interest rates is perhaps the most difficult scenario to estimate. First, I believe that the current level of interest rates is unsustainably high, or “restrictive” in the language of the Federal Reserve. In the medium term, I expect government credit to continue to expand at the expense of private credit. This is deflationary. Eventually, it should push the economy into a recession and cause the Fed to lower rates. If rates in the short-term were even higher, then deflation and recession would likely occur more quickly and with greater severity.
Decomposing the current yield into inflationary and real-yield components provides another perspective. If a reasonable expectation for long-term inflation is somewhere near the 2% mandate of the Fed, then the current real yield is at least 2% as well. For long-term inflation expectations to be much higher, it seems like the Fed would have to change its mandate. Jerome Powell has resisted doing this, and it seems extremely unlikely that the current board of governors would risk drastically unmooring market expectations. If the real yield increased further, it would pressure all other asset classes including stocks and corporate bonds. The resulting decrease in asset prices would pressure both affluent consumers and corporate borrowers. Deflation should be the result.
History provides yet one more viewpoint for how high long-term rates could climb. The largest recent increase in rates within a single-year occurred from December 2021 to October 2022 and was 2.66%. However, interest rates at the time were abnormally low, and the change in rates was prompted by an unexpected spike of inflation. Currently, inflation and rates are already at 10-year highs, and it seems hard to fathom how inflation expectations could change this much again.
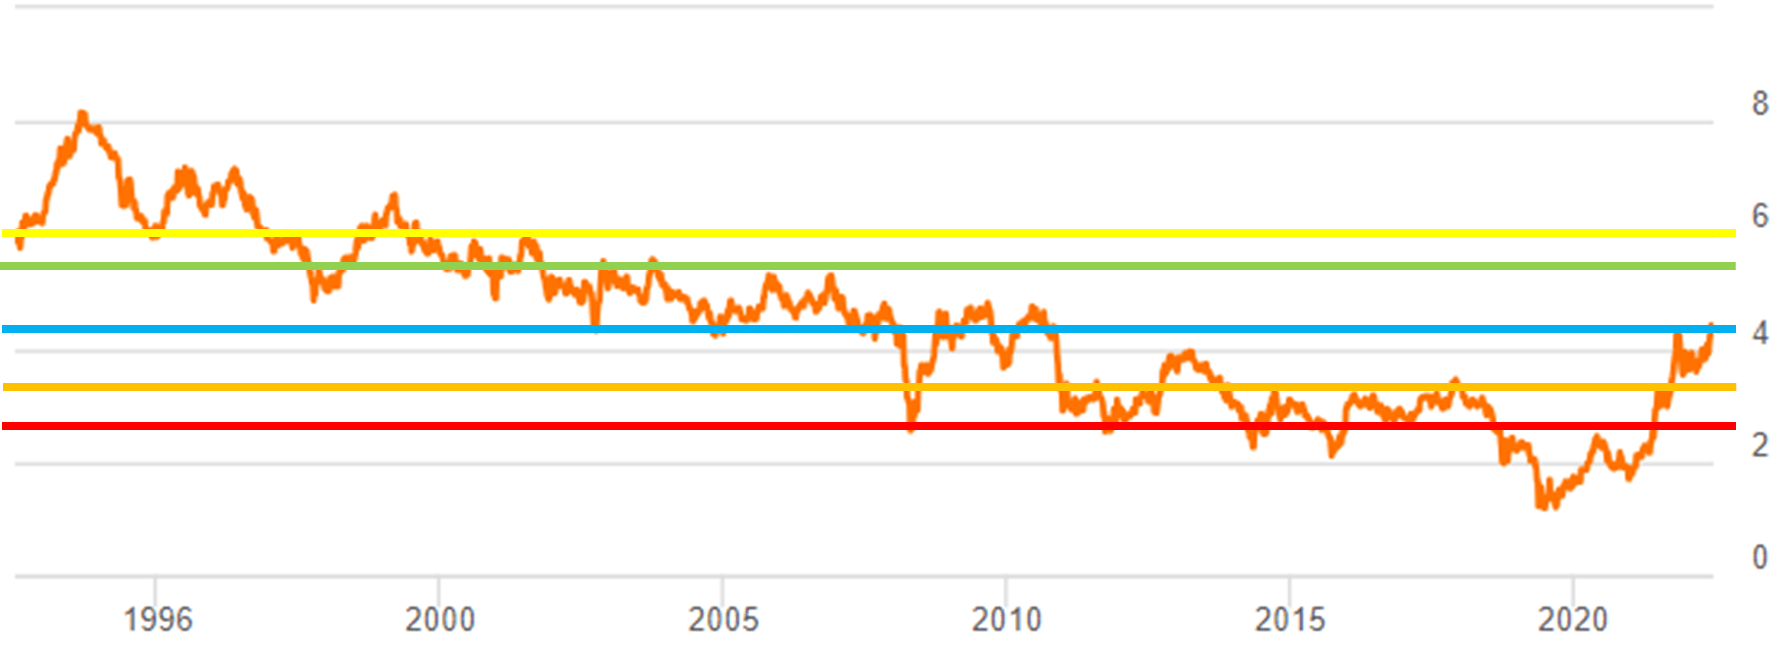
Given these considerations, a 6% maximum possible level of 30-year interest rates seems to strike a balance between conservatism and realism. As shown in the graph at the end of this section, this level of long-term rates has not been reached since the early 2000s and would represent a 1.7% increase from current levels. In the short-term there are many factors that could cause a temporary spike in rates such as leveraged bets against treasuries, poor auction results, and other countries unwinding their holdings. Within the last month, these have accounted for about a 30bps rise in rates. A 6% level allows for about six more such spikes. On the other hand, the fact that interest rates have already increased makes further increases of similar magnitude less likely. 6% reflects that view as well.
A counterargument can be made that high levels of rates cause future increases. High rates mean the US government spends more money on interest payments. Since Congress is unlikely to either raise taxes or meaningfully curtail spending, the additional interest will need to be financed with yet more debt. The additional debt issuances push up rates further and so on. In isolation, this argument is valid. However, it neglects at least two important points. First, the above argument does not account for the detrimental impact of high rates on the economy. Second, high rates reduce bank lending and mortgage, corporate, and municipal debt issuance. As a result, the size of debt markets can contract even though federal debt increases. These last points underlie the reason why I believe rates will decline over the medium term.
Worst Case (10 th percentile): Using similar reasoning to the Minimum scenario, this interest rate scenario is assumed to be 5.3%, or 1% above current rates. The last time interest rates were this high was in July 2007, or 16 years ago. This level is also close to the current one-year yield.
Most Likely: To be conservative, this scenario assumes rates stay constant over the next year and an investor in long-term bonds would receive the current yield-to-maturity.
Best Case (90 th percentile): Although I expect the Fed to ease interest rates eventually to combat a recession, I do not expect that long-term interest rates will decrease to 2020-2021 levels. The Treasury has drastically increased issuance since the pandemic, and the resulting increase in supply will limit how low rates can fall. To account for this, I assume that the interest rates would reach 3.3%, or 1% below current levels, in the event of a moderate recession over the next year.
Maximum (100 th percentile): Using similar logic to the Best Case scenario, I expect interest rates would drop 1.7% and reach 2.6% in the event of a severe recession over the next year. This is more than 1% above pandemic lows.
US 30-Year Bond Yield over the past 30 years with interest rate assumptions overlay (Seeking Alpha and Poppertech)
Total Return Scenarios
Next, the above interest rate assumptions are used to calculate total return. The formula for the percentage price change of a bond is as follows:
Price Chg(%) = -Yield Chg*Modified Duration + .5*Convexity*Yield Chg 2
The TLT product page supplies the Modified Duration and Convexity parameters in the above equation. Using these parameters, the yield change assumptions from the previous section, and the assumption that an investor receives the current YTM of TLT in interest results in the following 1-year total returns for each scenario:
Forecast
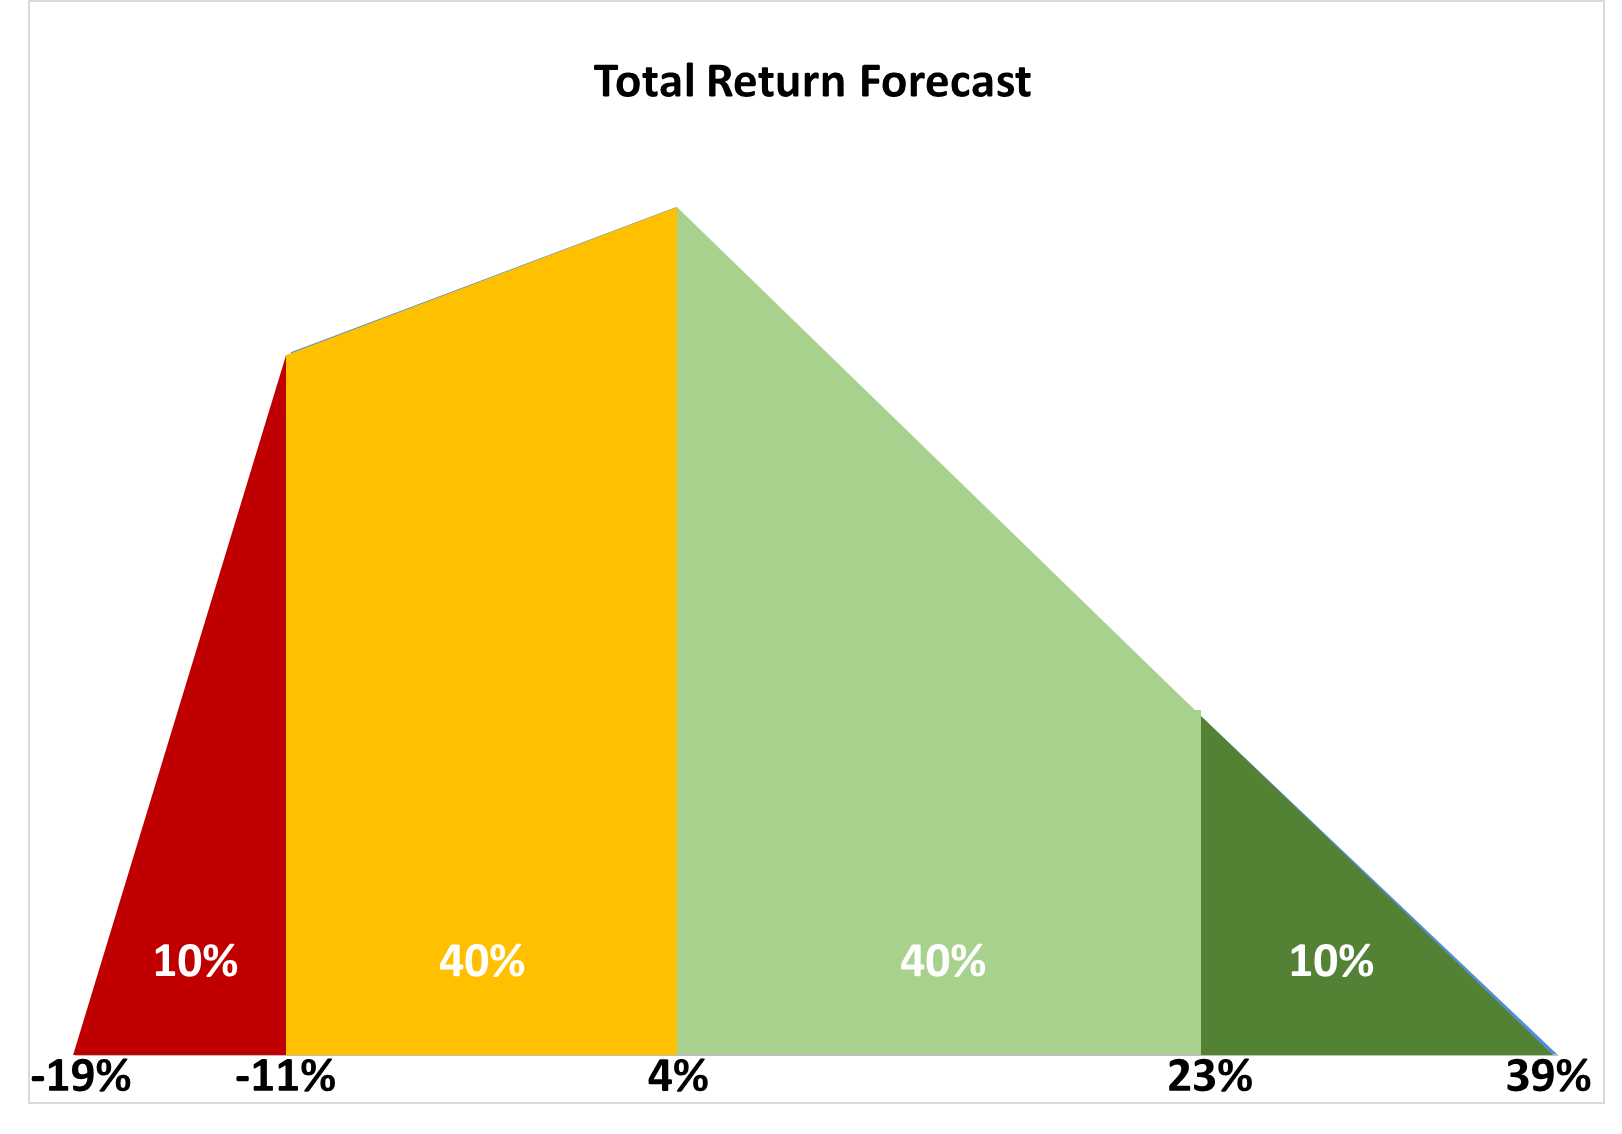
To create the forecast, the above scenarios are input into software that creates the graph below and calculates the associated statistics. The black values underneath the graph indicate the total return values as shown in the previous table of scenarios. The white percentage values overlaid on the graph correspond to the proportion of the total area under the curve within each colored region. This is the forecast probability of the total return falling within the associated range. For example, the light green region represents a 40% chance that total return is between 4% and 23% over the next year.
Based on the above forecast, the software calculates expected return and risk. The resulting statistics are shown below.
TLT Forecast Statistics (Poppertech)
The 5.3% expected return of TLT is slightly higher than the generous, assumed 5% expected return of the S&P 500 used in my first article on TLT. TLT forecast volatility of 12.5 is slightly lower than the current VIX level of 14.58, which approximates the implied volatility of the stock market. My second article described the risk-reward of TLT as being asymmetrically positive. The .32 skewness of the above forecast quantifies this asymmetry. In summary, the above interest rate assumptions result in a forecast for TLT with a superior risk-reward profile to the stock market.
For further details see:
TLT: Forecast Using Conservative Interest Rate Assumptions