TZA - TNA And TZA: Shorting Both Produces An Attractive Pairs Trade
2023-09-18 10:41:29 ET
Summary
- Shorting both TNA and TZA would have produced an annual net return of about 16% over the last year.
- Risks include mechanical problems, changes in the volatility of the Russell 2000 smallcap index, changing borrowing fees, variable yields, and a strongly trending underlying index.
- Because the strategy requires one to short both tickers, I currently rate TNA and TZA as Sells.
Thesis
I have been researching low volatility couples for use in a margin portfolio. While researching the pairing single-ticker covered call ETFs against leveraged ETFs, I noticed many of the volatility hedges I was finding were producing their own attractive returns.
In this article I am reviewing the potential of shorting both Direxion Daily's Small Cap Bull 3X Shares ETF ( TNA ) against their Small Cap Bear 3X Shares ETF ( TZA ). Because the strategy requires one to short both assets, I currently rate both TNA and TZA as Sells.
Fund Backgrounds
Both funds seek to achieve behavior which corresponds to 300% or -300% of the daily performance of the Russell 2000 Index. Currently, TNA carries a gross expense ratio of 1.09%, while TZA carries a 1.03%.
Why They Erode
Because they have a higher beta than their underlying, leveraged assets often experience an erosion of their Net Asset Value over time. They are designed to move in relation to the price action of their underlying on daily timeframes; they are unable to maintain correlation on longer ones.
When an asset grows by 25% in one day, it would need to fall by 20% the next day to return to its previous value. A 50% increase would only need a 30% drop to return to its previous value, while a 50% loss would need a 100% gain to recover.
To clarify this interaction, let's look at an example where an underlying falls by 10% on day one, and then rises by 11.1111% the following day. With these two days of price action, the underlying will have moved to its previous value.
100 x (0.90) x (1.111111) = ~100.00
However, a 3-times leveraged ETF tied to it, will be forced to experience larger moves and will not return to its previous value.
100 x (0.70) x (1.333333) = 93.33331
While the orginal has moved down and then back up to its original value, the leveraged ETF tied to it has lost ~6.66%.
Although this scenario would represent a significant two-day drop and then recovery, the many small moves which occur regularly compound over time. This is why it is unwise to be long a leveraged ETF over longer periods. Enough investors have misunderstood their behavior that the SEC and FINRA issued warnings.
Historical Performance
As we will see, under most circumstances the pair loses value, so shorting them produces gains. However, when the Russell 2000 trends significantly, one of the two sides of the couple will gain value. This means the short couple has the potential to end up significantly underwater for periods of time. Over longer timeframes, the degradation caused by leveraged correlation eventually causes the NAV decay to overcome the short and medium term moves the Russell 2000 experiences.
Over the last month, TNA is down 10.54% and TZA is up 10.64%. The short couple would be down by 0.05%.
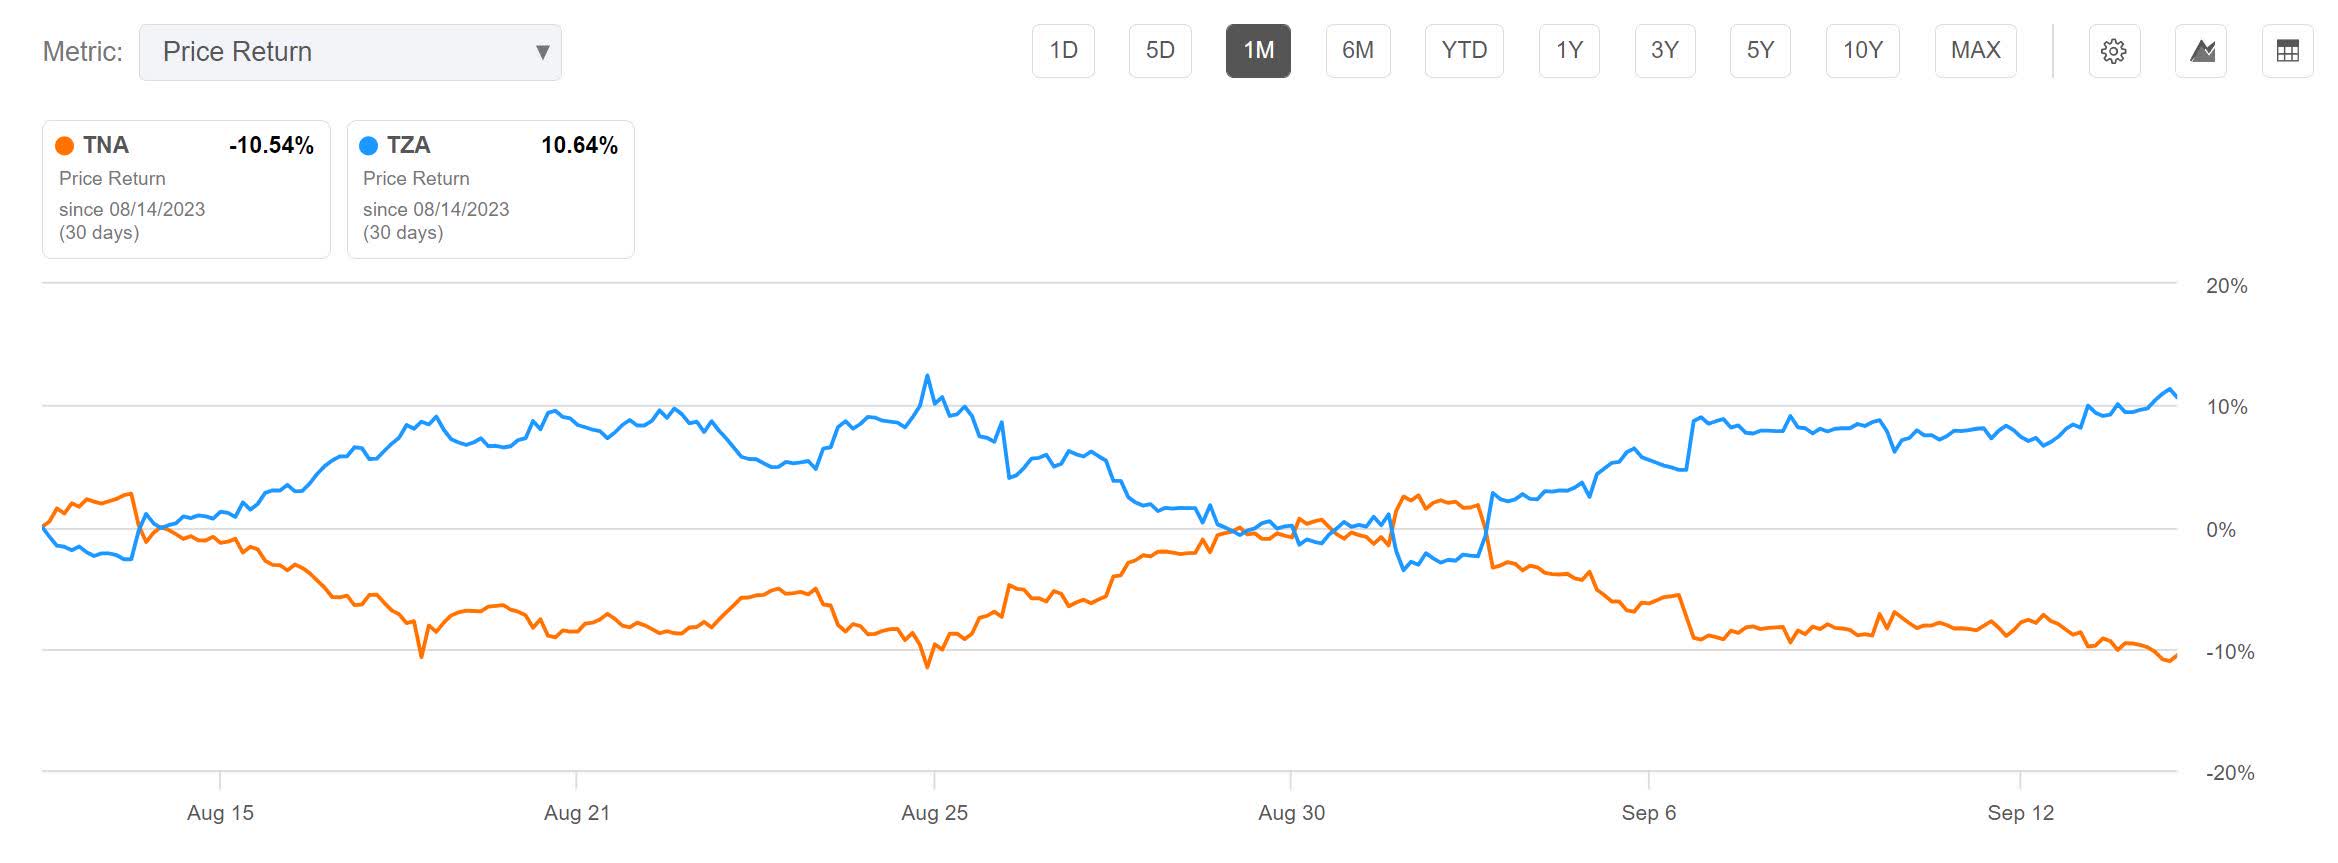
TNA vs. TZA 1-Month (Seeking Alpha)
Over the last 6 months, TNA is up by 7.13% and TZA is down by 19.34%. The short couple would be up by 6.105%.
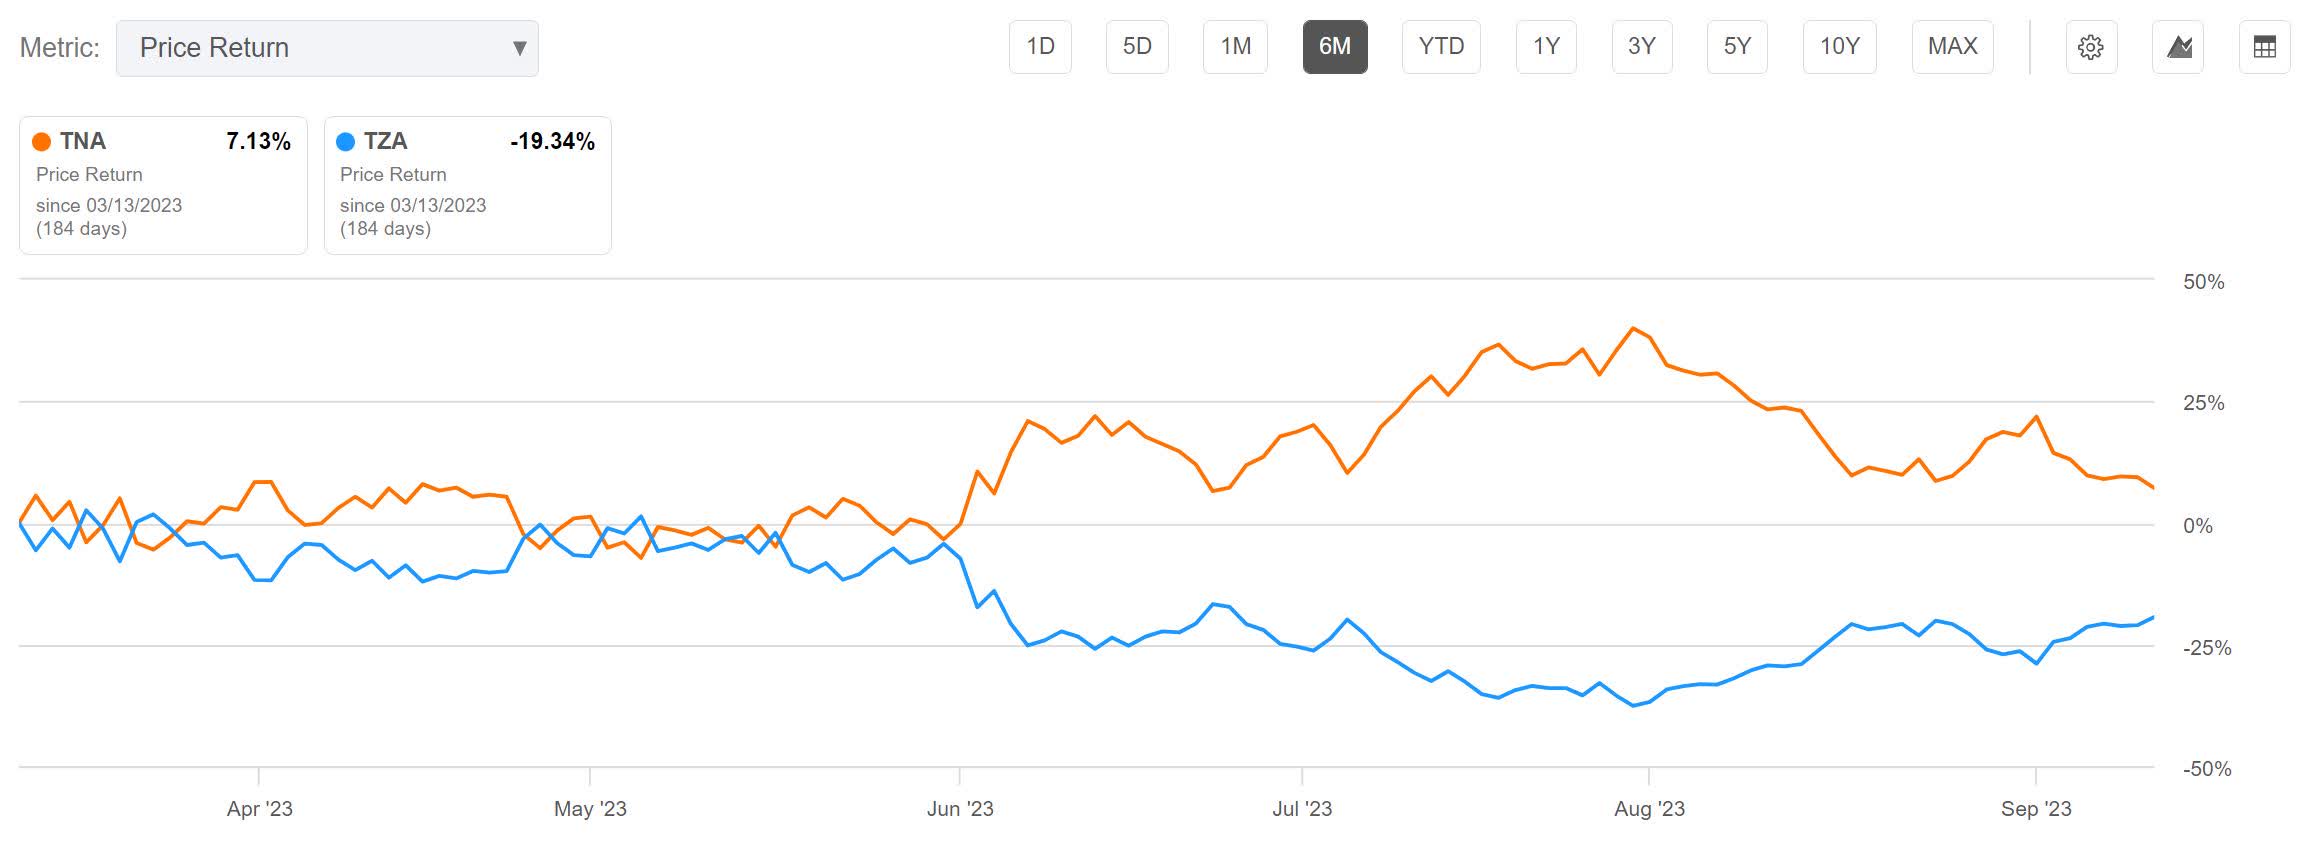
TNA vs. TZA 6-Month (Seeking Alpha)
Over the last year, TNA is down by 17.94% and TZA is down by 19.41%. The short couple would be up by 18.675%.
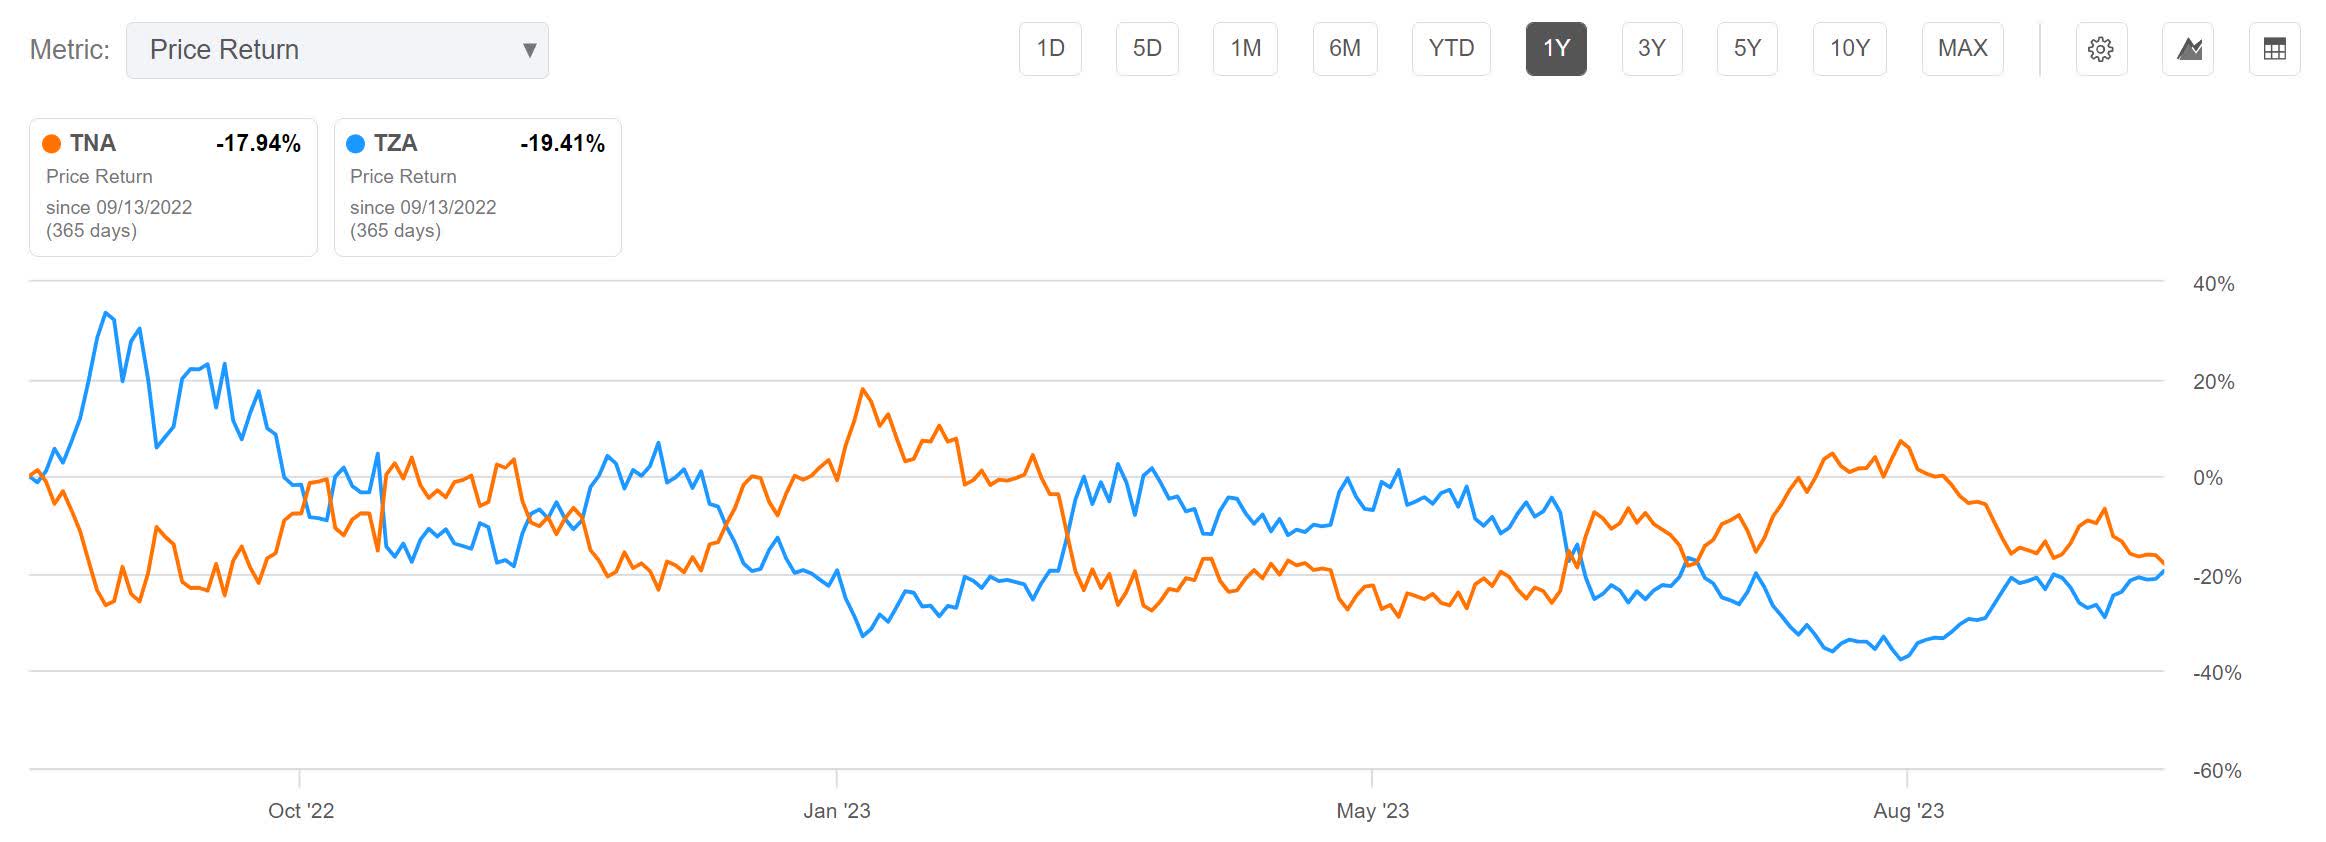
TNA vs. TZA 1-Year (Seeking Alpha)
Over the last 3 years, TNA is up by 2.12% and TZA is down by 79.22%. The short couple would be up by 38.55%.
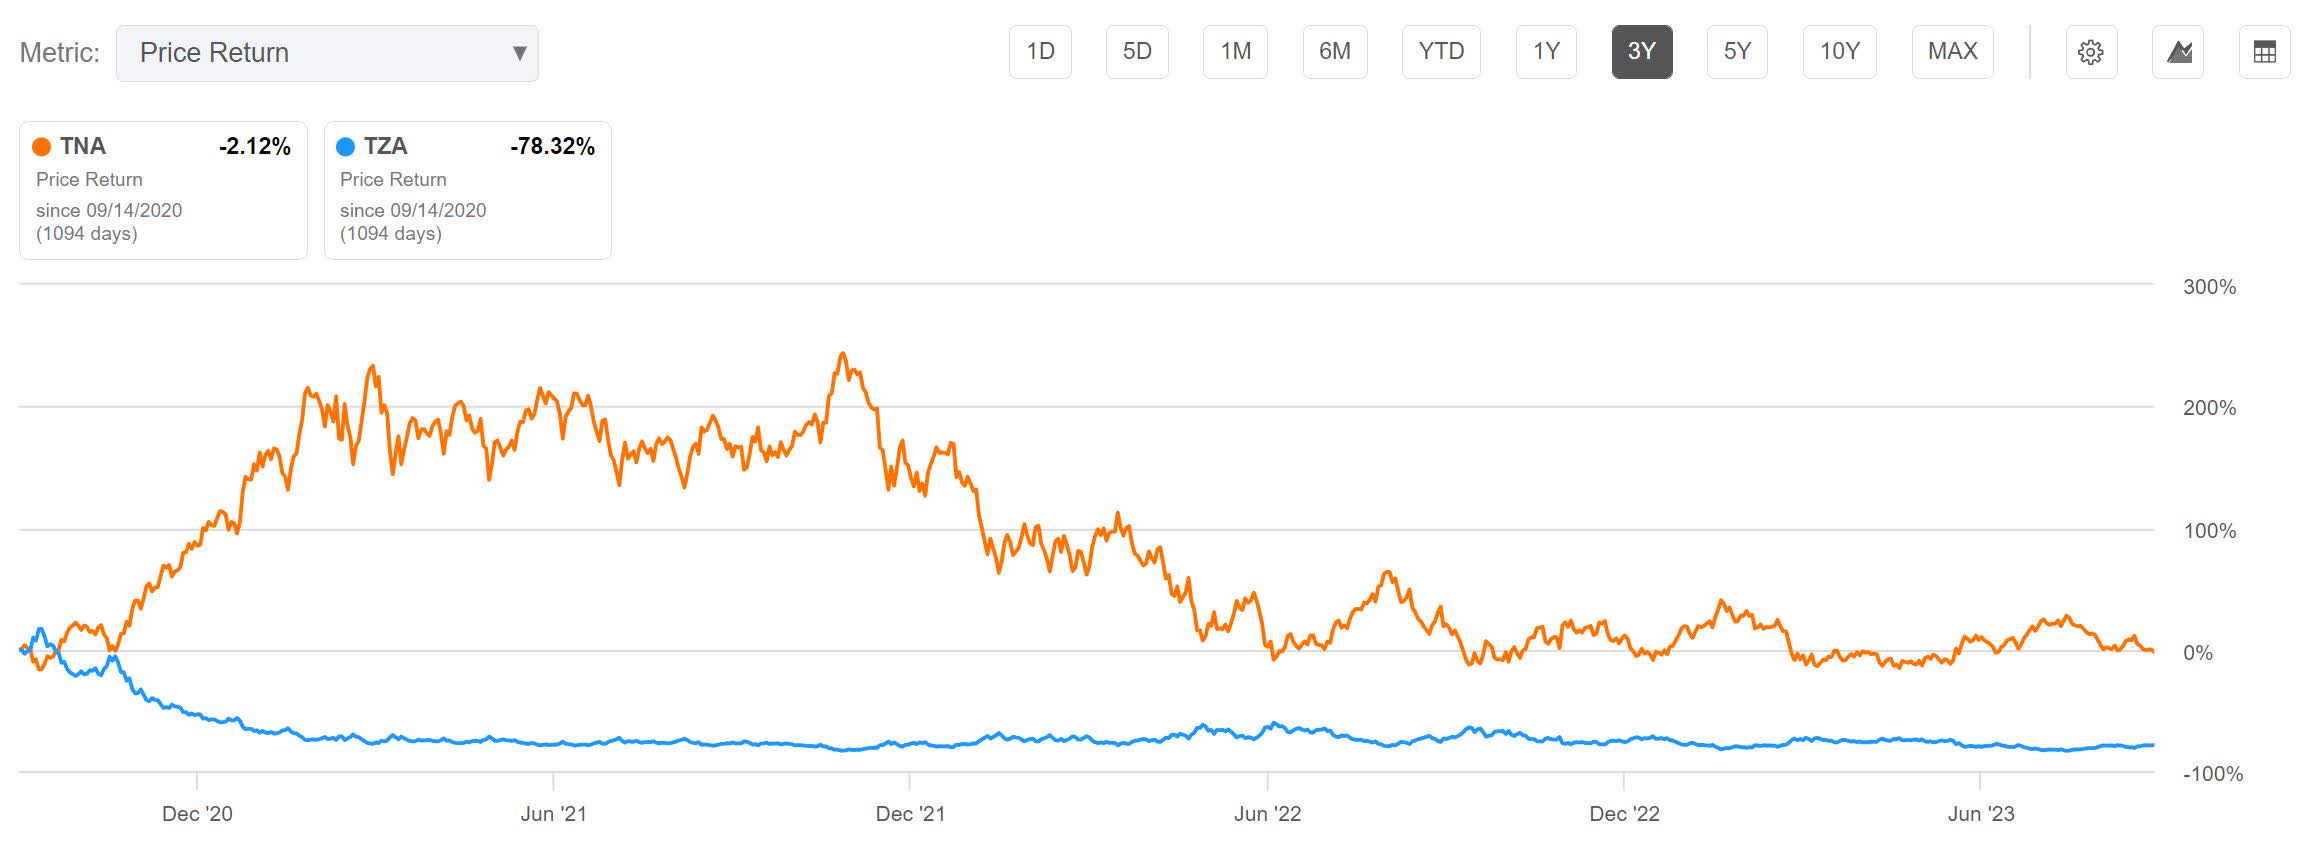
TNA vs. TZA 3-Year (Seeking Alpha)
Over the last 5 years, TNA is down by 65.54% and TZA is down by 91.22%. The short couple would be up by 78.38%.
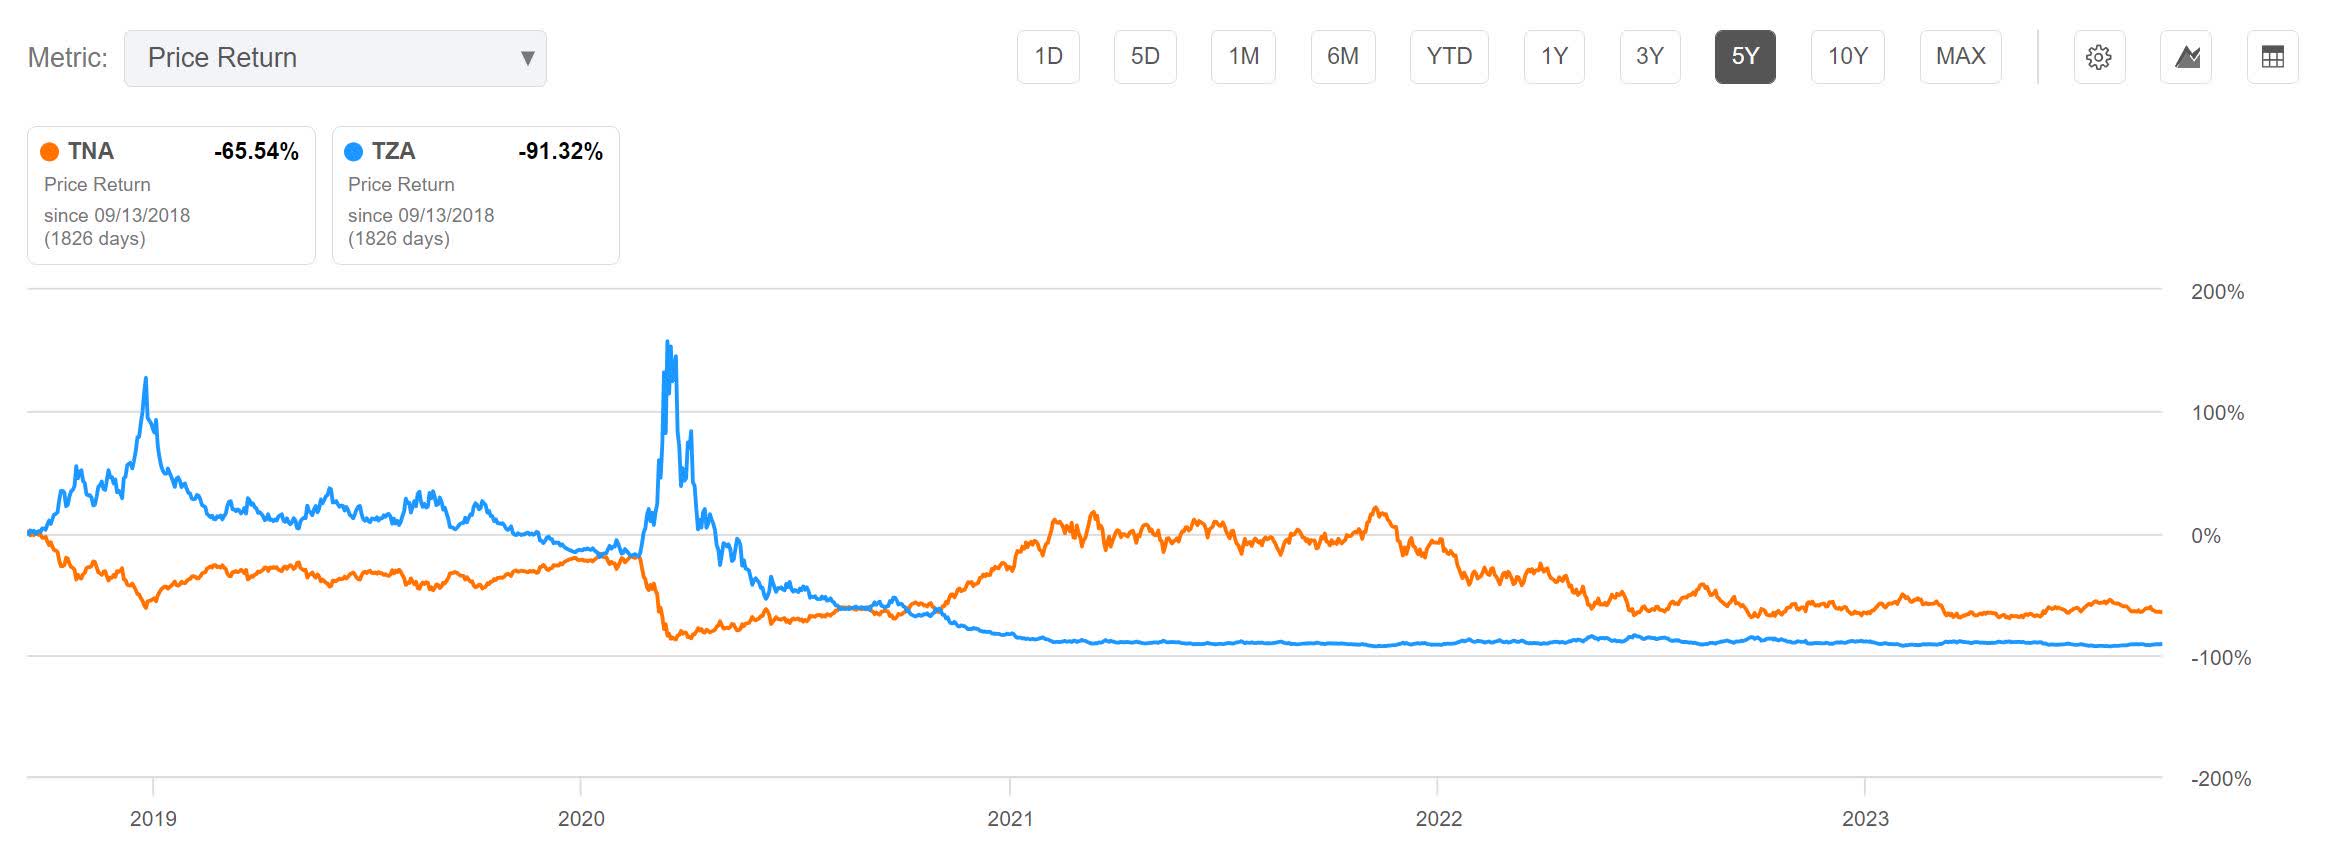
TNA vs. TZA 5-Year (Seeking Alpha)
Over the last 10 years, TNA is up by 2.45% and TZA is down by 99.23%. The short couple would be up by 48.39%.
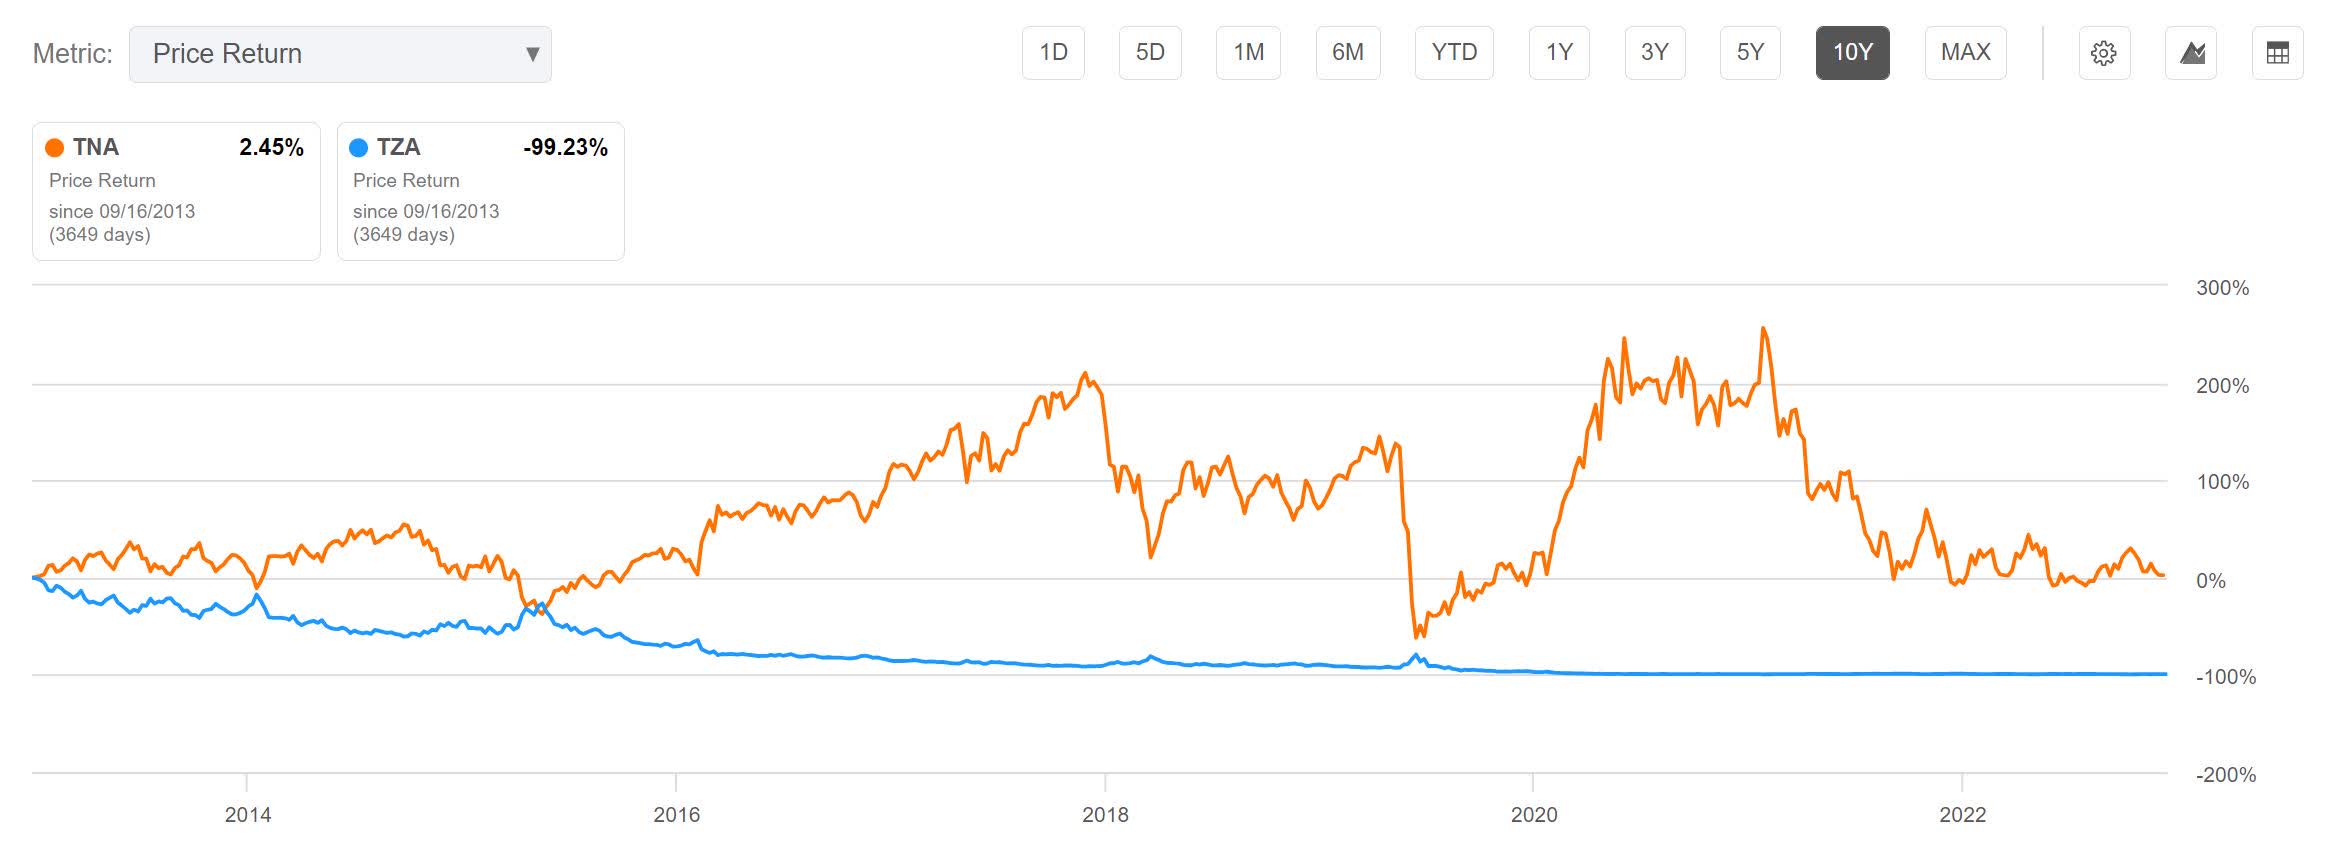
TNA vs. TZA 10-Year (Seeking Alpha)
Borrowing Fees
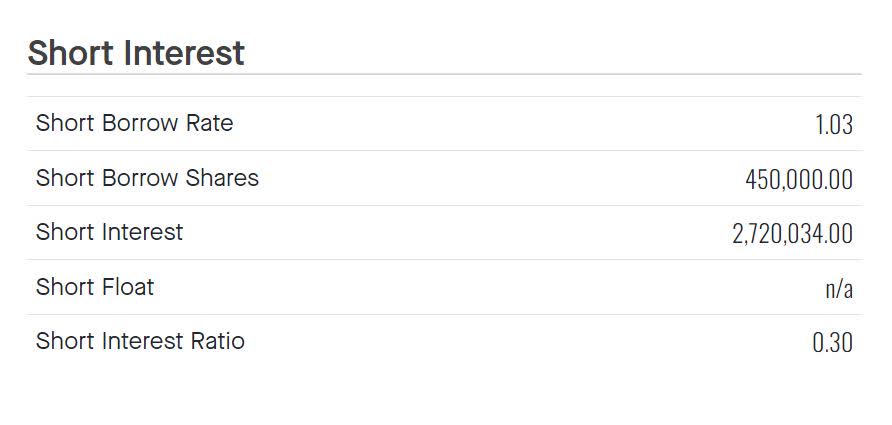
Because this strategy has us shorting both funds, we must consider their annual cost to borrow fees. These values vary over time. TZA currently has a Short Borrow Rate of 1.03%.
TZA Short Borrow Rate (Fintel.io)
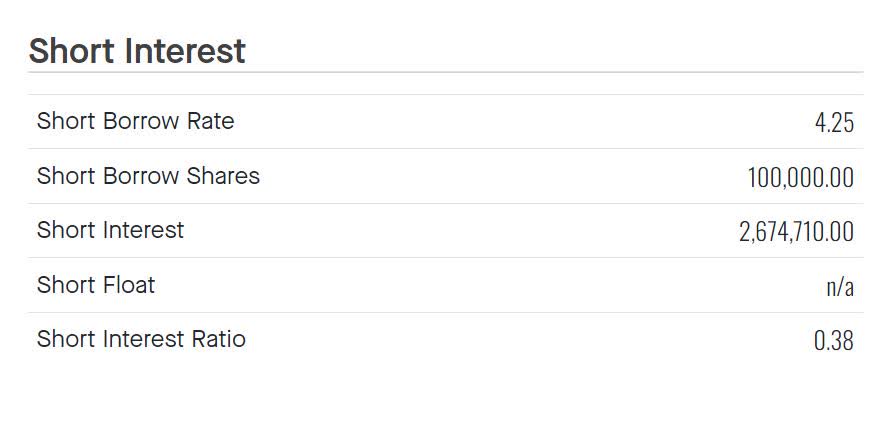
TNA currently has a Short Borrow Rate of 4.25%.
TNA Short Borrow Rate (Fintel.io)
Weighting
As I was expecting, my minimum variance calculator is telling me that the two positions should essentially be held at a 50/50 ratio to reach minimum variance. If one were to short TZA by $990.86 for every $1000 one was short TNA, then a variance of 0.002142 can be achieved.
TNA vs. TZA Minimum Variance Weightings (By Author)
Negative Yield
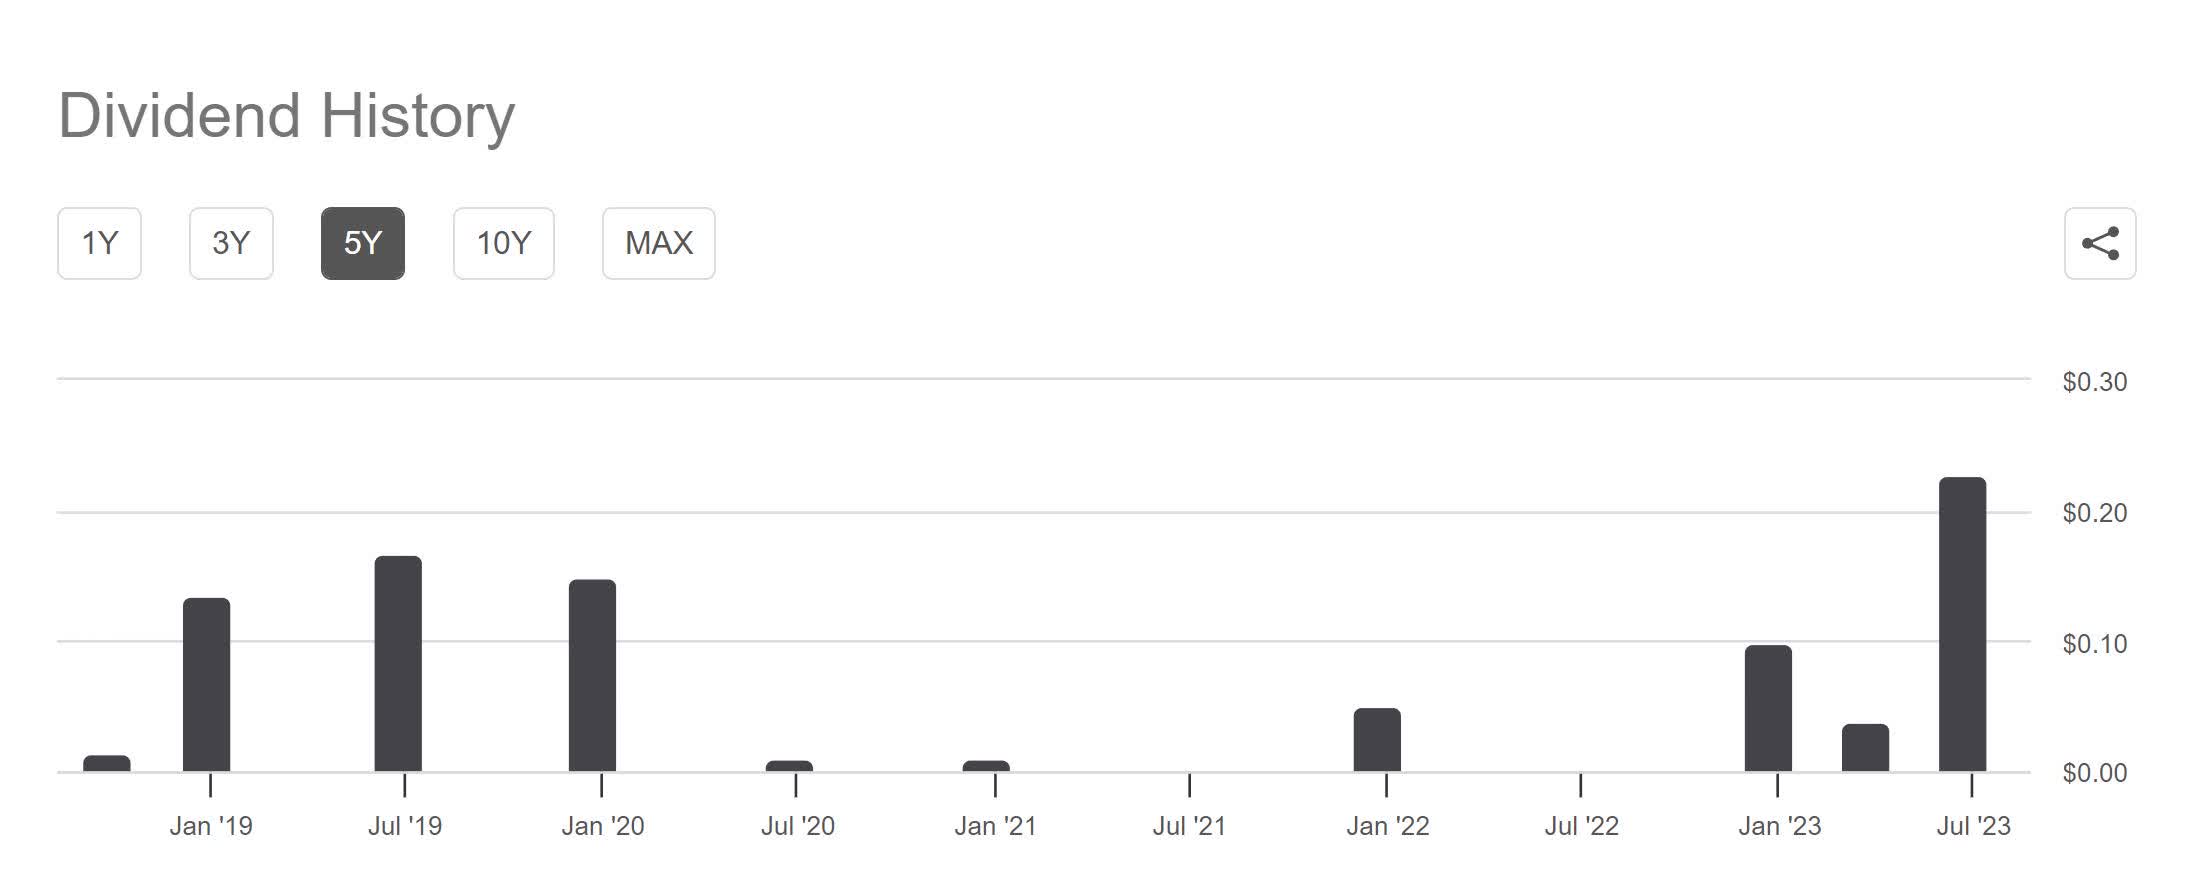
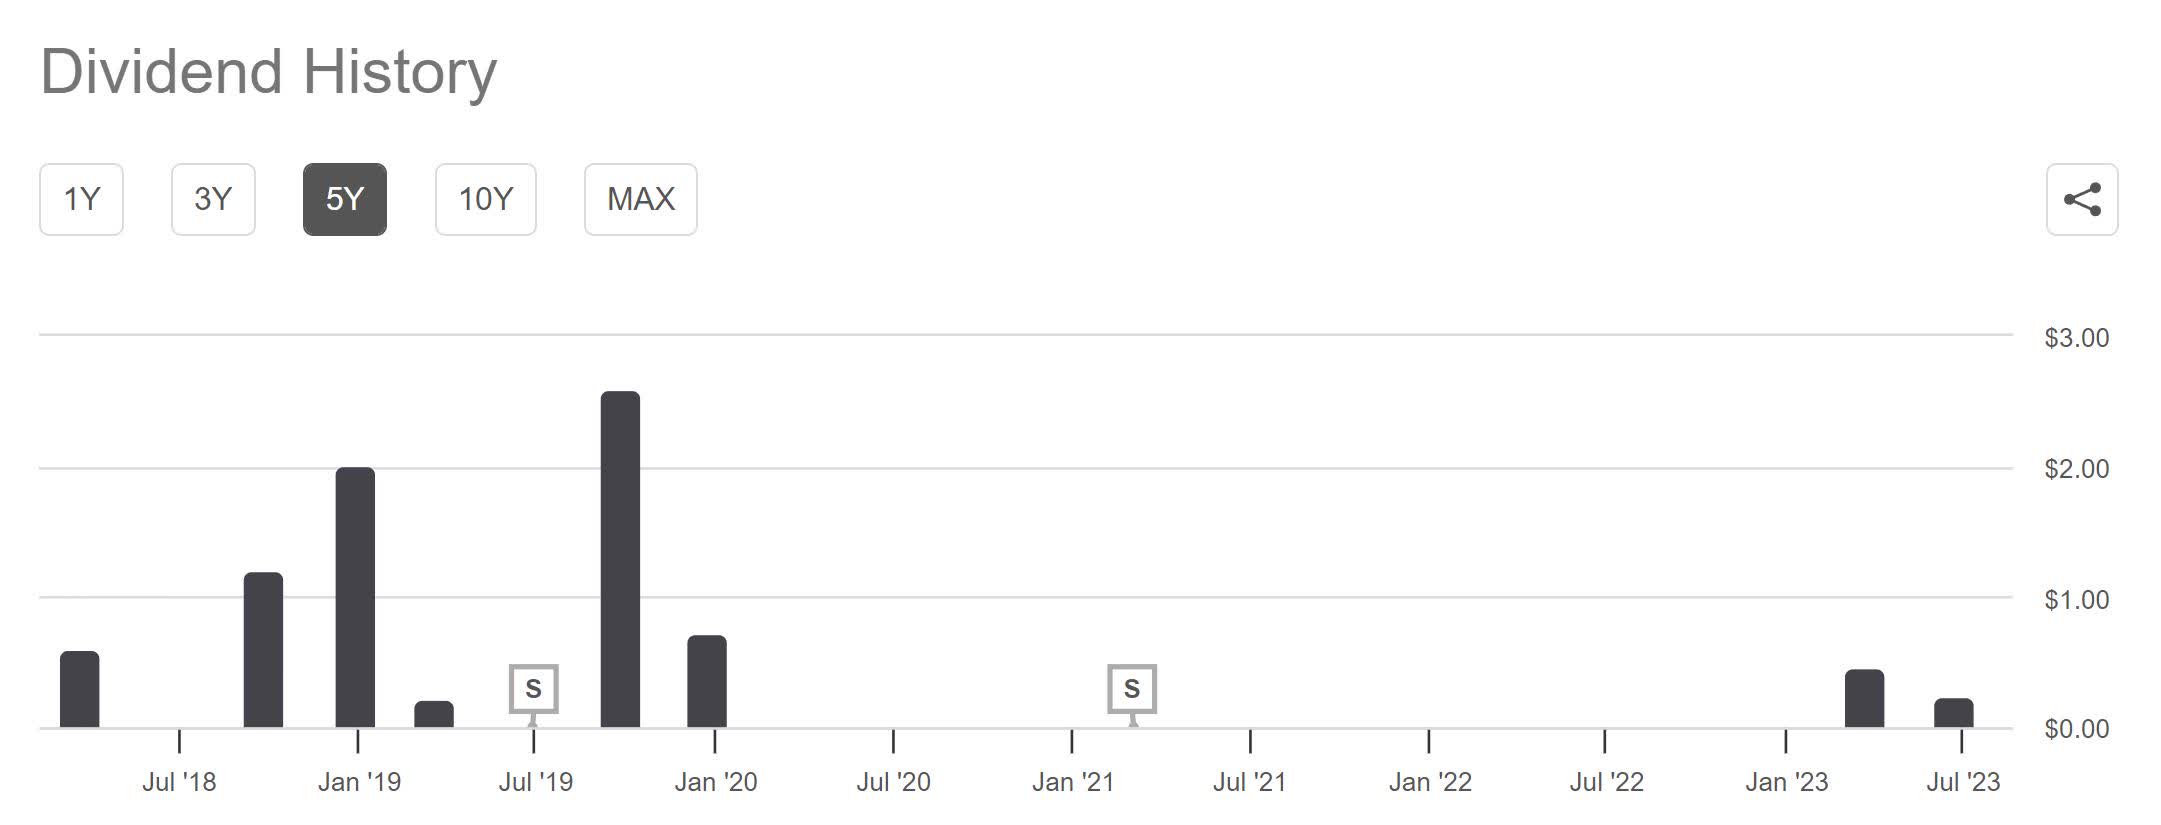
Both leveraged ETFs hand out distributions under certain circumstances. These values will change over time, but TNA is currently paying a yield of 1.14%, while TZA is paying 2.45%. Since this strategy has us shorting both positions, doing do requires paying out the dividend. Because the NAV of the both TNA and TZA will change by any distribution amount, the net effect of paying the dividend should be zero.
TNA Distribution History (Seeking Alpha)
TZA Distribution History (Seeking Alpha)
Expected Returns
I will speak to holding a lopsided couple later and am going to estimate returns assuming both positions are equally weighted. I am also going to assume the last year of movements in the price of the Russell 2000 have been within normal behavior. Looking back to the 1 year chart, the short couple is up by 18.675% over the last year. Their management fees and yield are already included in the price action, but borrowing fees are not. The short TNA position has experienced a 17.94% gain, but has had to pay 4.25% in borrowing fees. That side of the couple is looking at a 13.69% net gain.
The short TZA position has experienced a 19.41% gain but has had to pay 1.03% in borrowing fees. That side of the couple is looking at an 18.38% net gain.
With both positions weighted evenly, this produces an estimate for annual returns of 16.035% for the low volatility couple.
Risks
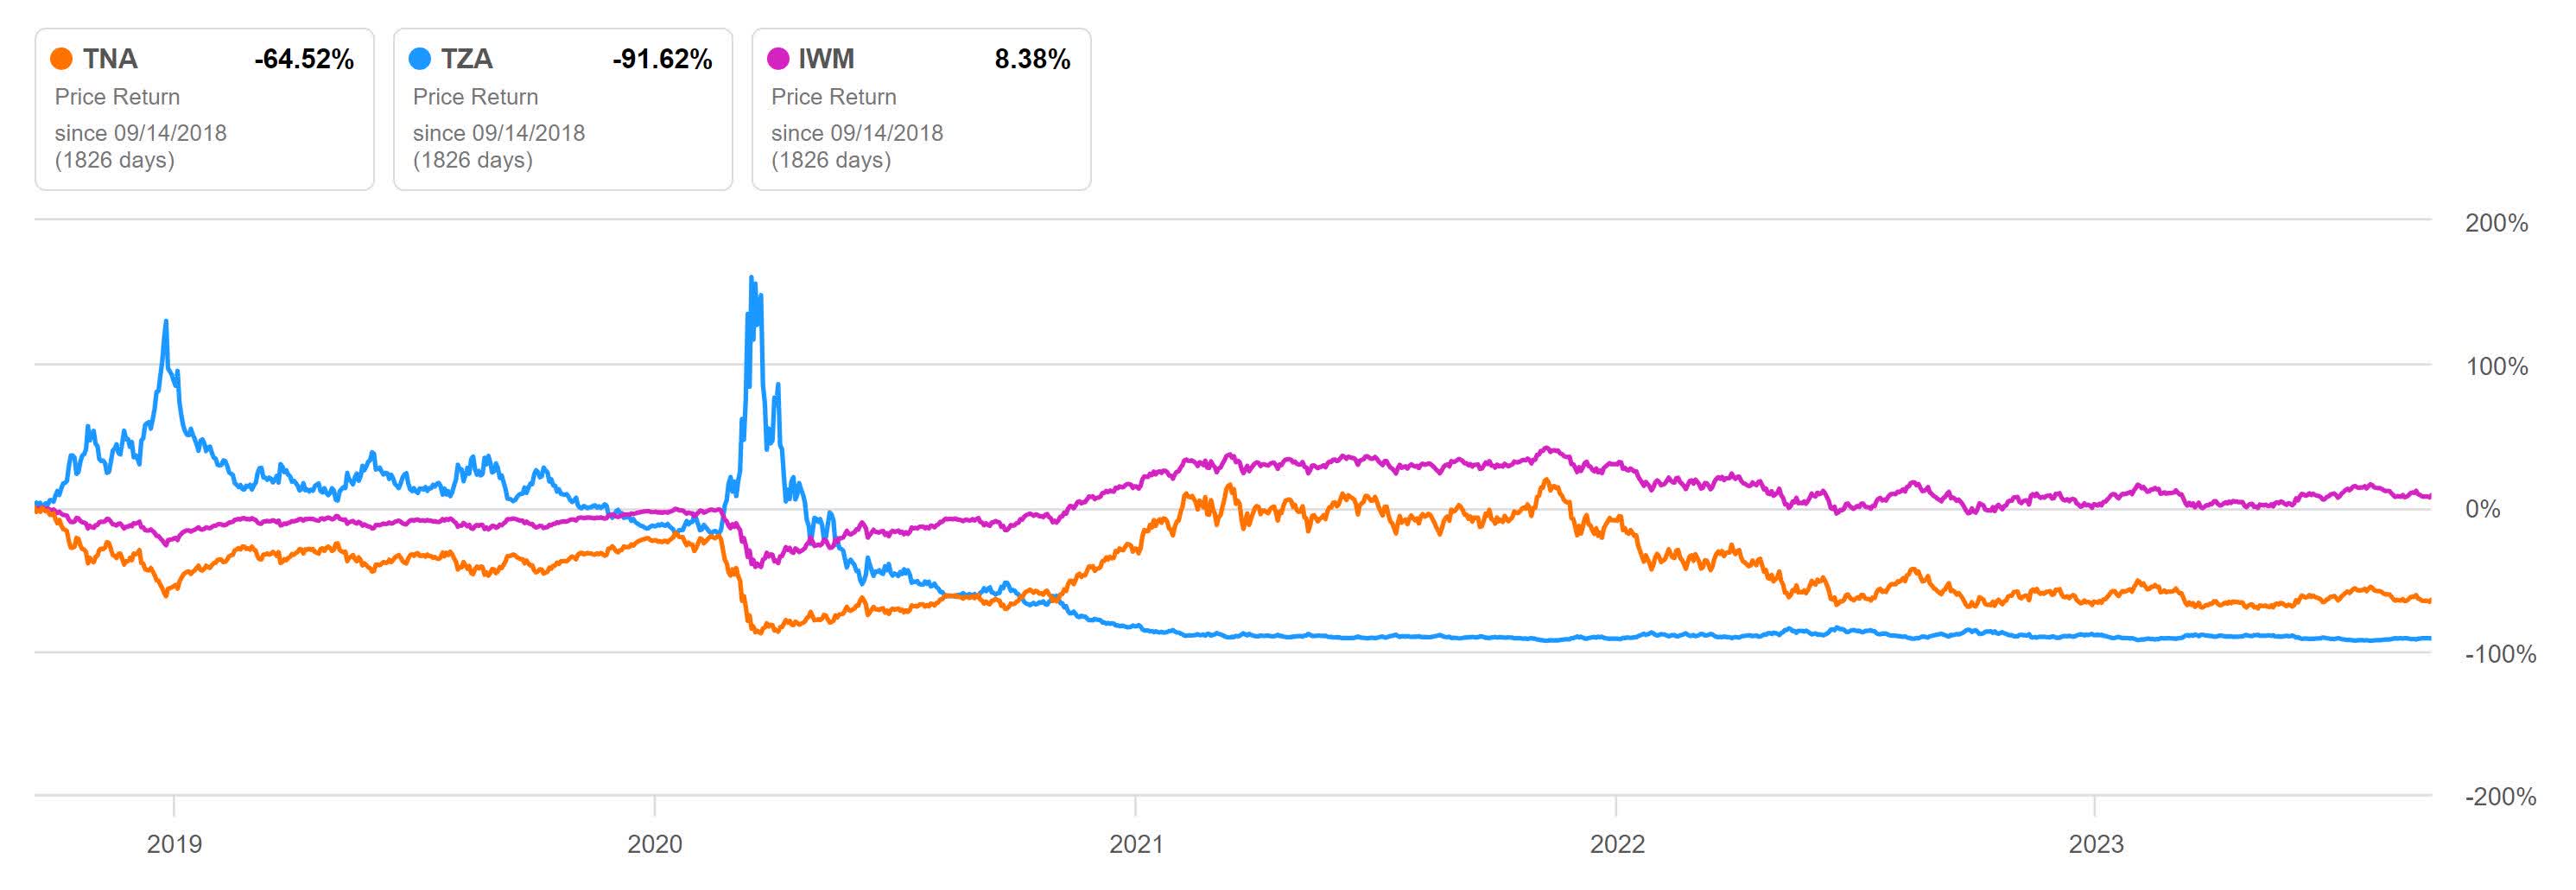
As with all leveraged pairs trades, any time the price of the underlying enters a strong trend with few reversions, the pairs trade could suffer losses. This can be seen on some of the longer timeframe charts above. Here I am using iShares Russell 2000 ETF ( IWM ) to reflect movements of the underlying index. During periods where IWM maintained a stong protracted trend, either TNA or TZA gained in value by magnitudes significantly larger than the other one lost. This means that the coupled short position should lose value anytime IWM maintains a strong enough trend.
TNA vs. TZA vs. IWM (Seeking Alpha)
Even though I believe the likelihood of it ever happening is quite low, it is possible that either ticker experiences a mechanical problem and falls out of sync with both the Russell 2000 and the other side of the couple.
The decay rate over the last years has been a result of the level of volatility of the price of the Russell 2000. If the underlying were to experience violent moves with more frequency in the future than it has over the last year, the performance may better the recent annual returns of about 16%. During periods when it experiences fewer violent moves, the two funds should erode more slowly, so expected returns should be lower.
While the borrowing fees are currently small, they will vary over time. As the costs increase, the couple becomes less appealing. While this is less of an issue if the borrowing rates lower quickly, if one were not diligent about checking them and borrowing rates were to stay elevated, the coupled position could lose value unexpectedly before being noticed.
Lopsided Positions
Intentionally overweighting either side of the position will lower variance, but allows one to take on a directional bias. By being short more heavily into TNA than TZA, one would gain benefit from IWM going down. By being short more heavily into TZA than TNA, one would gain benefit from IWM going up.
Also, note the long-term behavior of the couple on the 3, 5, and 10 year charts. It is clear that shorting TZA has been more attractive than shorting TNA. This is due to a large number of macro variables ranging from inflation to demographics, but the net result is that over longer timeframes indices with broad exposure such as the IWM are expected to continue rising. This means it's more advantageous from a long-term returns perspective to merely short TZA without using TNA to hedge it.
Since my goal here is to produce a low volatility couple, I will not consider shorting TZA alone, but I may consider intentionally misaligning the weighting to something like a 55/45 or 60/40 ratio. I personally want to emphasize attractive long-term net returns over achieving the absolute lowest variance or even the best risk adjusted returns. When I set up my portfolio, I will look at how changing the weightings affects the Sharpe ratio. I may let it tell me what to use for weightings, or I may chose to ignore it.
Conclusions
I believe this is an attractive low volatility couple. When I first began researching margin portfolios a few months ago, I was planning on focusing entirely on generating cash flow from covered call ETFs and then finding ways to mitigate their NAV erosion. However, the more of these double-short triple-leveraged couples I review, the more I believe the most attractive short pairs will end up in my final portfolio. I feel that I am still 2 or 3 months away from running low on high quality targets to research before I will design a rough draft of the portfolio and move on to paper trading it for a while to get used to its mechanics. I plan on designing something I would be comfortable using with significant amounts of margin, and then adding safety factor by dialing back how much margin I am using while maintaining a larger cushion of cash than is statistically necessary.
For further details see:
TNA And TZA: Shorting Both Produces An Attractive Pairs Trade