ROUS - To Be Value Or To Be Growth? That Is The Question
Summary
- 2022 was a year where, suddenly, the value style of investing dramatically outperformed the growth style.
- Sector exposure is a detail useful to help in characterizing different index exposures.
- The S&P 500 Growth Index added Energy sector exposure due to strong price momentum over the prior 12 months, as well as good growth in earnings.
By Christopher Gannatti, CFA
WisdomTree began launching ETFs and Indexes in 2006. For much of this period, the growth style of investing, epitomized initially by “tech stocks” and more recently by such acronyms as “FAANG” (Facebook, Amazon, Apple, Netflix, Google), drove market benchmarks seemingly ever higher.
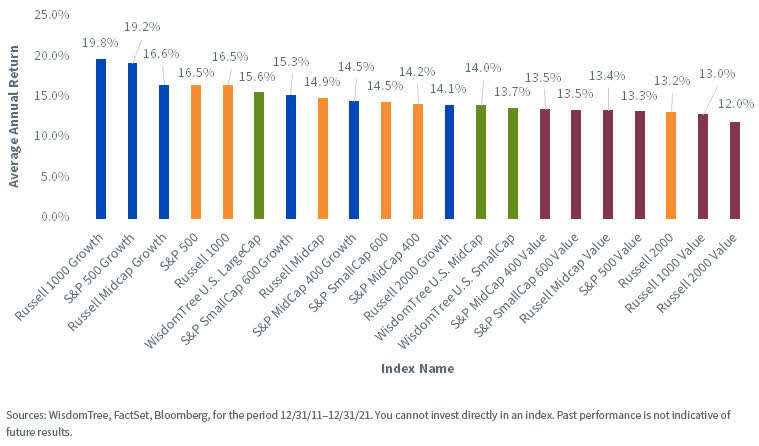
Over the period of 10 years ending December 31, 2021, we show in figure 1:
- Blue bars represent the “growth” style of investing. The Russell 1000 Growth and S&P 500 Growth Indexes outperformed the other mid- and small-cap growth indexes. In other words, “large-cap growth” outperformed mid-cap and small-cap growth over this period.
- Orange bars represent the “core” benchmarks—those that include both value-oriented and growth-oriented companies. Large caps outperformed mid-caps and small caps in this grouping as well.
- Green bars represent WisdomTree’s earnings-weighted Indexes. The WisdomTree U.S. LargeCap Index outperformed the WisdomTree U.S. MidCap and SmallCap Indexes .
- Red bars represent value-oriented strategies. These strategies lagged over this period, but we’d note that the Russell 2000 Value Index—the worst-performing Index in figure 1—still had an average annual return of 12.0%. This is still quite a strong average annual return for a 10-year period.
Figure 1: Average Annual Returns of Specified Indexes over 10 Years
For definitions of terms/indexes in the chart above please visit the glossary .
2022: The Growth Style Swaps Performance Leadership with the Value Style
When longstanding trends simply continue, it tends to lull investors into a sense that markets are not dynamic and do not tend toward change. However, we hear all the time that “past performance is not indicative of future results,” so shifts in trends are good to remind us that almost nothing in markets should be viewed as a constant.
2022 was a year where, suddenly, the value style of investing dramatically outperformed the growth style. We see in figure 2:
- Remember those blue bars—the growth-oriented indexes? They are now all the way to the right-hand side, indicating the worst performance in the group over the period. Additionally, the Russell 1000 Growth and S&P 500 Growth Indexes—those focused on large caps—were the two worst-performing indexes in figure 2.
- Remember those red bars—the value-oriented indexes? They are now all the way to the left side of the figure, indicating the best performance in figure 2 over the period.
- The green bars, representing the WisdomTree earnings strategies, remained in the middle of the figure, as did the orange bars representing the core strategies.
- Importantly, every bar in figure 2 represented a negative return, telling us it was a particularly tough year.
Figure 2: Cumulative Return of Specified Indexes over 2022 Full-Year Period
Are Earnings Strategies “Value” or “Growth” Oriented?
It’s clear that “earnings” represents something different than the value or growth styles, as there is a difference between a single fundamental—like earnings—and a style of investment or a benchmark, such as growth or value, that can be defined in multiple different ways.
Based on figures 1 and 2, earnings is located somewhere between the growth and value styles and tilted a little bit more toward value than growth.
Sector exposure is another detail useful to help in characterizing different index exposures. Some sectors are associated with value, whereas others have more of an orientation to growth.
Throwing a Wrench into Index Sector Exposure Analysis: The S&P 2022 Rebalance
My colleague Jeremy Schwartz wrote about a surprising rebalance season for the S&P in December 2022 . The S&P’s growth criteria includes a sensitivity to 12-month price momentum and led to rather interesting circumstances for the Energy and Technology sectors.
- Energy performed very, very well in 2022—much better than other sectors, especially in U.S. large caps.
- The S&P 500 Growth Index Energy weight as of August 31, 2022, was only 1.2%. Exposure to Energy at the end of January 2023 was 8.2%, a full 7% higher due to the rebalance. The Energy sector still had the lowest price-to-earnings (P/E) ratio out of all S&P 500 Index sectors as of this time—usually something one would associate more with value than with growth.
- The S&P 500 Value Index had an 8.0% exposure to Energy in August 2022. As of the end of January 2023, this figure had changed to 1.7%–6.3% lower due to the S&P’s rebalance. The Index oriented toward the value-style of investing took the lowest P/E sector and REDUCED exposure, a direct counter to our intuition.
For further details see:
To Be Value Or To Be Growth? That Is The Question