ADTTF - Tokyo Electron: Underfollowed EUV Niche Market Leader
Summary
- Tokyo Electron is a semiconductor equipment manufacturer and the market leader in the EUV Coater/Developer space with a 100% market share.
- As a Japanese company, it is rather underfollowed.
- The balance sheet is arguably the strongest in the industry.
- My DCF-Valuation indicated Tokyo Electron being fairly valued, and long-term return potential should be around 13%.
Introduction
In this article, I want to share my thoughts on a semiconductor equipment company that isn't followed as much as the bigger US peers, which is Tokyo Electron Limited ([[TOELF]]/[[TOELY]]). This will be my second article on a Japanese company after my initial article on Shimano , the world leader in bicycle components.
I think Japanese companies offer a great opportunity at the moment because of the still prevailing currency weakness of the Japanese YEN compared to the USD and the EUR, as can be seen in the chart below.
I have to add that when you are looking at the reported earnings of Japanese companies it is crucial to factor out currency effects because if you don't, the possible currency tailwinds of a stronger YEN or a weaker USD/EUR will be negated from the currency headwinds in the reported earnings.
As for the structure of this article, I will do things a bit differently. I will start by going over the financials before the analysis of the underlying business and finish up with a section on valuation, risks, and a conclusion.
Financials
To start off I want to compare some metrics to Tokyo Electron peers. As a peer group, I chose US semiconductor equipment companies KLA Corp ( KLAC ), Applied Materials ( AMAT ), Lam Research ( LRCX ), and EUV market leader ASML Holding ( ASML ) from the Netherlands. Let's start by looking at the total returns over the past decade:
As we can see Tokyo Electron marks the bottom of the pack on a USD basis. We need to keep in mind however that as the chart above regarding the Japanese YEN tells us, the YEN depreciated from something like 90 YEN per USD to now 128 YEN per USD over the past decade. This means that on a local currency basis, the total return should be closer to 1,365% (960*(128/90)). The same is true for ASML and the EUR. The EUR depreciated from around 0.75 EUR per USD to the current 0.94 EUR per USD, so ASML's total return is probably somewhere around 1,260% on a local currency basis.
In the next chart we can see the EBIT margins for the companies over the past decade:
EBIT margins were basically pretty similar over the past decade with only KLAC being a bit of an outlier to the positive side.
To end this little peer group comparison I want to take a look at the metric that is most important in my opinion, the return on capital employed (ROCE):
We can basically see that ROCE has also been quite similar for the whole group, but there is one big piece of information missing in my opinion, the net debt/net cash position (see chart below).
Ycharts seems to have a different definition of ROCE than I have. In my opinion, we need to deduct net cash from the capital employed if there is any. My reasoning is quite simple: If a company has net debt, the debt was used to finance existing and accounted assets. If it has net cash, it could pay out all of that net cash to shareholders and still be on a zero debt level. The net cash position that adds to the total assets is not actually employed capital to run the business, so it shouldn't be counted as such for the calculation of ROCE in my opinion.
We can see that Tokyo Electron has by far the biggest net cash position on the balance sheet (which is not unusual for Japanese companies, just take a look at the Shimano article I linked in the beginning) and it has a history of doing so throughout the whole past decade. If I calculate the ROCE the way I described and deduct the net cash from the capital employed I get the following numbers:
| FY |
| 2016 |
| 2017 |
| 2018 |
| 2019 |
| 2020 |
| 2021 |
| 2022 |
| TTM |
| ROCE |
| 30% |
| 39% |
| 61% |
| 55% |
| 42% |
| 40% |
| 56% |
| 71% |
These numbers are about 50% higher than peers which is a very good sign in my opinion and could also be a reason why Tokyo Electron outperformed the peer group on a local currency level.
Now I want to dig a bit deeper into the actual performance over the past few years. As I already outlined above that Tokyo Electron operates with a big net cash position of currently ¥484.69 billion (which covers close to 7% of the current market capitalization), so I won't add any more comments on the balance sheet. It is very strong and gives some downside protection.
First I want to give an overview of the most important earnings metrics over the past few years:
Earnings metrics overview (Company Annual/Quarterly Reports)
Tokyo Electron's fiscal year ends at the end of March so the FY2022 numbers are for the fiscal year ended March 2022. From FY2016 revenue grew with a CAGR of 20.2% and free cash flow with a CAGR of 24.9%. Now we are obviously seeing a big spike in earnings after the pandemic and with the current condition of the global semiconductor market (global semiconductor sales were down 3% for Q3 2022 and November 2022 ), this looks like an extreme outlier.
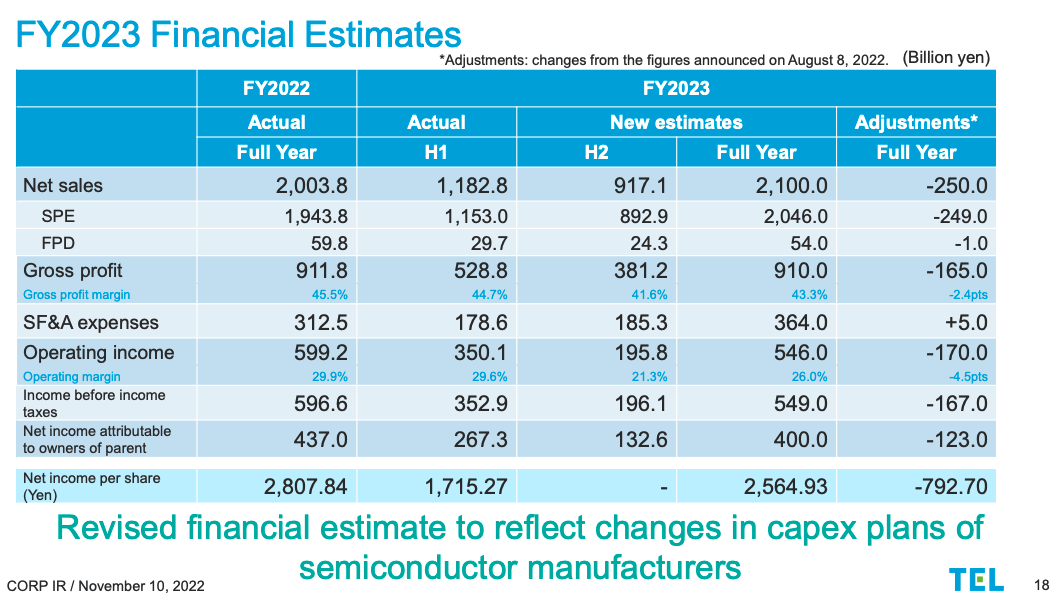
Tokyo Electron's management adjusted guidance accordingly in the 2nd quarter FY 2023 earnings release (see slide from the presentation below).
Tokyo Electron now expects sales growth of around 5% for the fiscal year (from ¥2 trillion to ¥2.1 trillion) and a decline in net income attributable to shareholders of around 9% (from ¥437 billion to ¥400 billion). The reason, according to Tokyo Electron, are changes in the capex plans of semiconductor manufacturers.
Guidance for the second half of FY2023 seems really weak compared to the actual results of the first half. The question is how we should think about FY2024, which starts in April 2023 and ends in March 2024. In the Q&A for the 2nd quarter FY 2023 earnings release, an analyst asked exactly that question:
From the second half of FY2023 to the first half of FY2024, when do you expect that sales in the SPE*2 business will stop trending downward? SPE manufacturers are likely to begin delivering their equipment in CY2024 to fabs of semiconductor manufacturers receiving subsidies under the CHIPS and Science Act, so is it fair to assume that your sales will begin recovering by around FY2024 Q4?
Author Note: SPE = Semiconductor Production Equipment
And here is the answer from the management:
For now, we would like to refrain from commenting on when we can expect sales to stop decreasing or to recover. At this time, we have revised our financial estimates downward to reflect recent delays in investments by memory customers and the impact of tightened US restrictions against China. These effects will need to be closely monitored going forward. On the other hand, the industry organization SEMI has announced that construction of 67 new fabs and lines is expected to start between CY2022 to CY2025, and TEL is setting our sights on future growth opportunities offered by the further digitalization of society. We expect that memory-oriented investments, which have been slowing down recently, will begin to recover gradually starting in the second half of CY2023, and that CY2024 will be a big year. We need to be ready to take advantage of this opportunity.
Source: Company provided Q&A translation
While they say that they won't comment on when sales weakness will stop, they say that recovery will begin in the second half of CY2023 (which would be FY2024 Q2/Q3) and that CY2024 will be a big year.
So in conclusion I think earnings for the first half of FY2024 (April to September 2023) will still be under pressure. The FY2023 ending earnings release which is planned to be in early May 2023 will be important to see what kind of guidance the company will give for FY2024.
Business Overview
Tokyo Electron reports in two segments: Semiconductor Production Equipment ((SPE)) and FPD (Flat Panel Display) Production Equipment. I won't cover the FPD Production Equipment segment because it only accounts for 3% of sales (FY2022). I will focus on the SPE segment.
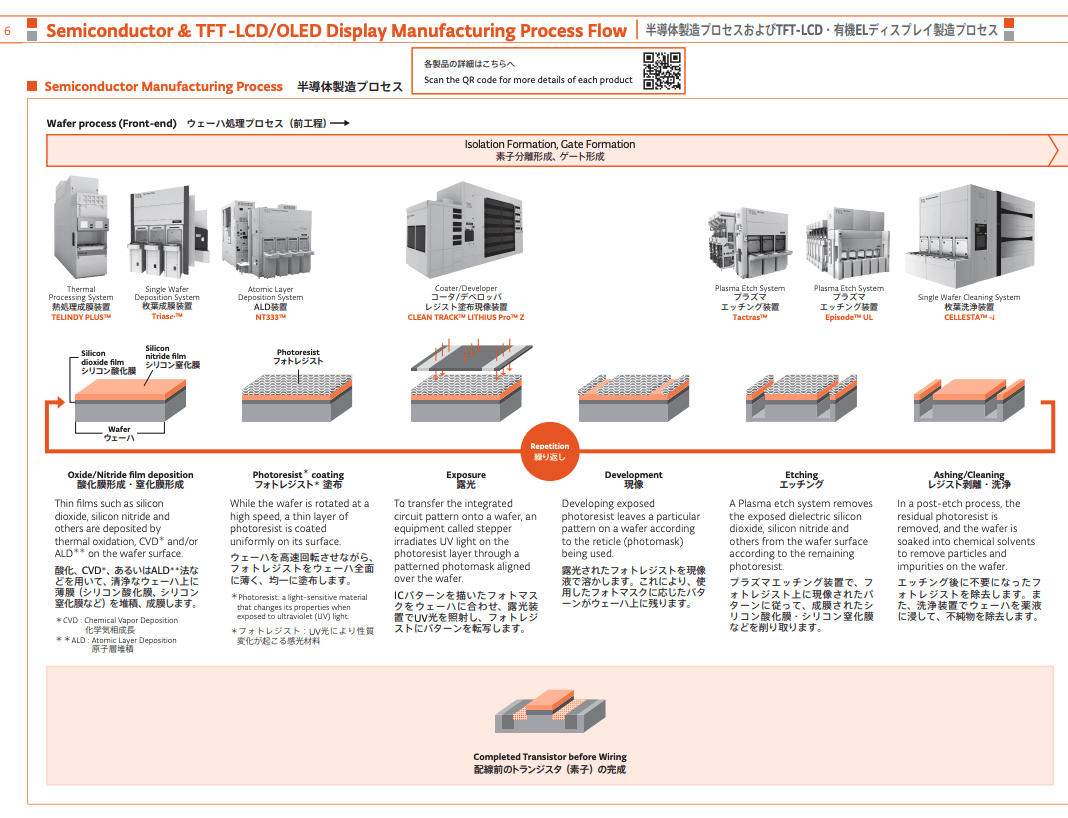
I want to start with an overview of the parts of the manufacturing process Tokyo Electron covers with its products:
Semiconductor Manufacturing Process (Tokyo Electron IR - Fact Book 2022)
The main processes Tokyo Electron operates in are Deposition, Coater/Developer, Etch and Cleaning. Deposition is the process of depositing thin films of conducting, isolating or semiconducting materials on the wafer to enable the first layer to be printed on it. The wafer is then covered with a light-sensitive coating called "photoresist" (Coating). The next step is to remove the degraded resist to reveal the intended pattern. During 'etch', the wafer is baked and developed, and some of the resist is washed away to reveal a 3D pattern of open channels. The cleaning process prevents contamination and assures very clean wafer surfaces, a critical step in the manufacturing process.
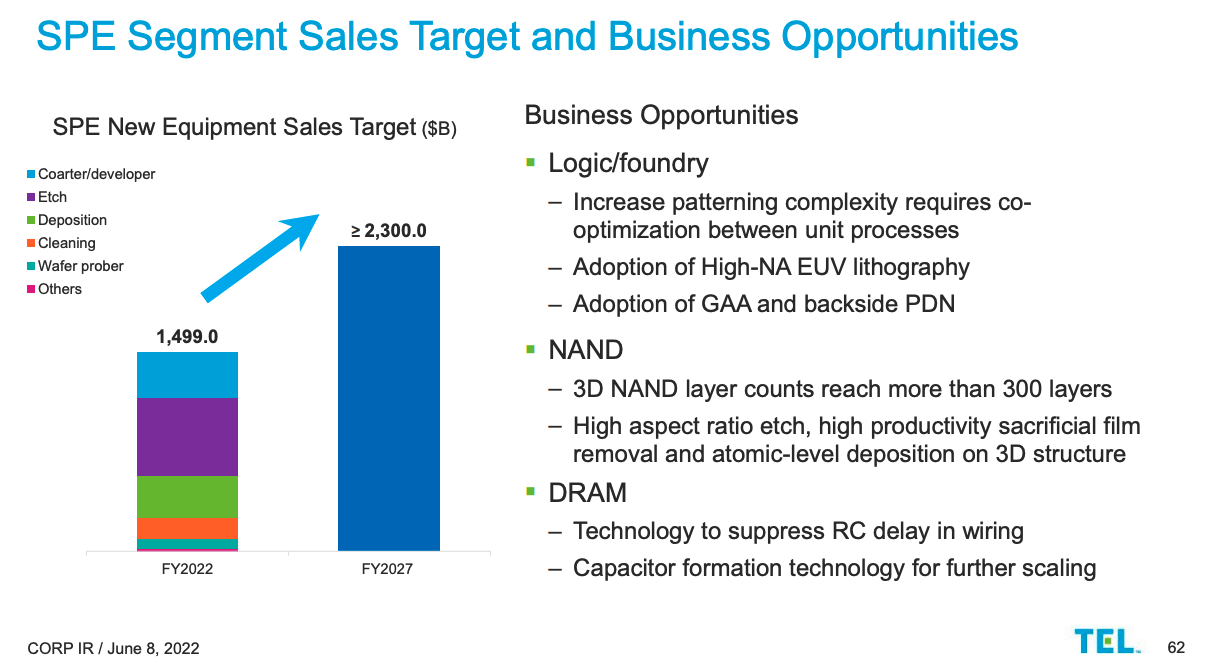
Now there is one problem with Tokyo Electron which is that they don't report sales for the different product types, but only SPE sales as a whole. As I went through several earnings presentations and management plans, here is the only slide I could find giving at least a hint on how sales spread across the different product categories:
SPE Segment Sales (Tokyo Electron Medium-term Management Plan - slide 62)
FY2022 total sales were ¥2,003 billion. The shown ¥1,499 billion should give a rough estimate as to how the sales spread across the products. It seems like around 40% are Etch, 20% are Coater/Developer, another 20% Deposition and the rest mainly Cleaning and others.
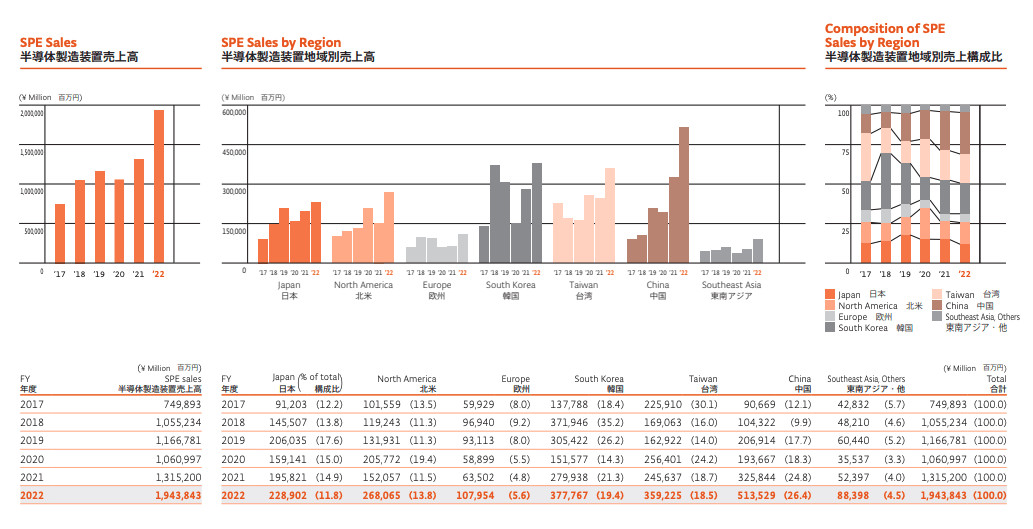
Sales by region
Next, I want to take a look at the SPE sales per region:
Over the past few years, China developed to become Tokyo Electron's biggest market. Sales to South Korea and Taiwan, mainly Samsung ( SSNNF )( SSNLF ), SK Hynix and Taiwan Semiconductor ( TSM ), have been growing as well, but at a slower pace than China. Sales to Japan also grew quite well, while sales to North America and Europe peaked in FY2022. It remains to be seen how sales to North America and Europe develop over the next few years, especially against the background of the CHIPS act ((USA)) and the European Chips Act (Europe).
Now as for the development of sales to China, it will be interesting to see how their new 14th five-year plan will work out. China set a goal to progress towards self-sufficiency in some sectors like biotechnology and semiconductors. This may be a two-edged sword for Tokyo Electron. On the one hand, sales to China may increase in the short to medium term. On the other hand, this could pose a major headwind some years down the road if China should succeed in achieving self-sufficiency throughout the whole sector, including Semiconductor Production Equipment.
As for my personal opinion, China already invested billions of dollars to reduce reliance on importing high-end semiconductors in the past, without success. Some things just can't be fixed with money and lacking an innovative market environment is certainly one of those things. Why should any company invest in R&D in China, a nation with a bad reputation regarding IP theft ? Another problem is that while China has a huge population with many smart minds, they just can't attract international talent at the same rate as a country like the US. Just take a look at the top university ranking . The first Chinese universities placed 16th and 17th. I think China will act accordingly by their new 14th five-year plan and spend billions of dollars on domestic semiconductor manufacturing and this might be a tailwind for Tokyo Electron.
Market dynamics
The semiconductor equipment market is fast changing because it is highly innovative and the progression to smaller nodes requires the best equipment possible. For this reason, the risk of losing market share if a company falls behind the curve should not be underestimated. The fact that Tokyo Electron operates in many different areas (in contrast to other companies like KLAC which focuses on metrology equipment or Teradyne ( TER ) and Advantest ( ATEYY ) focusing on test equipment) can also be seen as a two-edged sword. On the plus side, in case Tokyo Electron falls behind the curve in one of its product lines, there are other product lines to make up for it. On the negative side, Tokyo Electron can't solidify a leading market position in one single area and achieve undisputed technological leadership there.
Or can it?
I want to highlight one thing that, in my opinion, leads me to trust Tokyo Electron to be able to be an innovative player in the foreseeable future. On 8th June 2021 Imec, a world-leading research and innovation center in nanoelectronics and digital technologies, announced a collaboration between Tokyo Electron and the imec-ASML joint high NA EUV research laboratory. Tokyo Electron's leading-edge Coater/Developer will be integrated inline with ASML's next-generation high NA EUV lithography system. This is a very good sign in my opinion because ASML, as the undisputed leader for next-generation EUV equipment, will only choose the best partners for their high-end products. Here is a picture from Tokyo Electron's 2nd quarter FY2023 earnings presentation, showing how this is supposed to look like:
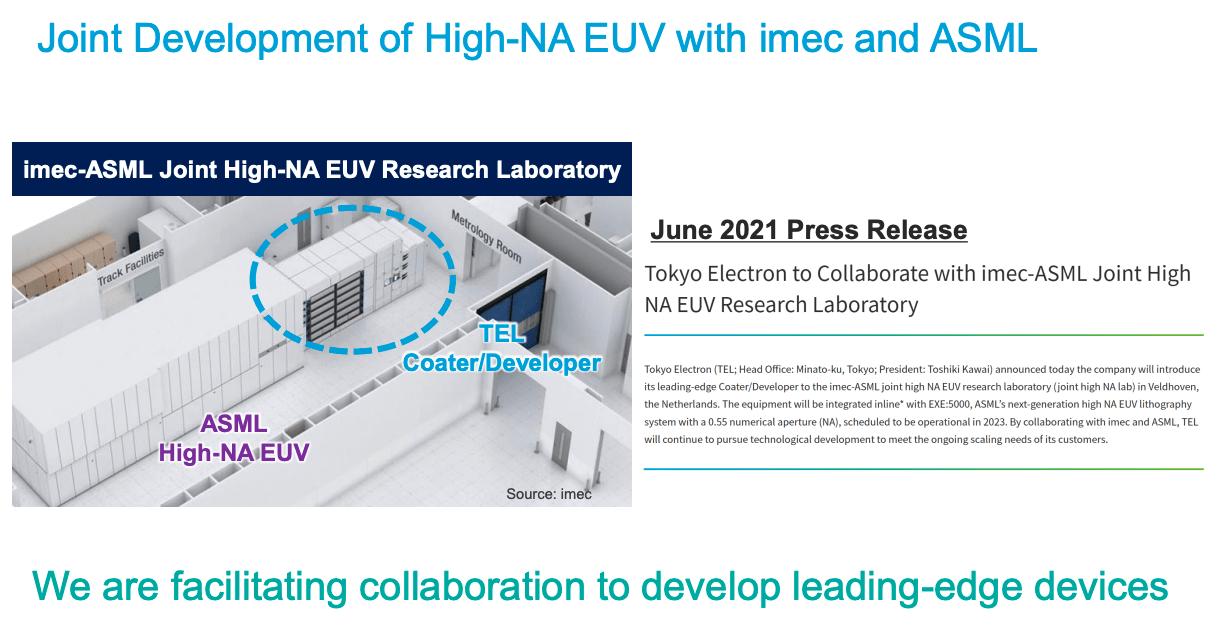
Tokyo Electrons Coater/Developer will be integrated into ASML's product. As ASML is the only company that is capable of developing this equipment, sales are pretty much already set in stone.
But why did ASML choose Tokyo Electron? According to this article , Tokyo Electron has captured the entire share of the market for mass-produced Coater/Developer tools applicable to EUV technology. This is something Tokyo Electron also highlighted themselves at the SEMICON West 2022 IR Meeting on 12th July 2022 (see slide 17).
To end this chapter, I believe that Tokyo Electron will be able to innovate and stay competitive in their respective product lines, as they have already shown in the past. My main reasons are the fact that they captured 100% of the EUV market share for Coater/Developer, the resulting collaboration with imec and ASML for the next-generation EUV devices and the fact that they have been operating with a high ROCE in the past, indicating a wide moat, excellent capital allocation and an innovative workforce.
Valuation
(Author Note: One share on the Tokyo Stock Exchange equals 4 ADR - TOELY )
As I am writing this, Tokyo Electron is trading for ¥46,380 per share ($89.49 per ADR). At the end of the 2nd quarter of FY2023, there were 156,037,640 shares outstanding for a total market capitalization of ¥7.237 trillion ($55.85 billion). After deducting the net cash position of ¥484.69 billion ($3.74 billion), we would have to pay ¥6.752 trillion ($52.11 billion) to buy the whole business. TTM net income stands at ¥504.2 billion for a PE of 13.4. TTM free cash flow stands at ¥268.4 billion for an FCF-Yield of 3.98%.
As I stated in the introduction it is important to account for foreign currency-related items in the financial statements. Luckily Tokyo Electron lists those separately in the comprehensive income and as an extra position on the cash flow statement, so we don't need to make any adjustments here.
Total long-term return potential should be the sum of the FCF-Yield (what the company can pay out to us on a yearly basis) and the earnings growth rate.
Let's start with the FCF-Yield. As I mentioned above, for the TTM basis the FCF-Yield stands at 3.98% at the moment. As I already stated earlier Tokyo Electron already cut guidance for FY2023 and now expects ¥400 billion of net income. My guess is that FY2024 will not be materially different because as I quoted earlier, management expects the second half of 2023 to be a tough year and 2024 a big year. To get a normalized estimate of FCF for FY2023 and FY2024 I will use the average cash conversion over the past few years. From FY2016 to FY2022, total net income amounted to ¥1.51 trillion and total free cash flow to ¥961 billion for a cash conversion of around 60%. This fits to Tokyo Electron's dividend policy of paying out exactly 50% of net income to shareholders. By applying this to the FY2023 guidance would result in a normalized FCF of ¥240 billion (60%x¥400 billion). So the normalized FCF-Yield, based on the FY2023 net income guidance, should be around 3.55%.
The earnings growth rate is highly dependent on the reinvestment rate and the ROCE. As cash conversion should be around 60% on average, the remaining 40% should roughly be the reinvestment rate (maybe a bit lower when some more cash is retained to further strengthen the balance sheet). The average ROCE over the past few years was around 46%. In conclusion, if the reinvestment rate was around 40%, the capital employed should have grown with close to 40%x46%=18.4%.
Here are the numbers (in ¥ billion):
| FY |
| 2016 |
| 2017 |
| 2018 |
| 2019 |
| 2020 |
| 2021 |
| 2022 |
| CAGR |
| Capital Employed |
| 236 |
| 315 |
| 374 |
| 392 |
| 338 |
| 311 |
| 371 |
| 18.0% |
Source: Author calculation off of company reports
Now the question is: Can Tokyo Electron keep growing capital employed at 18% CAGR while keeping ROCE steady? Tokyo Electron set itself the target to reach a Return on Equity (ROE) of above 30% by FY2027. That number would be in line with the FY2022 ROE of 32%, indicating that the company might be able to keep the rates of return steady. Different sources expect the Semiconductor Manufacturing Equipment market to grow with a 7.69% to 9.3% CAGR from 2022 to 2030. As the 50% dividend payout policy is pretty much set in stone, I am pretty confident that Tokyo Electron will keep reinvesting around 40% into the business. Even if I assume that ROCE is cut in half, I am still left with around a 10% growth rate. This is slightly above the market growth forecast which seems reasonable in my opinion. I actually think the 10% long-term growth expectation is rather conservative.
So in conclusion, the total long-term return potential should be around 13.55% (10% growth rate + 3.55% FCF-Yield). Keep in mind that this assumes no changes in valuation. To assess the possible effects of multiple compression or expansion, I will do a supplemental DCF valuation.
DCF Valuation
I will base the calculation on the 3.55% FCF-Yield on the current share price of ¥46,380 per share ($89.49 per ADR). That would be ¥1,647 per share. I will assume a 10% growth rate over the next decade and a 5% terminal growth rate because the high ROCE indicates a wide moat. Here is the result with a discount rate of 10%:
DCF-Valuation (moneychimp.com)
The DCF valuation indicates a value of ¥51,057 per share ($98.50 per ADR). Keep in mind however that I think earnings will be flat from FY2023 to FY2024 so we should discount this a bit further. Assuming another 10% discount due to possible no growth for one year would result in Tokyo Electron being fairly valued right now.
Risks
In my opinion, there are two main risks regarding an investment in Tokyo Electron:
(1) As I already mentioned the SPE market is a highly innovative one. The probability of a market participant falling behind the curve technology-wise and not being able to recover are higher than in other markets. Now one might say that this is a general risk throughout the whole market. While I think that this is basically true, I think that this risk is much higher for Tokyo Electron than for peers because Tokyo Electron has only one real market-leading niche which is the EUV Coater/Developer 100% market share. The Coater/Developer segment makes up only 20% of sales though. As for peers, most of them are highly specialized in a specific area, for example KLAC for metrology, ASML for EUV and Teradyne/Advantest for testing. The moat of these companies is simply much higher because they are much more specialized and have less competition.
(2) The export restrictions for Semiconductor Manufacturing Equipment to China could be a headwind to Tokyo Electron's business. The last Q&A session for the second quarter FY23 earnings call already covered some questions regarding this. Management stated that about half of the revised guidance was due to these restrictions and the other half mainly due to adjustments in the memory market. It remains to be seen how these sanctions will play out for the market as a whole. This is something that an investor has to watch out for in the future, especially any comment from management regarding this topic.
Conclusion
Tokyo Electron is an underfollowed semiconductor equipment company. It has a great track record of earning high ROCE and one of the best balance sheets in the industry. While I think the semiconductor equipment market is fast changing, I think Tokyo Electron will be able to stay ahead of the curve. Tokyo Electron has 100% market share in the EUV Coater/Developer market and has been chosen as a partner for ASML Holdings next generation high NA EUV lithography system.
I assume a long-term return potential of around 13.5% while my DCF valuation indicates that Tokyo Electron is fairly valued at the current price of ¥46,380 per share ($89.49 per ADR). The currently weak Japanese YEN might be an additional tailwind for USD investors.
I rate Tokyo Electron a buy for long-term investors at the current price.
For further details see:
Tokyo Electron: Underfollowed EUV Niche Market Leader