STRL - Top 10 Stocks For H2 2023
2023-07-25 05:00:00 ET
Summary
- The first half of 2023 marked a turnaround in the markets, with a tech rally and the S&P 500 logging a total return of +16%, despite signs of recession.
- Major indices hit session highs, and I am bullish on ten stocks for the second half of 2023.
- Outperforming the S&P 500, which is +18% YTD, my Top 10 picks overall portfolio that kicked off the year is +39%.
- Showcasing rock-solid companies fundamentally, ten out of ten of my quant picks for the second half of 2023 have experienced double- and triple-digit positive returns YTD.
- By focusing on stocks that can weather market volatility, my quant-based picks are collectively strong on characteristics of valuation, growth, profitability, momentum, and EPS Revisions.
Extreme Greed Is The Current Emotion Driving the Market
Extreme Greed Is The Current Emotion Driving the Market (CNN Fear & Greed Index)
MAMAA mia! Extreme greed is the sentiment driving market momentum in the second half of 2023. Led by a band of tech behemoths formerly known as FAANGs, MAMAA Stocks: Meta ( META ), Amazon ( AMZN ), Microsoft ( MSFT ), Apple ( AAPL ), and Alphabet ( GOOG ) are embracing the AI Revolution as the S&P 500 hopes to regain 2022 losses. With investors hopeful that the market is on track for a full recovery from bear to bull, I'm bullish on 10 Top Stocks for the second half of 2023.
Hot Stocks: From Bear to Bull Market
Economists said a global recession was inevitable, yet the most recent bear market cycles have been less intimidating than the previous three bears caused by the following:
-
2000-2002 Stock market bubble involving dot-com companies
-
2007-2009 Housing Crisis
-
2020 COVID-19 pandemic
21st Century Bear Markets Chart (US Bank)
The latest bear is seeing the U.S. stock market begin to recover from last year’s downturn. Aggressive Fed tightening, persistently high inflation, and slowing corporate earnings, coupled with a banking crisis and geopolitical concerns abroad have contributed to investor uncertainty. While economic slowdown, layoffs, and earnings misses have persisted into 2023, the latest inflation gauges show Core inflation is well above the Fed’s 2% target.
Core PCE vs. CPI
Core PCE vs. CPI (Advisorperspectives.com)
Considered less volatile, the Fed prefers the Core Personal Consumption Expenditure Price Index (PCE) to the Core Consumer Price Index ((CPI)), which removes food and energy costs. While unemployment remains historically low despite many job openings, the overall labor market is robust, contributing to consumer spending. Despite company profits contracting in the first quarter, which are likely to contract more in Q2, improvements in consumer spending, as highlighted by the Consumer Discretionary Sector ( XLY ), are making strides that could benefit corporate earnings into the year's second half. As US Bank’s Senior Investment Strategist Robert Haworth, CFA points out :
“Consumer’s willingness to maintain reasonable spending growth has been the linchpin for the economy.” Although the savings accumulated during the COVID-19 pandemic are dwindling, consumers have shown resilience, likely due in part to the strength of the labor market and more significant wage growth. “If investors’ confidence in earnings improves, that could give the market a boost…A concern is that earnings have been particularly strong for a select group of stocks , and we need to see improvement among a broader group of companies to upgrade prospects for the stock market as a whole.”
In anticipation of rate cuts, a fall in inflation, and the falling dollar, companies, especially those generating revenues outside of the U.S., may realize a great opportunity for upside. With trillions of dollars sitting in Treasuries and money markets waiting to be invested by companies, 2023 could be the year of the bull market and an excellent opportunity to capitalize on 10 Strong Buy-rated stocks for your portfolio. Based on average returns (assuming stocks are bought on January 5, 2023, and held through July 21, 2023), Seeking Alpha’s portfolio of Top 10 picks that kicked off the year is +39%, outperforming the S&P 500, +18% YTD. As we move through the rest of the year, consider a new set of fundamentally rock-solid companies that have experienced double- and triple-digit positive returns year-to-date.
Seeking Alpha’s quant-based picks are collectively strong on valuation, growth, profitability, momentum, and EPS Revisions characteristics. Some qualitative elements underscore these fundamentals, but focusing on quant-based stocks can help weather market volatility. As evidenced by the AI euphoria this year and the surge in the tech sector, Warren Buffett stated, “Artificial intelligence will be the most transformative technology in the world, and it will change the way we live and work in ways we can’t even imagine yet.”
S&P 500 Sectors' Performance YTD (Yardeni)
The tech sector leads the markets, +45% YTD, followed by Communications and Consumer Discretionary sectors. The robust labor markets are giving way to more purchasing, as the bull market and greedy sentiment offer investors an opportunity to find companies to invest in for the second half of the year that are profitable, generate strong free cash flow, have healthy balance sheets and low debt, and overall strong fundamentals is key. Consider my top 10 stocks.
1. Meta Platforms, Inc. ( META )
-
Market Capitalization (as of 7/21/23): $754.11B
-
Quant Rating: Strong Buy
-
Quant Sector Ranking (as of 7/21/23): 1 out of 250
-
Quant Industry Ranking (as of 7/21/23): 1 out of 62
Move over Twitter. Meta’s got some new Threads ! Meta Platforms, Inc., formerly known as Facebook, launched a rival platform to Twitter that allows users to publish short posts and updates that surpassed 100 million signups on July 10th. As the fastest-ever app continues to surge past 150 million downloads, Meta’s Family of Apps is growing and connects people through tech devices worldwide, showcasing why it's one of the most profitable companies in its sector and industry.
META Profitability Grades (SA Premium)
Up more than 133% YTD with tremendous momentum, Threads, Meta’s latest innovation, is considered the fastest-ever growing app. Boasting the largest audience and user base than any other social network, Meta’s ad revenue per user should benefit from increased advertisers looking to capitalize with Threads. As the push for AI grows, Meta’s pioneering AI strengths and its traditional products have helped drive profitability and growth and increase user engagement and ad revenue. By capitalizing on social media and market trends, Meta’s first-quarter earnings were strong, resulting in 48 FY1 Upward analyst revisions and zero downward following an EPS of $2.20 beating by $0.25 and revenue of $28.65B beating by $987.87M. Despite its pioneering technologies and powerful AI strengths, like much of the IT sector, Meta’s valuation is stretched. Its forward P/E ratio comes at a 41% premium to the sector. However, its forward PEG, which considers Meta’s tremendous growth, is 1.34x versus the 1.52x, a more than 11% difference to the sector. However, the tech disruptor has had its share of headwinds, including privacy concerns and declines in user traffic and ad revenue. Meta’s network, $50B cash hoard, and creativity position the company for top-line growth.
2. Alphabet Inc. ( GOOG ) & ( GOOGL )
-
Market Capitalization (as of 7/21/23): $1.53T
-
Quant Rating: Strong Buy
-
Quant Sector Ranking (as of 7/21/23): 5 out of 250
-
Quant Industry Ranking (as of 7/21/23): 4 out of 62
Like many Big Tech companies that suffered losses in 2022, Alphabet Inc., formerly known as Google, was my only Mega-Tech that remained a Strong Buy rating. Alphabet is known for its cloud-based tools, Google Chrome internet browser, and Android, the dominant global smartphone with tremendous top-line growth and social media platforms like YouTube. Alphabet’s nearly $90B cash from operations, gross profit margins ((TTM)) of +55%, and net income margin ((TTM)) of more than a 600% difference indicate why the company has A+ Profitability.
GOOG Stock Profitability Grades (SA Premium)
Like Meta, Alphabet has been at the forefront of pioneering technologies and platforms. With the push for artificial intelligence, Google’s recent launch of chatbot Bard in Europe and Brazil resulted in shares of the stock jumping nearly 5%.
Alphabet has faced some headwinds, including a suit filed by the Justice Department citing monopolization of the internet. Now, the U.N. Security Council is concerned about AI spreading misinformation and cybersecurity. Despite these headwinds, Google has benefited from advertising dollars and strong subscription growth, including an average of 50B YouTube viewers per day. Substantial momentum has catapulted Alphabet into 2023 with a first-quarter top-and-bottom-line earnings beat. EPS of $1.17 beat by $0.10 and revenue of $69.79B beat by $981.59M. Like Meta and most mega-techs, Alphabet comes at a premium valuation. Fortunately, its forward PEG ratio has a B- grade, showcasing a 15.74% difference to the sector. As the push for generative AI takes shape, Google has been ahead of the competition, highlighted by Alphabet CEO Sundar Pichai in the Q1 earnings call.
“AI has also been foundational to our ads business for over a decade. Products like Performance Max used the full power of Google’s AI to help advertisers find untapped and incremental conversion opportunities…I’m [also] pleased with the ongoing momentum in Cloud…Our disciplined expansion of our product roadmap and go-to-market organization has helped to build one of the largest enterprise software companies in the world.”
With significant cash generation, strong subscriptions, and ad revenue, this tech stock and our next continue to capitalize on long-term growth opportunities.
3. Axcelis Technologies, Inc. ( ACLS )
-
Market Capitalization (as of 7/21/23): $5.74B
-
Quant Rating: Strong Buy
-
Quant Sector Ranking (as of 7/21/23): 3 out of 583
-
Quant Industry Ranking (as of 7/21/23): 1 out of 29
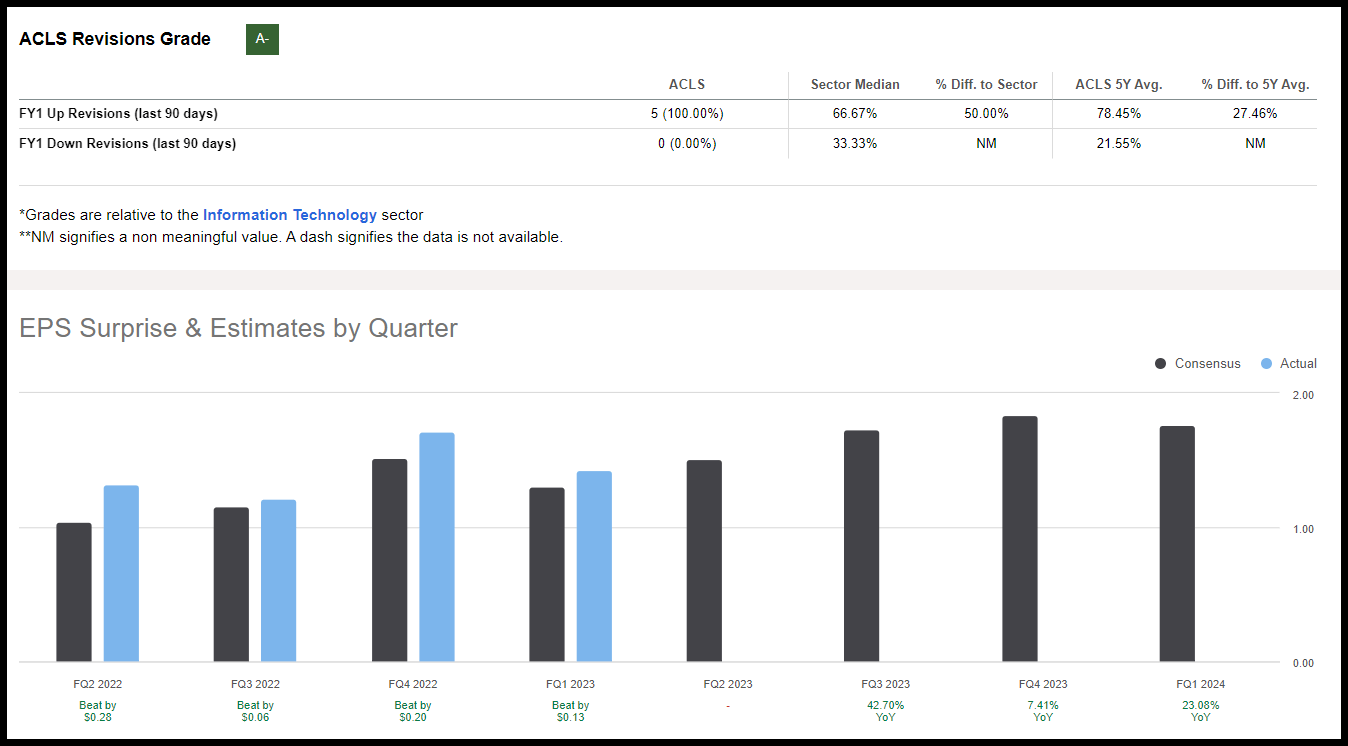
As of July 19th, Axcelis Technologies, Inc. is the top-performing semiconductor equipment stock and has weathered the IT sector's economic storms and cyclical shifts within its industry. Designing, manufacturing, and servicing some of the purest and most precise ion implantation platforms in semiconductor fabrication, favorable geographic mix, and secular tailwinds are aiding the growth and profitability of the company.
ACLS Stock EPS and Revisions Grade (SA Premium)
Axcelis has capitalized on accelerating the fabrication processes. Given the race to the digitization and electrification of vehicles, ACLS is helping chip manufacturers deliver the highest quality yield at lower costs. Shares of the stock have been on a significant uptrend, +123% YTD and +173% over the last year. With a growing network, strong earnings, growth, and profitability, Axcelis Technologies' first quarter EPS of $1.43 beat by $0.13 and revenue of $254.02M beat by nearly 25% year-over-year. Not only does the company come at a discounted valuation, which includes a forward PEG of 1.34x versus the sector median of 1.94x, backlog for ACLS products set a record of $1.27B that included quarterly booking of $298M, driven by its Purion product family.
“At the beginning of this year, we expected 2023 revenue to exceed $1 billion. We are now forecasting to beat that estimate by $30 million, exceeding $1.03 billion. This represents revenue growth of approximately 12% in a year in which overall wafer fab equipment is expected to decrease by over 20%. In the second half, in addition to stronger revenues, we expect significant margin expansion driven by mix and improved costs. The mature process technology market continues to be an area of strength for Axcelis, with 89% of first-quarter system shipments going to mature foundry logic customers and 11% to memory customers composed entirely of DRAM,” said Mary Puma , Axcelis President & CEO.
Expected to announce earnings next week, ACLS is one to consider for portfolios.
4. Extreme Networks, Inc. ( EXTR )
-
Market Capitalization (as of 7/21/23): $3.49B
-
Quant Rating: Strong Buy
-
Quant Sector Ranking (as of 7/21/23): 6 out of 583
-
Quant Industry Ranking (as of 7/21/23): 1 out of 49
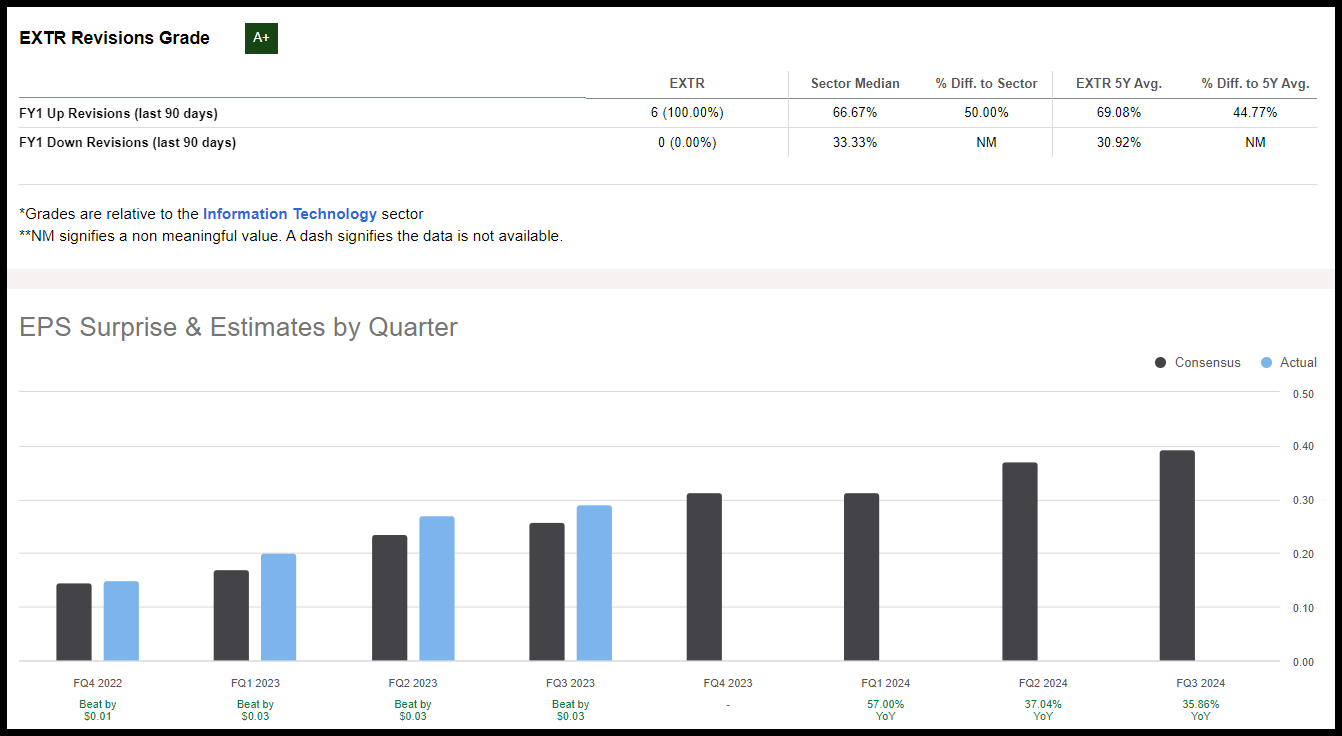
Extreme Networks, Inc. has been on a surge, +46% YTD and up 150% over the last year. Highlighted by Oppenheimer Senior Analyst Timothy Horan , Extreme Networks rose 7.5% after he stated that he sees the stock as a “major beneficiary” in the move toward cloud computing and AI.
Attractively valued with a ‘C+’ valuation grade, the communications equipment company has a forward PEG ratio that’s a 35% difference to its sector peers. With a new CFO , EXTR offers growth and consecutive earnings beats. Extreme crushed earnings, with its recent third-quarter EPS of $0.29 beating by $0.03 and revenue of $332.51M, up 16% Y/Y, resulting in six analyst upward revisions over the last 90 days and zero down.
EXTR Stock EPS and Revisions Grade (SA Premium)
With little debt and extremely bullish momentum, Extreme’s Q3 results gave way to a record $39M in Non-GAAP net income, new SaaS subscription growth bookings of nearly 30% Y/Y, and record profitability and cash generation. Tremendous operating margins and adjusted EBITDA of $57M enabled EXTR to repurchase 1.4M shares for $25M, just a few of the many highlights for their results.
EXTR Stock FQ3'23 Results (EXTR Stock FQ3'23 Results (EXTR Q3'23 Investor Presentation))
Through competitive differentiation, its flexibility of combining universal hardware, and best-in-class automation, Extreme’s executive management expects total revenue growth to accelerate over 20% through the year while capturing greater market share. Extreme’s growth outlook through fiscal 2025 is confident, and we are confident in the Strong Buy rating of this stock. As we transition from tech stocks to the consumer discretionary sector, my following two stocks rank #1 and #2 in the homebuilding industry.
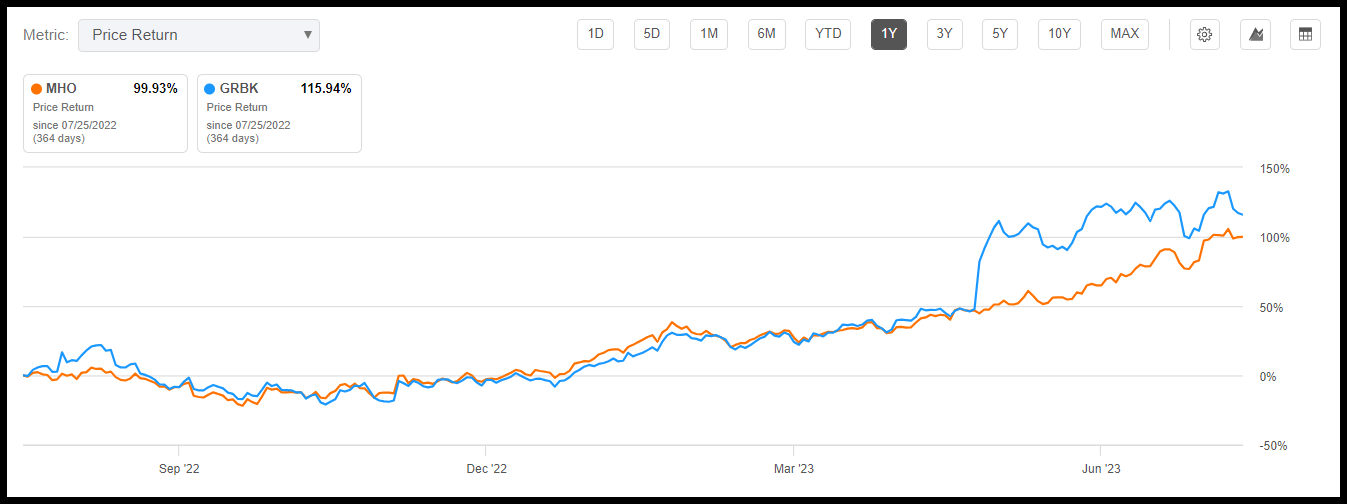
1-yr Price Performance, MHO & GRBK
1-yr Price Performance, MHO & GRBK (SA Premium)
Despite Real Estate ( XLRE ) being the worst-performing sector over the last year (-8%), homebuilding ( XHB ) and U.S. Home Construction ( ITB ) are experiencing an uptick, with my next stock pick M/I Homes, Inc. +100% and Green Brick Partners, Inc. +115% over the last year. Undervalued with bullish momentum, each of their PEG ratios indicates extreme discounts, with MHO’s trailing PEG of 0.17x, nearly a 75% discount to the sector, and GRBK’s forward PEG of 0.15x, an 89% discount to the sector.
MHO vs GRBK Valuation Metrics (as of 7/19/23) (SA Premium)
Both stocks have significant A+ momentum, showcased in strong quarterly price performance. Wall Street analysts have continued to deliver upward revisions on the heels of consecutive earnings beats, so it is crucial to dive into each of these Top Homebuilding Stocks individually.
5. M/I Homes, Inc. ( MHO )
-
Market Capitalization (as of 7/21/23): $2.54B
-
Quant Rating: Strong Buy
-
Quant Sector Ranking (as of 7/21/23): 6 out of 530
-
Quant Industry Ranking (as of 7/21/23): 2 out of 24
A leading single-family homebuilder across diverse geographies in the U.S., focused on financial strength and building affordable communities comprising 50% of its recent quarter sales, contributing to its Q1 EPS of $3.64 that beat by $1.28 and revenue of $1B that beat by 16.23% Y/Y. Growth of MHO has been solid despite a rapidly changing market over the last year. As financial and economic conditions improve, the new contracts and its inventory backlog have led to a record quarterly net income of 12% for the first quarter, equivalent to $103M. Revenue driven by a 10% increase in closings and a 6% increase in an average sale price of +16% produced a Q1 record of $1B, warranting MHO’s Strong Buy rating. Its stellar performance is also why it was selected in October as an Alpha Pick , returning a whopping 151% since its addition to the Alpha Picks portfolio.
MHO & GRBK Stocks Price Performance
MHO & GRBK Stocks Price Performance (SA Premium)
A look at MHO and GRBK’s price performance speaks for itself. Double- and triple-digit price performance throughout the years is a testament to their solid fundamentals. Let’s take a closer look at why GRBK is a top pick.
6. Green Brick Partners, Inc. ( GRBK )
-
Market Capitalization (as of 7/21/23): $2.48B
-
Quant Rating: Strong Buy
-
Quant Sector Ranking (as of 7/21/23): 2 out of 530
-
Quant Industry Ranking (as of 7/21/23): 1 out of 24
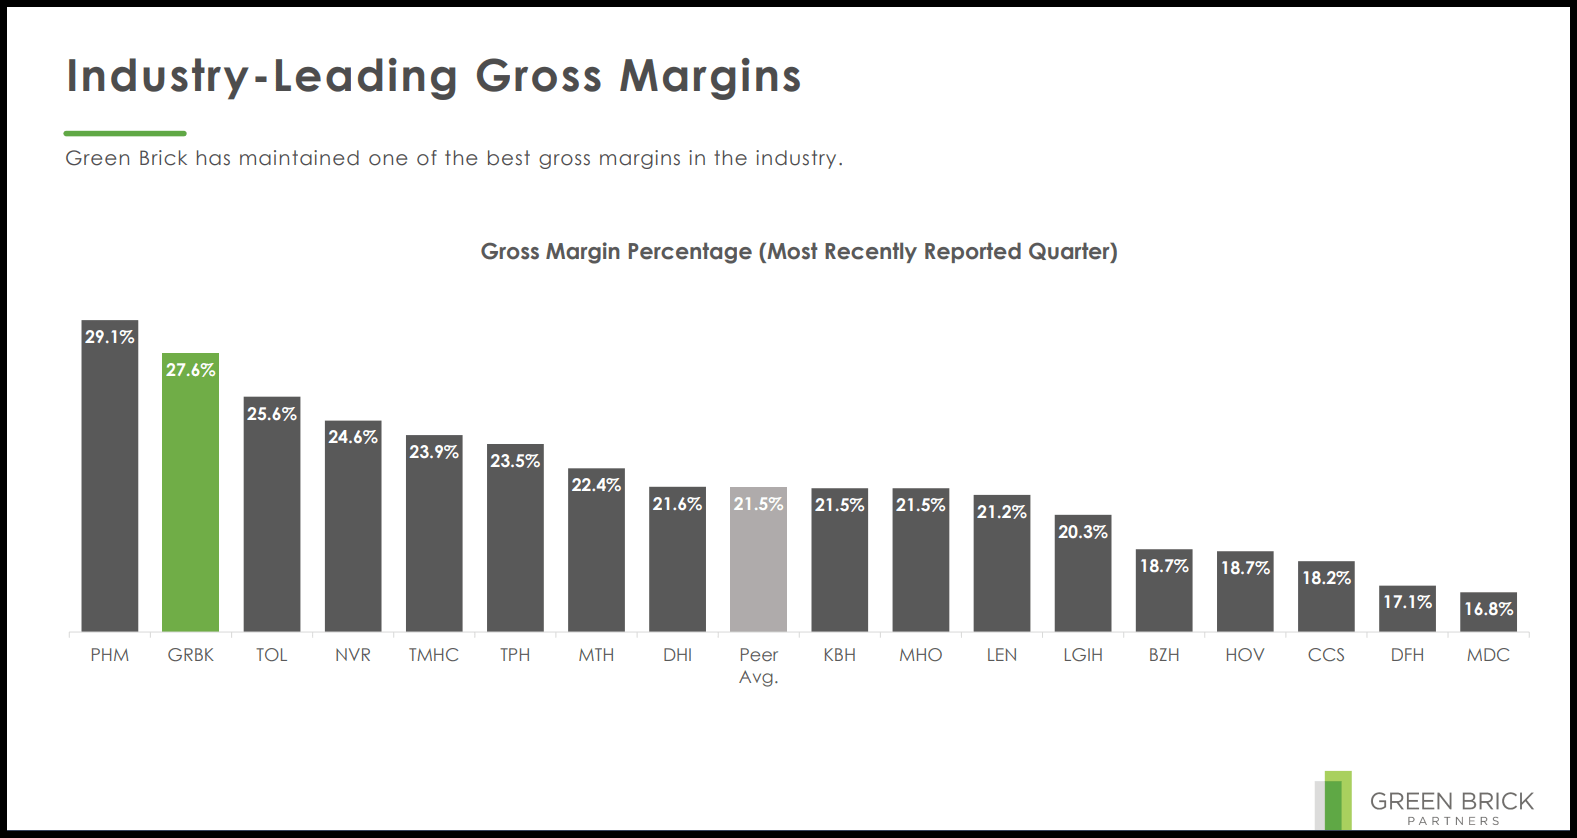
Green Brick Partners, Inc. is an award-winning homebuilder focused on building neighborhoods of lasting value. Together with its subsidiaries, GRBK offers a diverse collection of home products, luxury homes, and land development. In addition to its discounted valuation, bullish momentum, and strong earnings growth, GRBK also reported record home closing and revenue, with a homebuilding gross margin of 27.6% in the first quarter. Although rising mortgage rates and elevated costs persist along with fears of recession, GRBK and MHO are poised for growth given their strategic approaches to cutting costs, operational efficiency, and possess strong balance sheets. With a Q1 EPS of $1.37 beating by $0.71 and revenue of $452.06M beating by nearly 15% year-over-year, GRBK’s strong management, deep expertise, and network have led to industry-leading results.
GRBK Stock has industry-leading results (Green Brick Partners Q1 2023 Investor Presentation)
While the Fed’s tightening and a home sales slowdown pose risks to the industry, homebuilding has remained strong. Developers like Green Brick and M/I Homes, with excellent fundamentals, strong financials, and a strong network, continue to capitalize. Consider capitalizing on these attractively valued stocks and my next pick, a construction and engineering firm.
7. Sterling Infrastructure, Inc. ( STRL )
-
Market Capitalization (as of 7/21/23): $1.78B
-
Quant Rating: Strong Buy
-
Quant Sector Ranking (as of 7/21/23): 8 out of 654
-
Quant Industry Ranking (as of 7/21/23): 2 out of 34
Focused on the construction and engineering of infrastructure that affects everyone around us, Sterling Infrastructure, Inc. has undertaken projects for highways, roads, bridges, airports, and much more. Through tech innovations and e-infrastructure, Sterling’s backlog and book-to-burn ratio are growing to add to its revenue and consecutive earnings beats. Its E-Infrastructure accounts for over half of its revenues, with the fastest and highest growing margin segment. Boasting nine straight top-and-bottom-line earnings beats, Sterling’s Q1 2023 EPS of $0.64 beat by $0.08 and revenue of $403.58M beat by $27.91M, despite supply chain and macroeconomic challenges. The company’s strategic vision and execution deliver strong growth at an attractive valuation.
STRL Stock's Strategic Executions Deliver Results (STRL Investor Presentation)
Sterling’s forward P/E ratio is 16.47x compared to the sector’s 17.69x is discounted. Additionally, its forward PEG ratio is nearly a 50% difference to the sector. Although trading at its 52-week high, the stock's momentum is on an upward trend. Quarterly price performance continues to rise, with a YTD price performance of +70% and a one-year price performance of +145%.
STRL Stock Momentum Grades (SA Premium)
As the economy recovers, Sterling plans to capitalize on the tailwinds from the reemergence of U.S. manufacturing through onshoring and large projects. With recent awards by Hyundai and Rivian , Sterling is a Top Industrial to consider for a portfolio.
8. Carnival Corporation & plc ( CCL )
-
Market Capitalization (as of 7/21/23): $22.33B
-
Quant Rating: Strong Buy
-
Quant Sector Ranking (as of 7/21/23): 8 out of 530
-
Quant Industry Ranking (as of 7/21/23): 2 out of 35
Discretionary spending for goods that increased during the pandemic has shifted to services over the first part of 2023, delivering a 3.5% average spending growth. As cyclical stocks are seeing an upswing, travel services have benefitted, so I’ve selected Carnival Corporation, known best for its fleet of +90 ships traveling worldwide. Although the stock comes at a bit of a premium, highlighted by a D+ valuation grade, its forward Price/Cash Flow of 7.67x is a 16% discount, and the company has tremendous momentum and solid growth.
CCL Stock Momentum Grade (SA Premium)
Carnival Corporation delivered consecutive earnings beats. For the second quarter, EPS of -$0.31 beat by $0.02 and revenue of $4.91 billion beat by a whopping 104.54% Y/Y. Carnival’s return to profitability following crushing blows due to COVID-19 has repositioned and deployed ships for faster growth opportunities, balancing supplies in high-capacity regions like the Caribbean and Mediterranean.
With passengers increasing travel, Carnival has historically offered cost advantages and planned to modestly increase its average price over the next five years while improving its brand equity. While geopolitical and macroeconomic risks are still present, especially in Eastern Europe, as highlighted by Carnival President and CEO Josh Weinstein :
“Based on continued strength in pricing, we have also raised our expectation for net per diems in the second half by over 2.5 points while again maintaining our occupancy expectations, which is supporting our guidance of higher net yields in the second half of 2023 over 2019 in constant currency. This revenue growth will be significantly higher than the increase in our cost guidance…We are now expecting adjusted EBITDA of $4.10 billion to $4.25 billion above the high-end of our prior guidance range. As I mentioned, booking volumes reached an all-time high in our second quarter, exceeding the record levels we achieved in the first quarter, which would normally be our peak period.”
Given the optimistic outlook and economies pushing for a turnaround, gear up to set sail with this strong buy stock and two airline picks ready to take flight!
9. Delta Air Lines, Inc. ( DAL )
-
Market Capitalization (as of 7/21/23): $31.09B
-
Quant Rating: Strong Buy
-
Quant Sector Ranking (as of 7/21/23): 11 out of 654
-
Quant Industry Ranking (as of 7/21/23): 4 out of 27
Airline travel reached record levels over the 4th of July this year. Delta Air Lines and American Airlines are on a rally, with Delta up 47% YTD and American +33% for the same period.
Offering air transport for passengers and cargo, Delta Air Lines is a premium carrier, our #4 industry-ranked airline, and a Morgan Stanley favorite , and boasts supreme technologies, amenities, personalized experiences, and a management team focused on the customer. Delta is among the highest-rated airlines by Forbes, Fortune, and the Wall Street Journal. Attracting and rewarding brand-loyal frequent flyers, Delta’s premium experiences are showcased in its per-unit revenue premiums compared to its competitors. Delta’s price-competitive ability and offerings, including a five-cabin segmentation strategy, commanded an industry-leading $0.0409 spread between passenger revenue and costs per mile from 2015 through 2019. Offering one of the most extensive frequent flyer programs in the U.S., Delta brings high-margin revenue streams from banks and credit card rewards and expects to let the good times roll . After Q1 revenues set a record for the quarter, +45% from the previous year and generating nearly $2B in free cash flow, Delta anticipates a Q2 EPS of $2.36 and revenue of $15.46B for Thursday’s open. Despite a first-quarter EPS miss of $0.04, 18 Wall Street analysts revised estimates up, and there were zero downward revisions in the last 90 days.
DAL Stock Growth Grades (SA Premium)
Delta has an EPS FWD Long Term Growth (3-5 year CAGR) of 33.51%, year-over-year EBITDA Growth of 410%, and its industry-leading profitability in 2022 allowed them to pay more than $550M in profit sharing.
“Our brand is built on a foundation of service and operational reliability, and we are committed to delivering the level of service our customers expect as we ramp operations for the coming summer season. The operating teams have done a great job getting ready, and we are planning to grow June quarter capacity 17% over last year to meet strong customer demand,” said Ed Bastian , Delta CEO.
In addition to excellent growth and profitability, Delta trades at an extreme discount, with strong momentum.
Delta Stock Valuation
Trading at an extreme discount, Delta offers room for upside. With a forward P/E ratio of 7.22x compared to the sector median of 17.69x, DAL trades at a 60% discount. Additionally, its forward PEG is an 88% difference.
DAL Stock vs. AAL Stock Valuation
DAL Stock vs. AAL Stock Valuation (as of 7/19/23) (SA Premium)
Diving into American Airlines and looking at its valuation above compared to Delta, AAL is also trading at an extreme discount.
10. American Airlines ( AAL )
-
Market Capitalization (as of 7/21/23): $11.38B
-
Quant Rating: Strong Buy
-
Quant Sector Ranking (as of 7/21/23): 7 out of 654
-
Quant Industry Ranking (as of 7/21/23): 3 out of 27
The #3 ranked airline, American Airlines, is also extremely discounted. With a forward P/E ratio of 5.83x compared to the 17.69x median, it’s trading more than a 70% difference to the sector, with a forward PEG ratio that’s a 97% difference. While American Airlines has faced its share of headwinds, including the title as one of the World’s Most Unreliable Airlines , it has come out of the pandemic stronger. Consecutive earnings beats have resulted in 17 Wall Street analysts revising estimates up over the last 90 days. Although its first-quarter revenue missed EPS of $0.05 beat by $0.02, the company remains focused on strengthening its balance sheet and, for the first time in four years, reported profits of nearly $1B compared to Q1 2022.
Continuing to increase capacity, AAL produced record Q1 revenues of nearly 12.2B. American’s strong operational performance, driven by investments in its team and technology, has allowed them to operate more than 476,000 flights in Q1. With $14.4B total liquidity for Q1, strong booking strength, and a debt reduction, American Airlines is one of our Top 10 Stocks for the second half of 2023, ready to fly high. Consider each of my ten picks for a portfolio.
Will the stock market surge continue in the second half of 2023?
Stocks continue to surge in the second half of 2023, as indexes exited their bear markets, including the S&P 500’s breakout last month. With a new bull market rally, investors want to know what sectors and industries to invest in.
Where some volatility is likely to remain, especially as uncertainty still surrounds the Fed’s policies, focusing on financially healthy companies that can equate to healthy profits is crucial. Our Top 10 Stocks for the second half of 2023 were selected using a data-driven Quant Rating System to draw on the best collective characteristics of valuation, growth, profitability, momentum, and EPS Revisions. Although fears of a Fed-forced recession have come down, as rates and inflation fall and economic recovery gains steam, we’ve started to experience a bull market. While we’re likely to see additional macroeconomic challenges, the stocks I’ve selected have more positive demand factors to outweigh the headwinds. Consider the 10 Strong Buy recommendations, or here is the ranking of more Seeking Alpha Top Rated Stocks . Alternatively, if you’re looking for just a few ideas a month, the best of the best sifted from thousands of stocks, check out Alpha Picks .
For further details see:
Top 10 Stocks For H2 2023