STOHF - TotalEnergies: An Energy Major Worth Considering
Summary
- TotalEnergies SE has generally performed well in recent years, and 2022 is slated to be a fantastic year for the business.
- Investors need to be wary of volatility, but the firm's impressive track record and diverse operations provide some safety long-term.
- Add in how shares are priced, and the company definitely warrants some consideration.
One undeniable truth in this world is that, in order for everything to function, we currently need a tremendous amount of energy. Given the sheer quantity of energy needed to make everything function, it should come as no surprise that there would be a large number of companies, including some that are very large themselves, that have grown to provide these needs to the rest of the planet. One such firm that investors should be aware of is TotalEnergies SE ( TTE ). With a market capitalization of $156.4 billion, this particular player is one of the largest out there. Relative to similar firms, I wouldn't exactly say that shares are cheap. But on an absolute basis, the company does look affordable enough to offer some upside potential for those who are patient and can hold on for the long haul. Due to this, I've decided to rate the company a 'buy' at this time to reflect my view that shares should outperform the broader market for the foreseeable future.
A diverse energy play
The simplest way to describe TotalEnergies SE would be to refer to the company as a diverse, integrated energy conglomerate. But this on its own does not really encapsulate all that the company does. To truly understand the business, we should break it up into its core operating segments. In all, it has four segments, plus its corporate operations. The first of these segments is called Integrated Gas, Renewables & Power. According to management, this particular unit comprises the integrated gas (including the LNG) operations of the enterprise, as well as its low-carbon electricity businesses. On the LNG side of things, the segment includes both the upstream and midstream activities of the business. At the end of the day, this is a fairly small portion of the enterprise. Using data from the company's 2021 fiscal year, this segment was responsible for 13.9% of the company's revenue but for a rather impressive 30% of its profits.
Next in line, we have the Exploration & Production segment of the company. As anybody who is intimately familiar with the fossil fuel industry can likely guess, this particular portion of the company centers around the actual exploration of fossil fuels and their extraction from the ground. It's also worth noting that this segment includes all of the company's operations under its carbon sink activities such as carbon storage and nature-based solutions. From a revenue perspective, this portion of the enterprise is not particularly large, accounting for only 16.7% of its revenue. However, it accounts for the lion's share of profits, with 44% of its profitability in total coming from this one unit. We also have a third segment called Refining & Chemicals that includes the refining, petrochemical-oriented, and specialty chemical-oriented operations of the firm. It also includes the activities of its oil supply, trading, and marine shipping business. This unit was responsible for 45.3% of the company's revenue last year but for only 16.5% of its profits. And finally, we have the Marketing & Services segment, which includes the global activities of the company's supply and marketing operations centered around petroleum products. This unit made up 24.1% of the company's revenue, but only 9.5% of its profits last year.
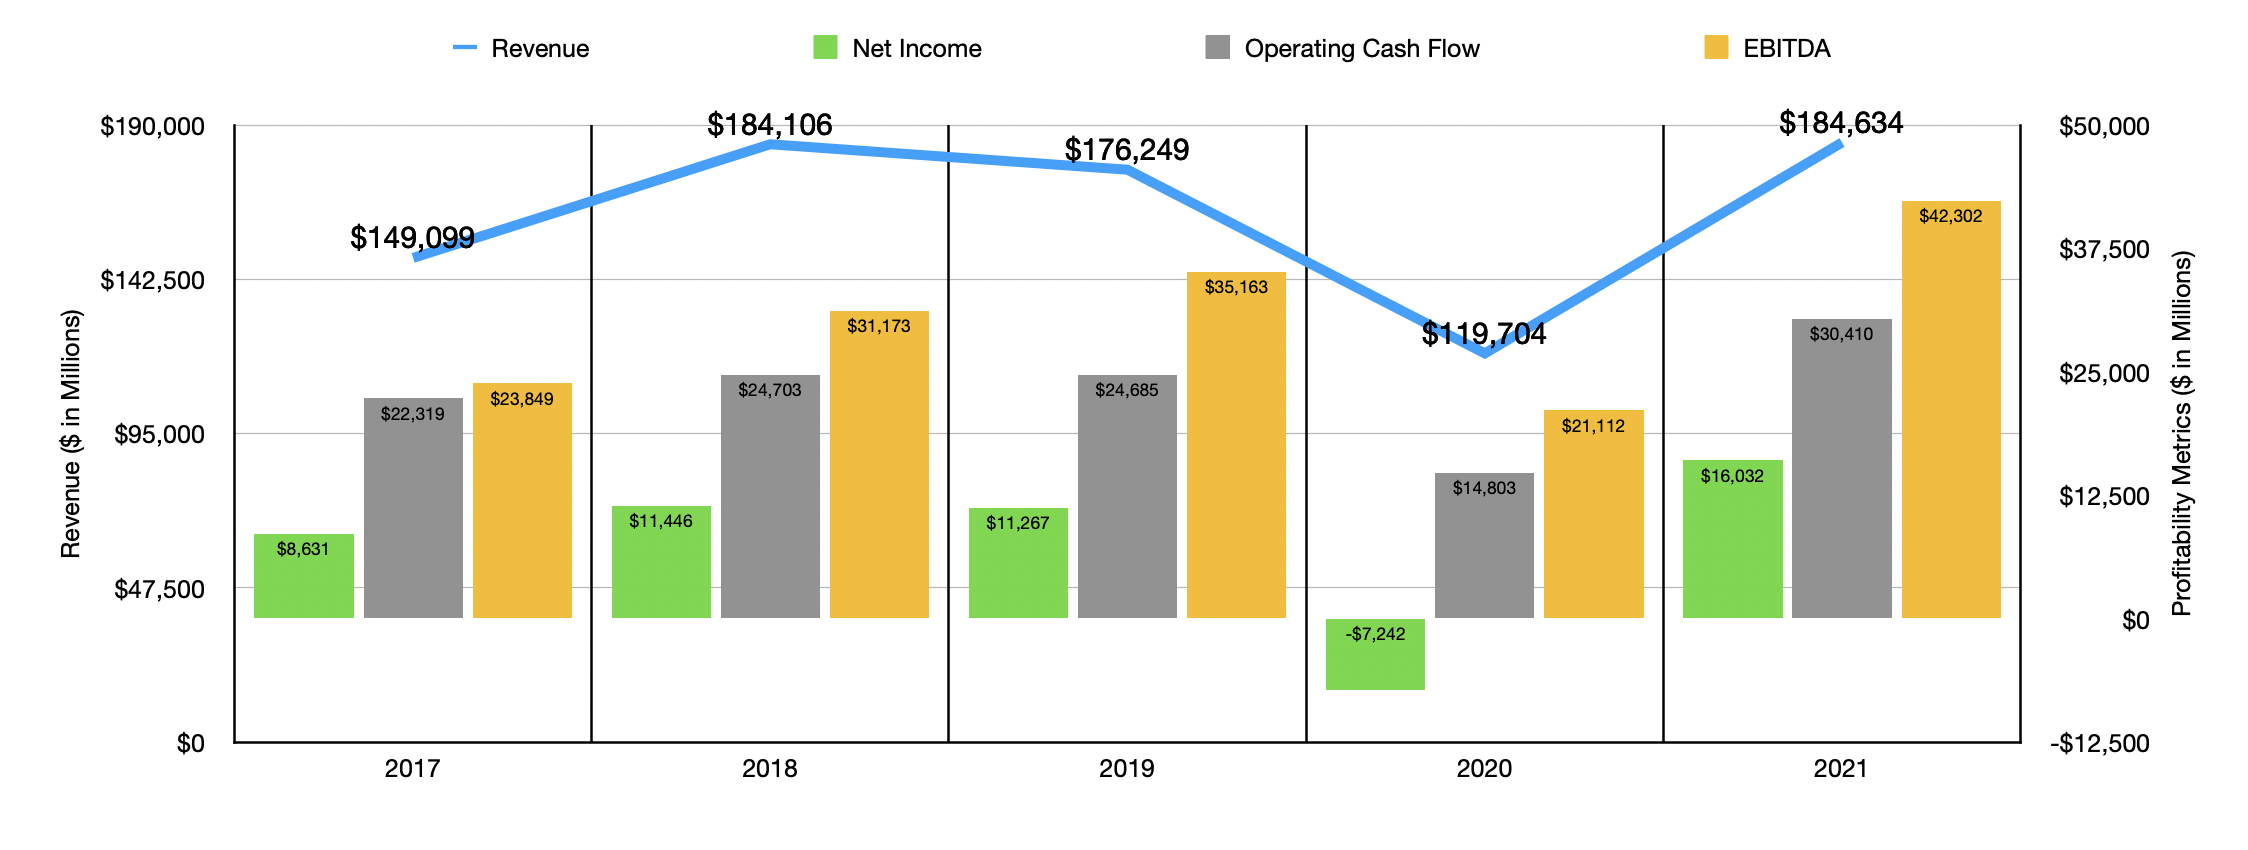
Although there will always be energy demand, making this space guaranteed to experience some activity as time goes on, it's also true that the industry is subject to severe volatility based on exactly how much demand there is and the impact of supplies on pricing. This volatility can be seen by looking at the company's financial results over the past few years. In 2017, for instance, the company generated revenue of $149.1 billion. That number then shot up to $184.1 billion in 2018 before pulling back some to $176.2 billion in 2019. In 2020, revenue fell further to $119.7 billion before rebounding nicely to $184.6 billion for the 2021 fiscal year. Aiding the company is its growing LNG operation. Overall LNG sales, as measured by metric tons, shot up from 34.3 in 2019 to 42 in 2021. There were, of course, other growth areas for the company during this time. Under the same segment as the LNG operations, we had a surge in net power production associated with renewables and electricity, a number that increased from 11.4TWh to 21.2TWh over a three-year window.
Unfortunately, not every segment of the company was experiencing growth. Under the Exploration & Production segment, for instance, Actual hydrocarbon production fell year over year, with liquids production dropping 2.5% while gas production fell 1.4%. Although this was the case, external sales for the segment shot up from $4.97 billion to $7.25 billion, with the real driver here being Increased pricing as geopolitical issues and a rapid recovery following the COVID-19 pandemic caused a shortage in fuel products. Refining and Chemicals revenue growth was particularly strong in 2021, with external sales of $168.9 billion dwarfing the $120.1 billion reported only one year earlier.
Just as has been the case with revenue, profitability for the company has also been quite volatile. Over the past five years, the company has gone from generating a net loss of $7.2 billion to generating a profit of $16 billion, with no clear trend visible. Fortunately, other profitability metrics were more stable. Operating cash flow has increased most years, climbing from $22.3 billion in 2017 to $30.4 billion in 2021. A similar trend can be seen with EBITDA, with the metric climbing from $23.8 billion in 2017 to $42.3 billion in 2021.
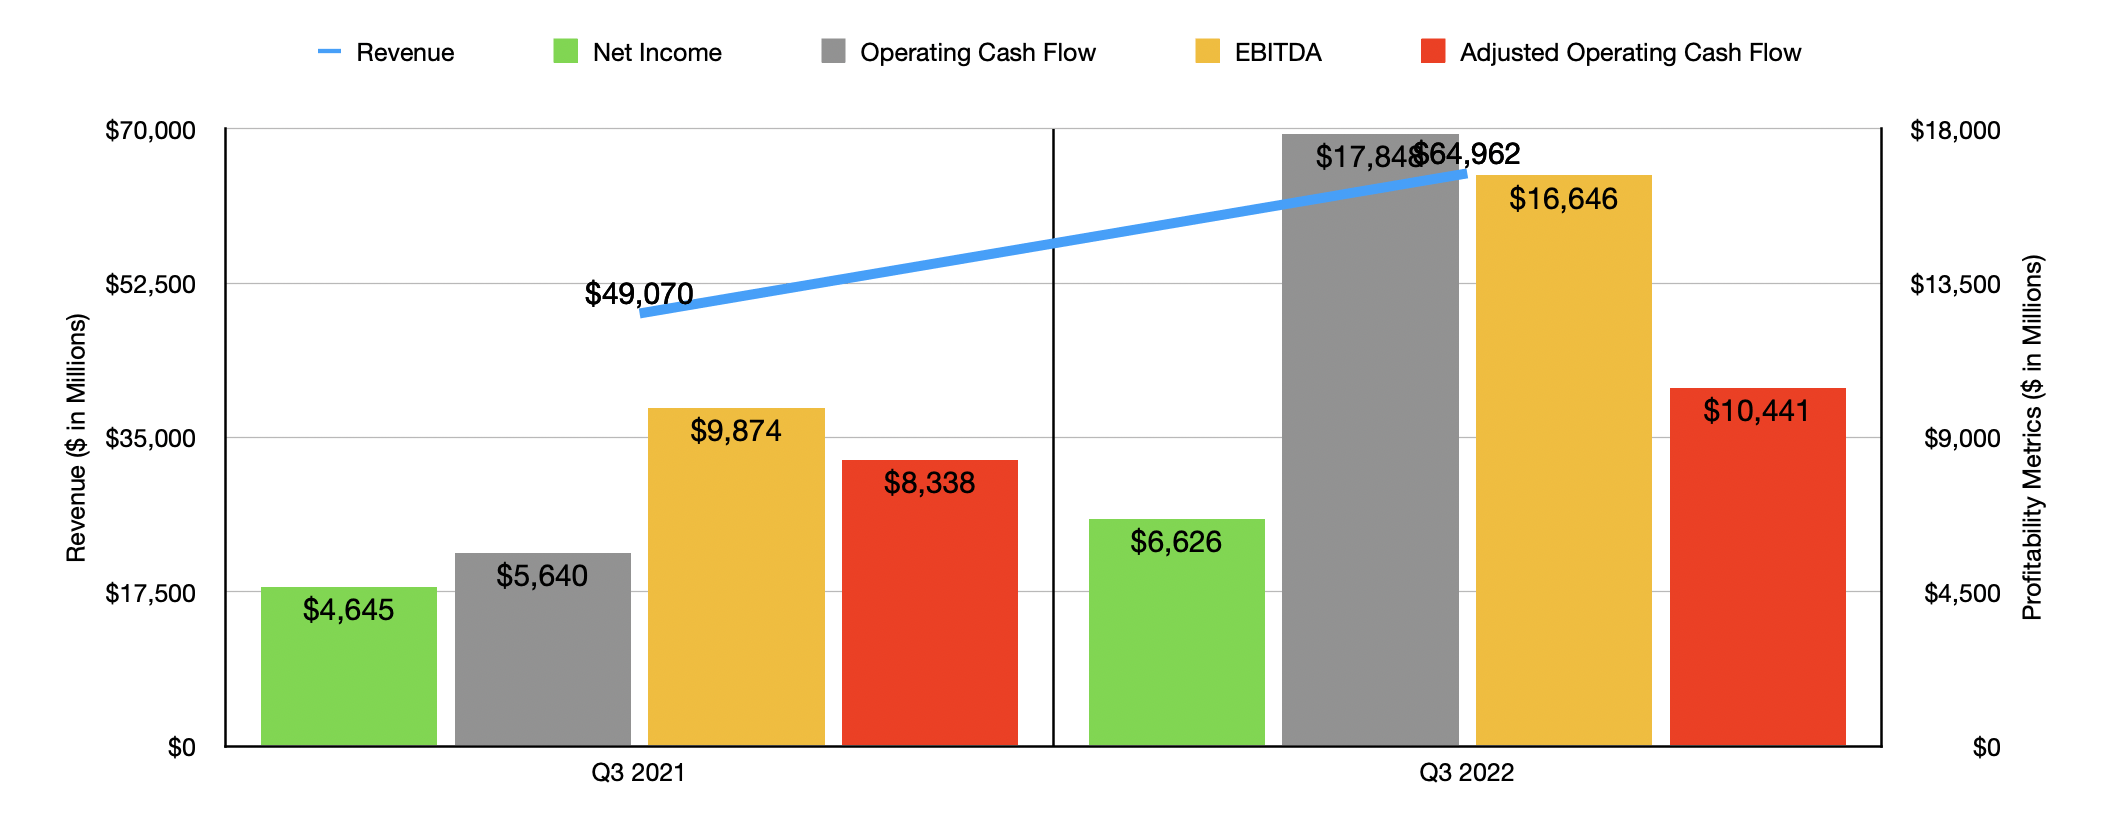
When it comes to the current fiscal year, the company is posting some really solid results. Revenue of $199.4 billion in the first nine months of the year dwarfs the $129.3 billion reported the same time last year. It shouldn't be a surprise that profitability followed revenue higher so far this year. Net income of $17.3 billion beats out the $10.2 billion reported at the same time last year. Operating cash flow fared even better, shooting up from $18.8 billion to $41.7 billion, while the adjusted figure for this jumped from $21.6 billion to $36.8 billion. Even EBITDA Sorry nice increase, shooting up from $24.9 billion to $49.4 billion. As you can see when looking at the chart above, even data centering only on the third quarter of this year relative to the same time last year shows bullish results.
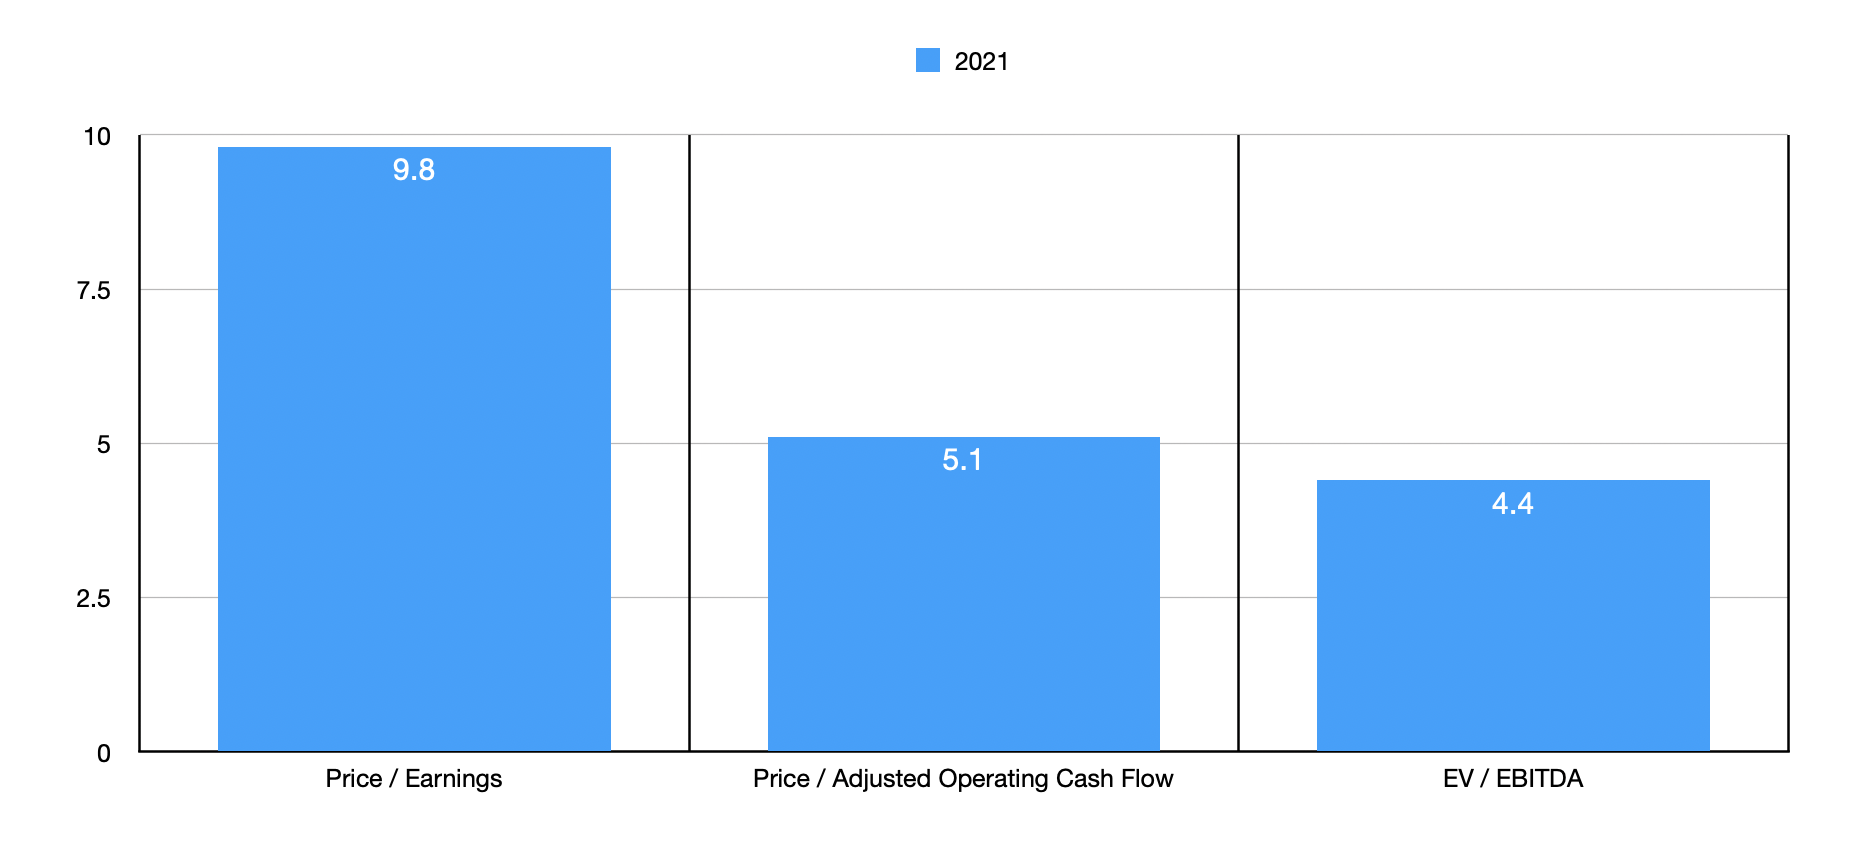
When it comes to the 2022 fiscal year and its entirety, it's clear that the year is slated to be better than in prior years. Instead of this, I decided to value the company based on results from 2021 because of the extreme nature of pricing in 2022. Doing so, we end up with a price-to-earnings of just 9.8, a price to adjusted operating cash flow multiple of 5.1, and an EV to EBITDA multiple of 4.4. As part of my analysis, I also compare the company to five similar firms. On a price-to-earnings basis, these companies ranged from a low of 8.4 to a high of 18.7. In this case, only one of the five companies was cheaper than TotalEnergies SE. Using the price to operating cash flow approach, the range was from 2.6 to 5.4, with four of the five companies being cheaper than our prospect. And when it comes to the EV to EBITDA approach, the range was from 1.9 to 5.8, with three of the five being cheaper than our target.
| Company |
| Price / Earnings |
| Price / Operating Cash Flow |
| EV / EBITDA |
| TotalEnergies SE |
| 9.8 |
| 5.1 |
| 4.4 |
| Shell ( SHEL ) |
| 8.4 |
| 3.8 |
| 3.4 |
| Equinor ( EQNR ) |
| 10.0 |
| 3.0 |
| 1.9 |
| BP ( BP ) |
| 11.9 |
| 3.8 |
| 4.2 |
| Occidental Petroleum ( OXY ) |
| 18.7 |
| 2.6 |
| 4.6 |
| Exxon Mobil ( XOM ) |
| 11.4 |
| 5.4 |
| 5.8 |
Takeaway
At this point in time, TotalEnergies SE has a solid track record and is generating significant positive cash flows. I am a tiny bit concerned about what volatility might yield in the future given the volatility of the energy markets in general. But even using data from 2021, shares of the business look cheap on an absolute basis while being affordable relative to similar businesses. Do I think that this would be a home-run opportunity for investors that will make them rich? Certainly not. But for investors who want an integrated, diverse energy play that should fare well over the long haul, I think that this is a solid opportunity to consider.
For further details see:
TotalEnergies: An Energy Major Worth Considering