XMLV - TPHD: A Dividend ETF With Biblical Aspirations
2023-10-09 06:52:02 ET
Summary
- Timothy Plan High Dividend Stock ETF tracks a Biblically Responsible Investing index.
- It holds mostly mid-cap stocks with industrials, utilities and energy appearing as top sectors.
- Valuation metrics are similar to a mid-cap benchmark, and quality is a bit better.
- TPHD has outperformed competitors in total return since inception, but data history is too short to assess the strategy from a financial point of view.
This article series aims at evaluating ETFs (exchange-traded funds) regarding past performance and portfolio metrics. Reviews with updated data are posted when necessary.
TPHD strategy and portfolio
Timothy Plan High Dividend Stock ETF ( TPHD ) started investing operations on 5/1/2019 and tracks the Victory US Large Cap High Dividend Volatility Weighted BRI Index. The fund has 100 holdings, a trailing 12-month yield of 2.43% and an expense ratio of 0.52%. Distributions are paid monthly. The yield is quite low for an ETF with a "high dividend" denomination, and the fee is quite high for a passively managed ETF holding large and mid-cap stocks.
"BRI" in the underlying index name means Biblically Responsible Investing. The index picks dividend stocks based on principles inspired from the Bible and formalized by eVALUEator proprietary screens. Religious interpretations and moral principles may vary: interested investors may want to check these screens. For example, they seem quite restrictive regarding companies promoting LGBTQ rights and abortion rights by their products, services, donations or communication. Some Christian investors will like it, and other ones won't (please note that comments of political nature are unwelcome on Seeking Alpha and may be moderated). Most will agree on other criteria like the respect of workers and labor rights.
The index selects 100 dividend stocks passing these screens, and they are weighted based on the standard deviation of daily returns (volatility) over the last 180 trading days. Less volatile stocks are given a higher weight.
The fund is almost exclusively invested in US companies (about 97% of asset value), mostly in mid-cap companies (73% according to Fidelity). Therefore, I will use as a benchmark the S&P MidCap 400 Index, represented by iShares Core S&P MidCap ETF ( IJH ).
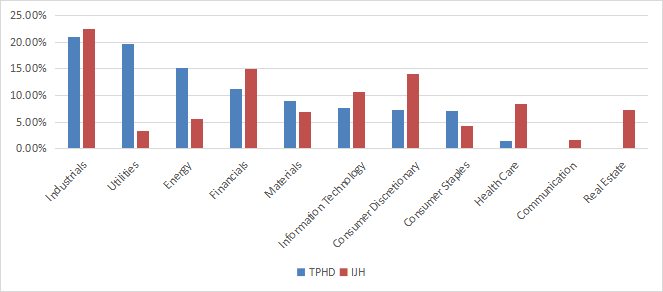
Like for the mid-cap benchmark, the heaviest sector is industrials (about 21% of asset value). Compared to IJH, TPHD massively overweight utilities (19.7%) and energy (15.2%). It ignores real estate, communication, and underweights mostly healthcare and consumer discretionary.
Sector breakdown (Chart: author; data: Fidelity, SSGA)
The top 10 holdings, listed in the next table with fundamental ratios, have an aggregate weight of 14.5%. No position weighs more than 1.6%, so risks related to individual companies are low.
| Ticker |
| Name |
| Weight% |
| EPS growth %TTM |
| P/E TTM |
| P/E fwd |
| Yield% |
| Aflac, Inc. |
| 1.55% |
| 12.66 |
| 10.39 |
| 12.87 |
| 2.16 |
| Hormel Foods Corp. |
| 1.51% |
| -12.53 |
| 23.09 |
| 22.51 |
| 2.98 |
| Amgen, Inc. |
| 1.48% |
| 25.70 |
| 18.04 |
| 14.57 |
| 3.19 |
| Eaton Corp. Plc |
| 1.47% |
| 17.50 |
| 31.06 |
| 23.98 |
| 1.64 |
| Waste Management, Inc. |
| 1.45% |
| 8.82 |
| 27.92 |
| 26.14 |
| 1.80 |
| Erie Indemnity Co. |
| 1.44% |
| 20.21 |
| 45.19 |
| 40.00 |
| 1.57 |
| General Dynamics Corp. |
| 1.42% |
| 3.15 |
| 18.05 |
| 17.39 |
| 2.40 |
| Snap-on, Inc. |
| 1.42% |
| 13.10 |
| 14.40 |
| 14.00 |
| 2.50 |
| Hubbell, Inc. |
| 1.40% |
| 20.75 |
| 26.46 |
| 20.32 |
| 1.45 |
| The J. M. Smucker Co. |
| 1.34% |
| -102.96 |
| N/A |
| 11.85 |
| 3.69 |
Historical performance
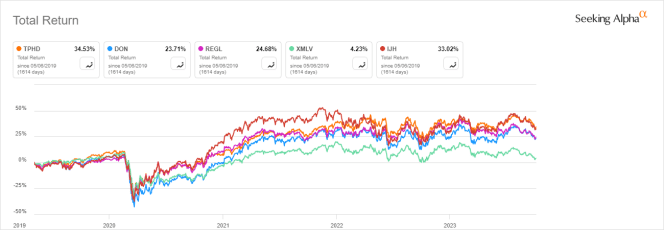
The next chart plots the total return since inception of TPHD, IJH, and three mid-cap competitors (two dividend ETFs and a low-vol ETF):
- WisdomTree U.S. MidCap Dividend Fund ETF ( DON ), reviewed here ,
- ProShares S&P MidCap 400 Dividend Aristocrats ETF ( REGL ), reviewed here ,
- Invesco S&P MidCap Low Volatility ETF ( XMLV ).
TPHD is the best performer and beats the benchmark by a short margin. The fund's price history is short: outperformance in this period may not be indicative of future returns.
TPHD vs. Competitors, since inception (Seeking Alpha)
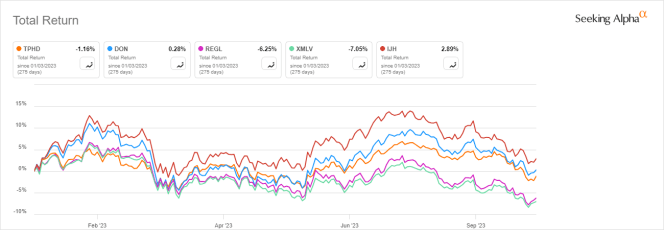
In 2023 to date, TPDH is in the middle of the pack:
TPHD vs. Competitors, year-to-date (Seeking Alpha)
The sum of annual distributions has increased by 19.4% from $0.62 to $0.74 per share between 2020 and 2022. It beats the cumulative inflation, about 14% based on CPI. However, IJH is far ahead with a 2-year dividend growth rate of 38%.
Portfolio valuation and quality
Valuation ratios are close to the mid-cap benchmark, as reported in the next table. Price/earnings and price/cash flow are a bit cheaper, while price/book and price/sales are slightly higher.
| TPHD |
| IJH |
| Price / Earnings TTM |
| 13.88 |
| 14.19 |
| Price / Book |
| 2.73 |
| 2.25 |
| Price / Sales |
| 1.53 |
| 1.22 |
| Price / Cash Flow |
| 9.75 |
| 10.14 |
In previous articles, I have shown how three factors may help cut the risk in a dividend portfolio: Return on Assets , Piotroski F-score , Altman Z-score . My core portfolio holds 14 stocks selected using these metrics (more info at the end of this post). I have scanned the proxy portfolio with these quality metrics. I consider that risky stocks are companies with at least 2 red flags among: bad Piotroski score, negative ROA, unsustainable payout ratio, bad or dubious Altman Z-score, excluding financials and real estate where these metrics are less relevant. With these assumptions, risky stocks weigh 12.9% of asset value. It is not very good, yet acceptable.
Based on my calculation of aggregate metrics reported in the next table, portfolio quality is slightly superior to the benchmark. Accounting scores are similar, and the ROA is significantly higher.
| TPHD |
| IJH |
| Altman Z-score |
| 3.1 |
| 3.06 |
| Piotroski F-score |
| 5.86 |
| 5.71 |
| ROA % TTM |
| 8.29 |
| 5.39 |
Takeaway
Timothy Plan High Dividend Stock ETF selects 100 dividend stocks with screens based on religious morality, and weights them based on volatility. Constituents are mostly mid-cap stocks with industrials, utilities and energy appearing as top sectors. The high dividend denomination is questionable for a 2.4% yield, and the expense ratio is higher than peers. Aggregate valuation metrics are similar to a mid-cap benchmark, and quality is a bit better. Total return has been above close competitors in the last 4 years, and it is on par with the mid-cap benchmark. Whatever the moral relevancy of the strategy, a longer track record is needed to assess its financial efficiency.
For further details see:
TPHD: A Dividend ETF With Biblical Aspirations