TCLCF - Transcontinental: A Fully Covered 6% Yield In The Packaging And Printing Sector
Summary
- Transcontinental is a major producer of flexible (plastic) packaging and the largest printing company in Canada.
- The entity is doing pretty well and the cash flows are strong.
- The dividend of C$0.90 on an annual basis is fully covered by both the earnings and the free cash flow.
- The management indicated capex will start to trend down from next year on, which will emphasize the free cash flow even more.
Introduction
Transcontinental ( TCL.A:CA ) ( TCL.B:CA ) ( TCLAF ) is the holding company of TC Transcontinental which focuses on the packaging and printing industry. That makes it difficult to value the company as we shouldn’t look at Transcontinental as a pure packaging nor as a pure printing company. The combination seems to work as Transcontinental reports relatively strong earnings and free cash flow results.
As Transcontinental’s financial year ends in October, the company recently released its FY 2022 results and the timing to have a look under the good couldn’t be better. The company currently has two share classes: as of the end of October there were 72.7M A-shares and 13.9M B-shares outstanding for a combined 86.6M shares. Both classes have equal economic rights but the B shares have 20 votes per share while the A-shares just have one vote per share. As I’m only interested in Transcontinental from an investment perspective I will refer to the A-shares in this article. The share prices of both classes are very similar, but the liquidity is much better for the A-shares.
The FY 2022 results were encouraging
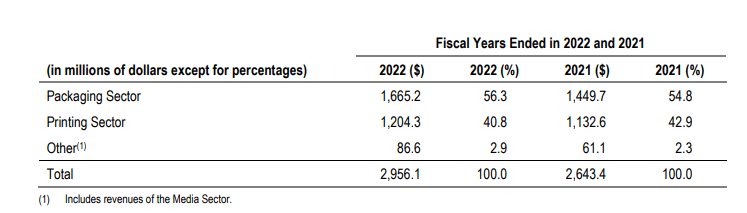
Transcontinental is very active in two divisions which represent 97% of the revenue. The packaging sector represents about 56% of the FY 2022 revenue while the printing division saw its revenue increase although at a slower pace, generating just over 40% of the consolidated revenue.
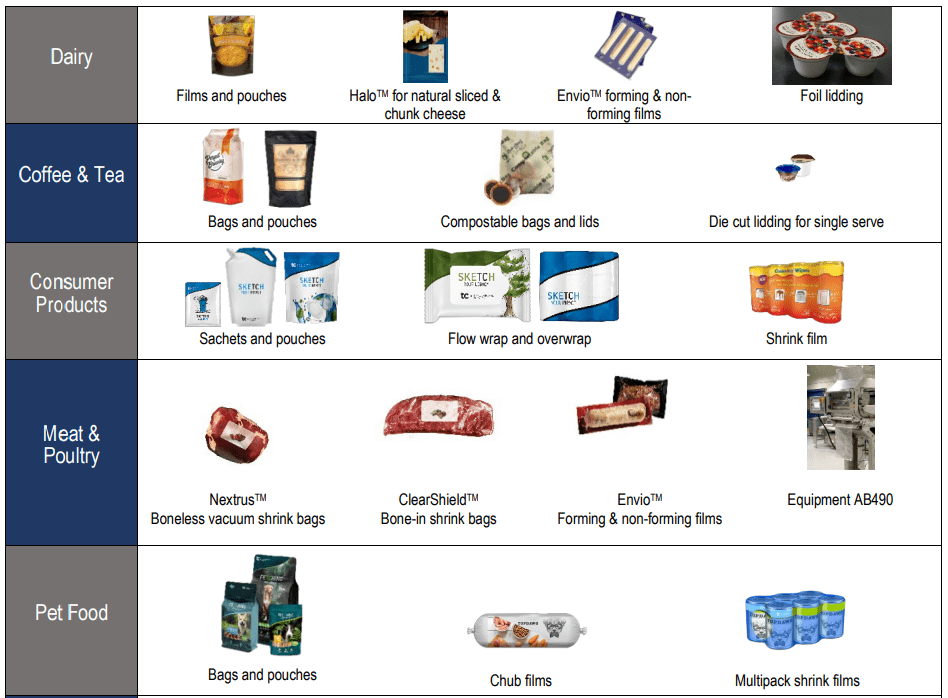
In the packaging sector, Transcontinental is focusing on flexible packaging products including plastic bags, shrink films and pouches.
One of Transcontinental’s main arguments to focus on these flexible packaging solutions is the ‘green aspect’: the production costs are lower, there are fewer inputs and it’s easier to handle. According to the company’s own data a rigid PET container emits about 8 times more greenhouse gases than a flexible pouch with a zipper during the production and transportation process.
The printing division is interesting as well. Transcontinental actually is the largest printer in Canada focusing on the books, magazine and newspaper markets. Surprisingly, this also is the highest margin division of Transcontinental. As you can see below, Transcontinental generated about C$171M in operating earnings on the C$1.2B revenue. That’s more than 200% higher than the operating earnings from the packaging division, where the operating margin was just 3% (versus in excess of 14% in the printing division).
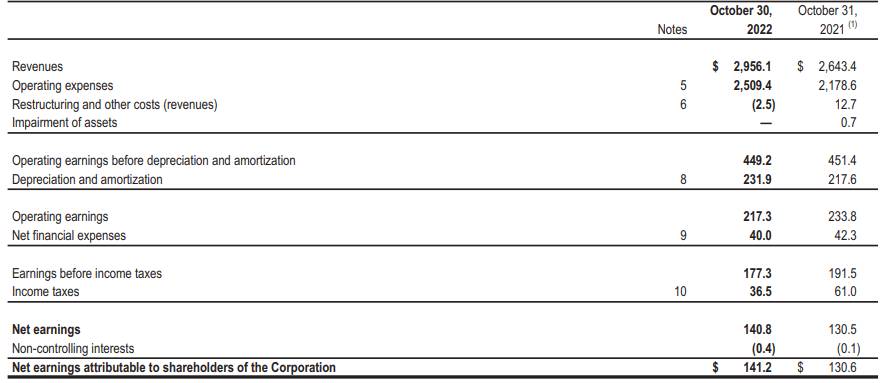
On a consolidated basis, the total revenue came in at C$2.96B which allowed the company to report an EBITDA of C$449M. The EBITDA result was in line with the FY 2021 result in absolute numbers but as the revenue increased in FY 2022, the margins were coming under pressure (and additional pricing action will be needed).
This doesn’t mean 2022 was a bad year. The operating income (read: EBIT) came in at c$217M and with a net income of C$141M, the EPS was C$1.63, an increase of approximately 8% compared to FY 2021. This was mainly due to the higher tax bill in FY 2021 as some of the restructuring expenses were non-deductible. As you can see below this (in combination with the adjustment for previous years) explains pretty much the entire difference in the tax bill.
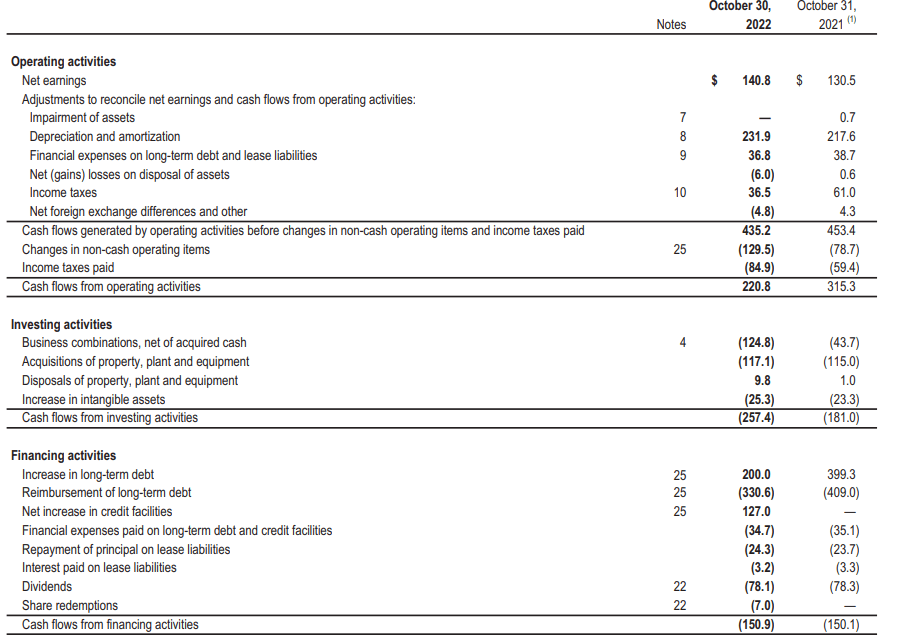
Fortunately the company’s cash flows remain very strong. As you can see below, the reported operating cash flow was C$221M but this includes a C$130M investment in working capital elements, but it also includes a C$85M cash tax payment although only C$36.5M was due based on the FY 2022 income statement.
We should also still deduct the C$38M in interest expenses (on debt and lease liabilities) and deduct the C$24M in lease payments. After making all these adjustments, the operating cash flow was a very robust C$337M (compared to C$331M in FY 2021). The total capex was approximately C$142M (including the investments in intangibles) which means the underlying free cash flow result was approximately C$195M or C$2.25 per share. That’s higher than the reported net income as the total amount of depreciation and amortization expenses (C$232M) is substantially higher than the current sustaining capex (C$166M, including lease payments).
As of the end of October, Transcontinental had C$46M in cash C$11M in short-term debt and C$979M in long-term debt for a total net debt of just under C$945M (excluding lease liabilities). Considering the EBITDA including lease amortization was C$449M and about C$425M excluding the lease amortization, the debt ratio is just over 2 and that’s fine.
This also means the current dividend of C$0.90 per share is very well covered (both by earnings as well as by the underlying free cash flow). And considering the current share price trades below C$15 per share, the dividend yield exceeds 6%.
Keep in mind the total capex includes growth investments. That was confirmed on the Q4 call where the Transcontinental management promised the capex level will decrease again from FY 2024 on (the emphasis is mine).
In terms of profitability, we expect lower adjusted EBITDA from the impact of inflation on volume and cost structure. We expect corporate cost at the EBITDA level to be around $40 million for the year. In terms of capital allocation, we expect CapEx in fiscal year 2023 to remain in line with 2022 at around $140 million as w e continue our strategic investments before returning to a lower run rate in fiscal 2024 . As far cash taxes, it should be around $60 million.
Investment thesis
In FY 2023, Transcontinental expects an increasing EBITDA in the packaging division but a lower EBITDA in the printing division as it is hit harder by the impact of inflation. With two very different business divisions, it’s not easy to figure out how to value Transcontinental.
Right now, the consolidated entity has an enterprise value of C$2.25B which, given the underlying EBITDA excluding lease payments of C$425M represents a multiple of just over 5. Even if the EBITDA would slightly decrease this year, the stock is still trading at just 5.5 times EBITDA. This, in combination with a strong free cash flow result and generous dividend, makes Transcontinental pretty attractive. Additionally, management has made it clear debt repayment is being prioritized to avoid being hit too hard by increasing interest rates.
The share price has been pretty stable in the past few months so perhaps this means the stock is bottoming out. I currently have no position in Transcontinental but I am watching with interest.
For further details see:
Transcontinental: A Fully Covered 6% Yield In The Packaging And Printing Sector