VAL - Transocean: A Great Trading Tool But Not Much More
2023-06-14 14:09:38 ET
Summary
- Transocean Ltd. revenues in Q1 2023 were $649 million, up from $586 million in Q1 2022, an increase of 10.8%.
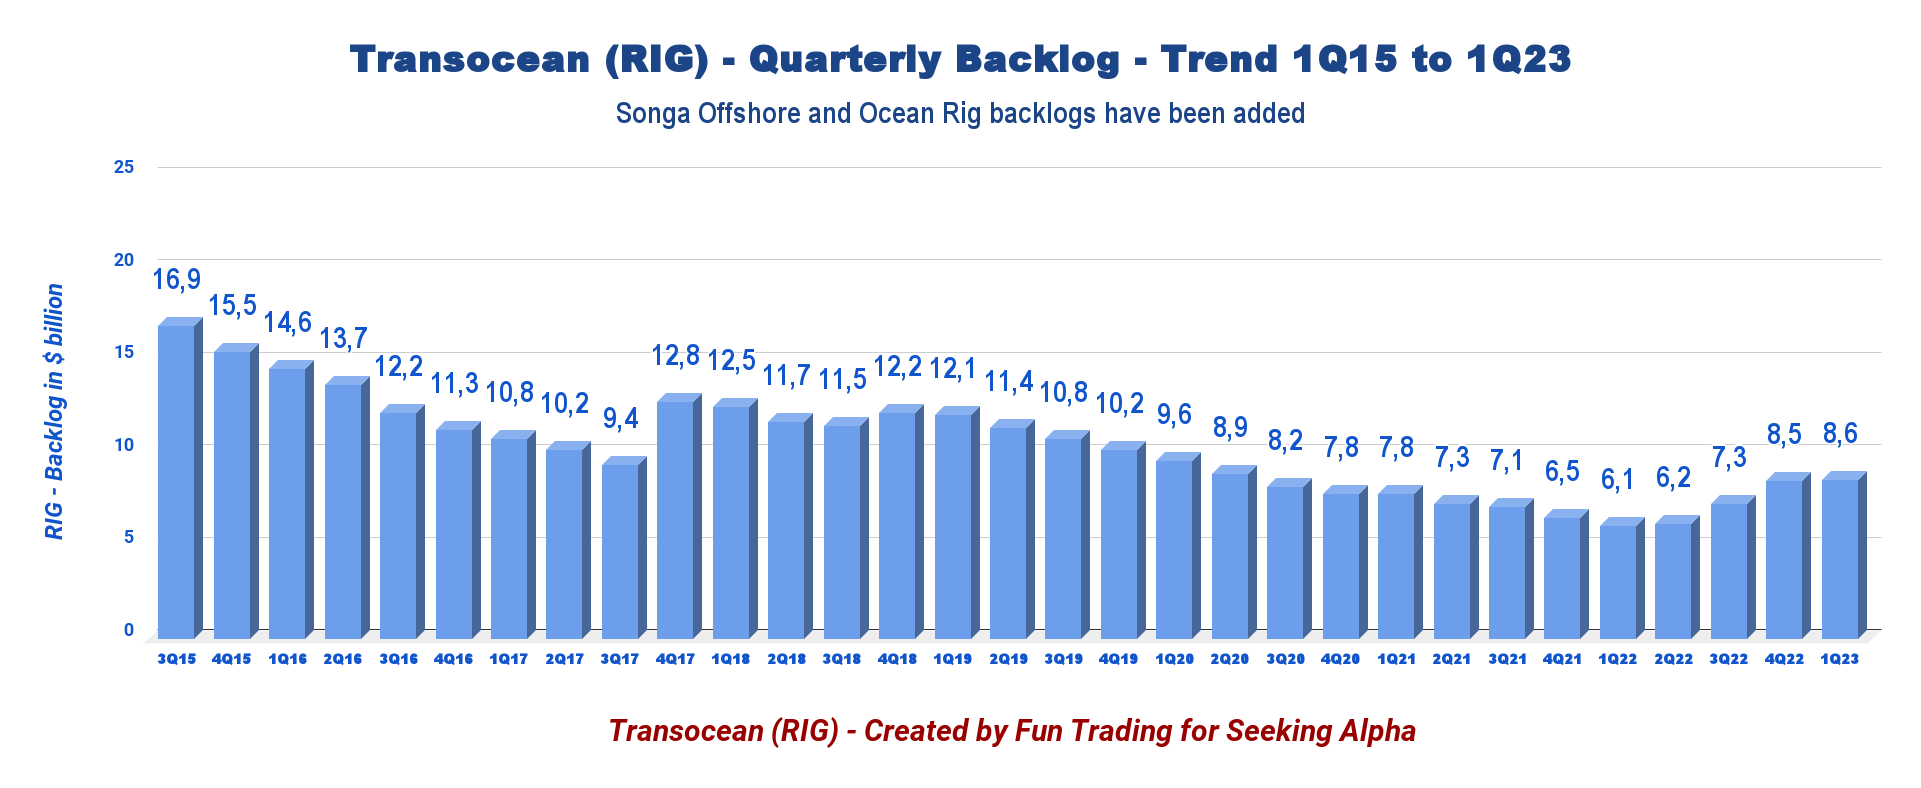
- The backlog increased significantly in the past few quarters and is now $8.6 billion as of April 18, 2023.
- I recommend buying Transocean stock between $5.75 and $5.45 to accumulate again, with possible lower support at $5.00.
Introduction
Transocean Ltd. (RIG) released its first quarter 2023 results on May 1, 2023.
Also, Transocean published its last fleet Status Report on April 19, 2023. The contract backlog was $8.6 billion as of the April 2023 Fleet Status Report.
Note: I have followed RIG quarterly since 2014. This new article updates my article published on April 18, 2023.
Since then, on May 10, 2023, Transocean announced that (emphasis added):
Transocean Equinox was awarded a five-well contract in Australia by a major operator, representing approximately $137 million in firm backlog, excluding full payment for mobilization and a demobilization fee. The estimated 300-day contract is expected to commence in the first quarter of 2024. The contract also provides for a one-well option, potentially keeping the harsh environment semisubmersible in Australia through the first quarter of 2025.
1 - 1Q23 results snapshot
Transocean came out with a disappointing quarterly loss of $465 million, or $0.64 per share, compared to a loss of $0.26 a year ago. The adjusted loss was $0.38 per share. The results were below analysts' expectations.
Transocean's disappointing performance this quarter was due to a weaker result from Harsh Environment floaters.
Cash from operations was a loss of $47 million, and quarterly free cash flow was a loss of $128 million in 1Q23.
Operating and maintenance expense was $409 million, compared to $412 million in the prior period.
The backlog has dropped continuously despite two acquisitions (Songa Offshore and Ocean Rig) and has reached a rock bottom of $6.1 billion in 1Q22.
However, the company is now turning around, and contracts are finally showing duration and daily rate improvements. The backlog is now $8.6 billion as of April 18, 2023.
Below is the backlog history since 2015.
RIG Quarterly Backlog History (Fun Trading)
However, it seems that Q1 2023 is showing a top, and we may see some downside again. So far, new contracts announced after April 18 totaled only $137 million, far below the replacement rate.
Transocean's Ultra-deepwater floater revenues represent 74.7% of contract drilling revenues ($485 million). Harsh Environment floaters accounted for the remaining 25.4% ($165 million). This is compared with the year-ago quarter’s reported figures of $390 million and $196 million.
Transocean owns or has partial ownership interests in and operates a fleet of 37 mobile offshore drilling units, consisting of 27 ultra-deepwater floaters and 10 harsh environment floaters. In addition, Transocean is constructing one ultra-deepwater drillship and holds a noncontrolling ownership interest in a company that is constructing one ultra-deepwater drillship.(FSR April 18)
CFO Mark Mey said in the conference call:
Cash flow from operations was a negative $47 million resulting from lower collections from customers reflective of reduced revenue due to certain rigs completing their contracts during the previous quarter, disbursements incurred preparing several rigs for our next contracts and the timing of tax and interest payments.
2 - Investment thesis
I have followed Transocean for nearly a decade on Seeking Alpha, and I have determined that the company will always struggle due to the unpredictable and costly nature of the offshore business.
Transocean is a decent company, but it cannot generate sufficient cash flow despite the significant increase in business recently. As I have said numerous times, the business model attached to offshore drillers is fundamentally flawed due to the excessive CapEx requirement, the cost of doing business, and the expected low-profit margin compared to the risk.
Regarding the investment thesis, it is nearly impossible to recommend RIG as a long-term potential. The company is highly indebted and has generated recurring losses in free cash flow for as far as I remember. Also, the company is not paying a dividend.
Thus, RIG is not suited for every investor's portfolio but fits only a special kind of trader looking for high-risk/reward potential. With the right trading LIFO strategy, you can profit handsomely and avoid sleepless nights while growing a nice recurring gain that you can use to build a long position risk-free.
Therefore, I suggest short-term trading LIFO, about 80%-85% of your RIG position, and keeping only a tiny long-term core position for an eventual higher target.
This dual strategy entitles you to take full advantage of the offshore drilling sector's high volatility and inherent cyclicity. It is what I suggest in my marketplace, "The Gold and Oil Corner."
3 - Stock performance
Transocean has significantly underperformed Valaris Limited ( VAL ) on a one-year basis. RIG is now up 2% on a one-year basis.
4 - Average day rates and utilization for 1Q23
The first quarter average day rate increased to $364.1k/d from the year-ago level of $334.5k/d, up 8.8%. However, the average daily rate increased more sequentially, which is encouraging. Utilization slightly raised from the same quarter a year ago and reached 51.9%.
| Day rates |
| 1Q22 |
| 2Q22 |
| 3Q22 |
| 4Q22 |
| 1Q23 |
| The average daily rate is /d |
| 334.5 |
| 358.1 |
| 343.4 |
| 348.6 |
| 364.1 |
| Average Utilization |
| 52.7% |
| 58.2% |
| 59.4% |
| 49.4% |
| 51.9% |
Transocean - 1Q23 and Selected Financials History - The Raw Numbers
| Transocean |
| 1Q22 |
| 2Q22 |
| 3Q22 |
| 4Q22 |
| 1Q23 |
| Total contract drilling in $ Billion |
| 0.586 |
| 0.692 |
| 0.691 |
| 0.606 |
| 0.649 |
| Net Income in $ Million |
| -175 |
| -68 |
| -28 |
| -350 |
| -465 |
| EBITDA $ Million |
| 165 |
| 249 |
| 284 |
| 153 |
| 35 |
| EPS diluted in $/share |
| -0.26 |
| -0.10 |
| -0.04 |
| -0.50 |
| -0.64 |
| Cash from operating activities in $ Million |
| -1 |
| 41 |
| 230 |
| 178 |
| -47 |
| Capital Expenditure in $ Million |
| 106 |
| 115 |
| 87 |
| 409 |
| 81 |
| Free Cash Flow in $ Million |
| -107 |
| -74 |
| 143 |
| -231 |
| -128 |
| Cash and short-term investments $ Billion |
| 0.911 |
| 0.729 |
| 0.954 |
| 0.683 |
| 0.747 |
| Long-term debt in $ Billion (including current) |
| 7.011 |
| 7.223 |
| 7.201 |
| 7.347 |
| 7.625 |
| Shares outstanding (diluted) in Million |
| 664 |
| 692 |
| 714 |
| 726 |
| 728 |
| Backlog |
| 1Q22 |
| 2Q22 |
| 3Q22 |
| 4Q22 |
| 1Q23 |
| RIG Backlog in $ billion |
| 6.1 |
| 6.2 |
| 7.3 |
| 8.5 |
| 8.6 |
Source: press release .
* Estimated by Fun Trading.
Analysis: Revenues, Earnings Details, Free Cash Flow, and Net Debt
1 - The company posted quarterly revenues of $649 million in 1Q23
Note: The total adjusted contract drilling revenues were $667 million, from $730 million in 3Q22.
Note: RIG had $18 million in contract intangible assets amortization.
RIG Quarterly Revenue History (Fun Trading)
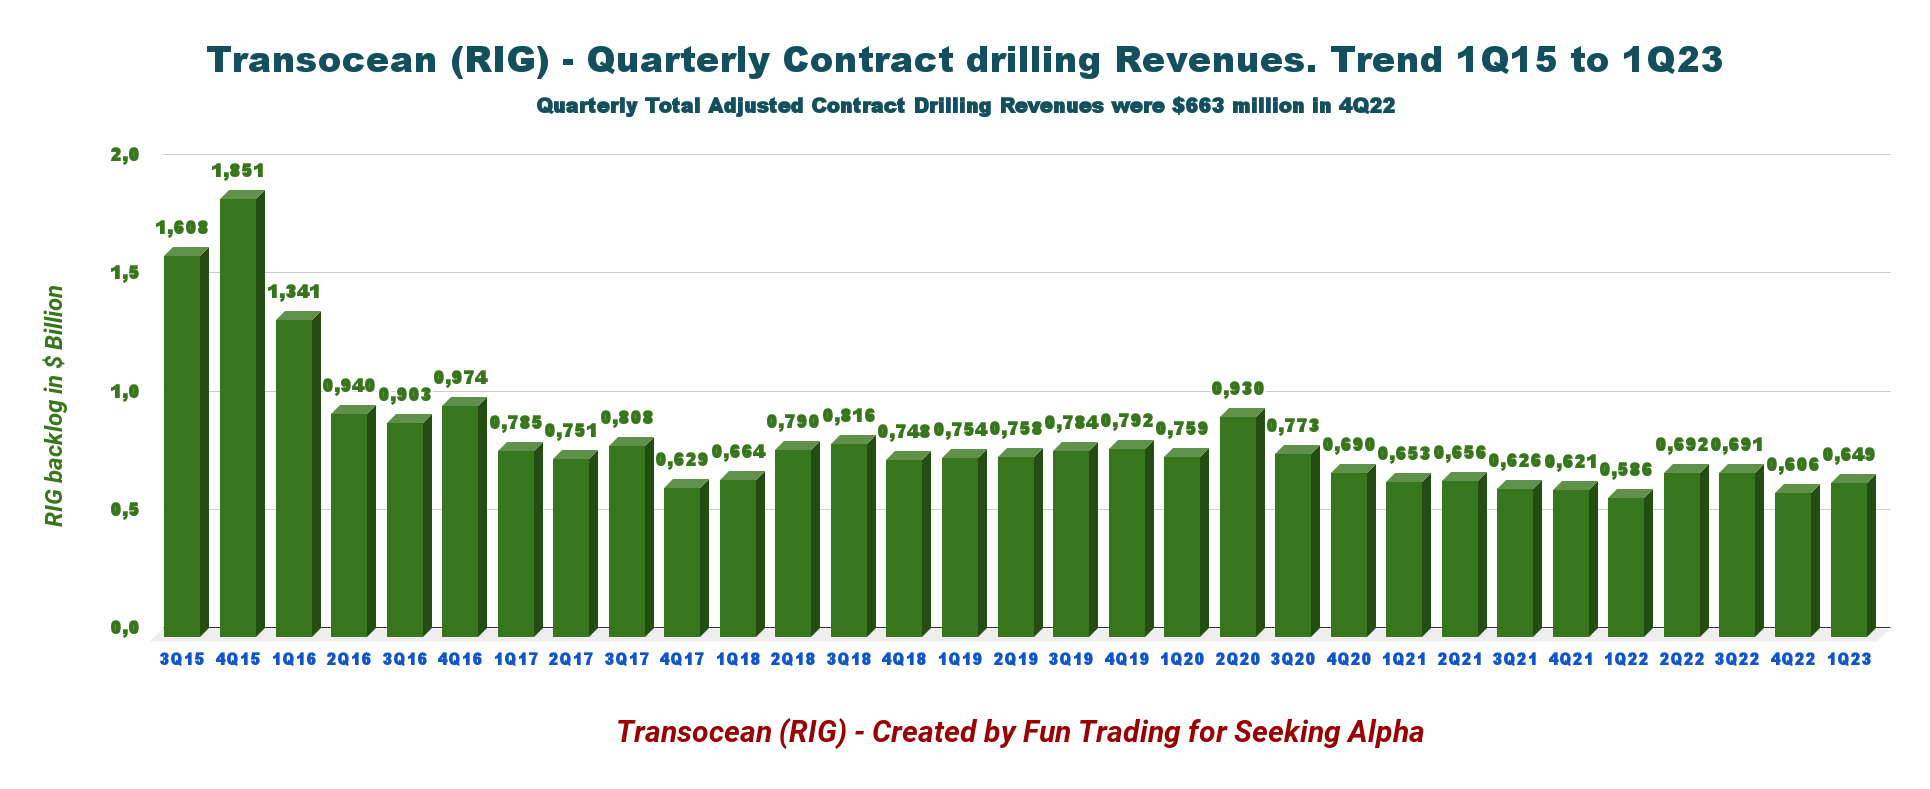
Transocean's revenues in 1Q23 were $649 million , up from $586 million in 1Q22, an increase of 10.8%. Total adjusted contract drilling revenues were $667 million in 1Q23. Revenue efficiency was high this quarter at 97.8%, compared to 98.0% in the prior quarter.
The net loss in the first quarter of 2023 was $465 million or $0.64 per diluted share.
The adjusted EBITDA was $217 million this quarter.
Contract drilling revenues for the three months ended March 31, 2023, increased sequentially by $43 million to $649 million, primarily due to increased activity for rigs that returned to work after being idle in the fourth quarter and increased dayrate for two rigs, partially offset by two fewer calendar days in the first quarter.
CEO Jeremy Thigpen said in the conference call:
During the quarter, we booked nearly $900 million of contract backlog, disrupting the first quarter low observed in years past. In fact, this is more than double the backlog added in the first quarter of 2022 and more than seven times what we added in the first quarter of 2021. We believe this is another clear indication of the sustainability of this constructive market environment, particularly in light of the record backlog we booked last year.
I am always amazed by the optimism demonstrated by CEO Jeremy Thigpen, which contrasts with the recurring and disappointing quarterly results that we have experienced in the past ten most recent quarters, with the net "income" turning to a staggering loss. Hopefully, this disappointing trend will change in 2Q23.
2 - Free cash flow was a loss of $128 million in 1Q23
RIG Quarterly Free Cash Flow History (Fun Trading)
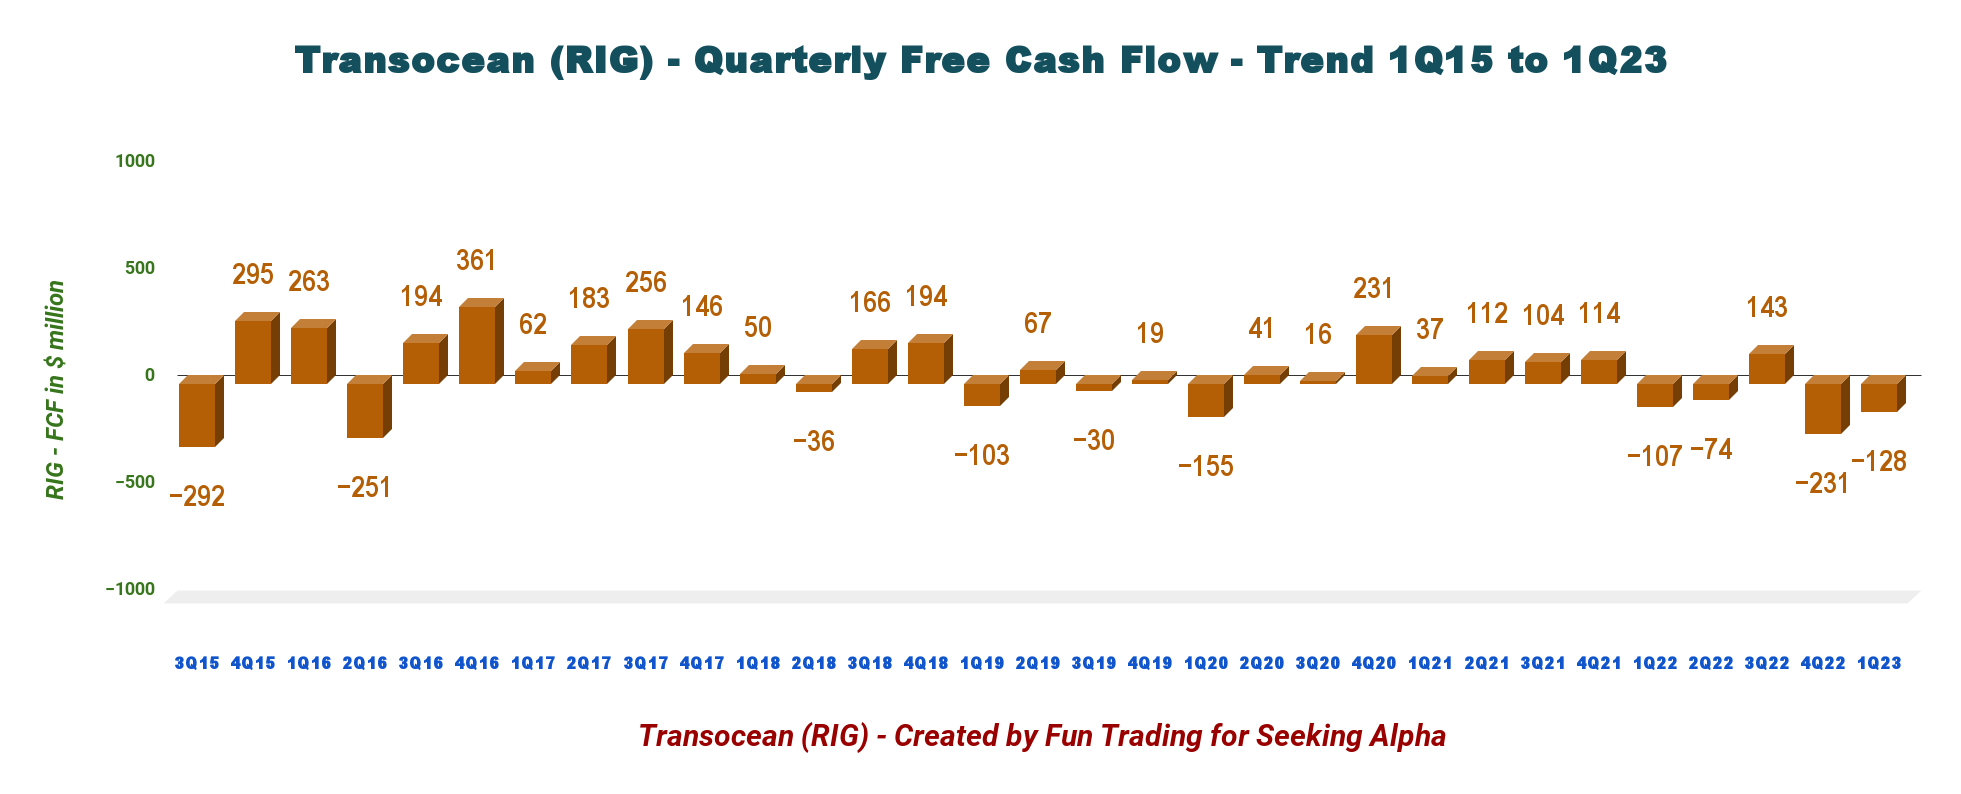
Important Note: The generic free cash flow is the cash from operating activities minus CapEx.
The cash from operations was a loss of $47 million in 1Q23, while CapEx dropped to $81 million from $409 million in the preceding quarter. RIG had a free cash flow loss of $128 million in 1Q23. Trailing 12-month free cash flow loss was $290 million.
CFO Mark Mey said in the conference call:
Our free cash flow of negative $128 million in the first quarter reflects the contract preparations above and $81 million of capital expenditures, which were largely related to our eighth generation drill strips the Deepwater Atlas and Deepwater Titan.
3 - Net debt (gross debt minus total cash) increased again sequentially to $6.878 billion in 1Q23
RIG Quarterly Cash versus Debt History (Fun Trading)
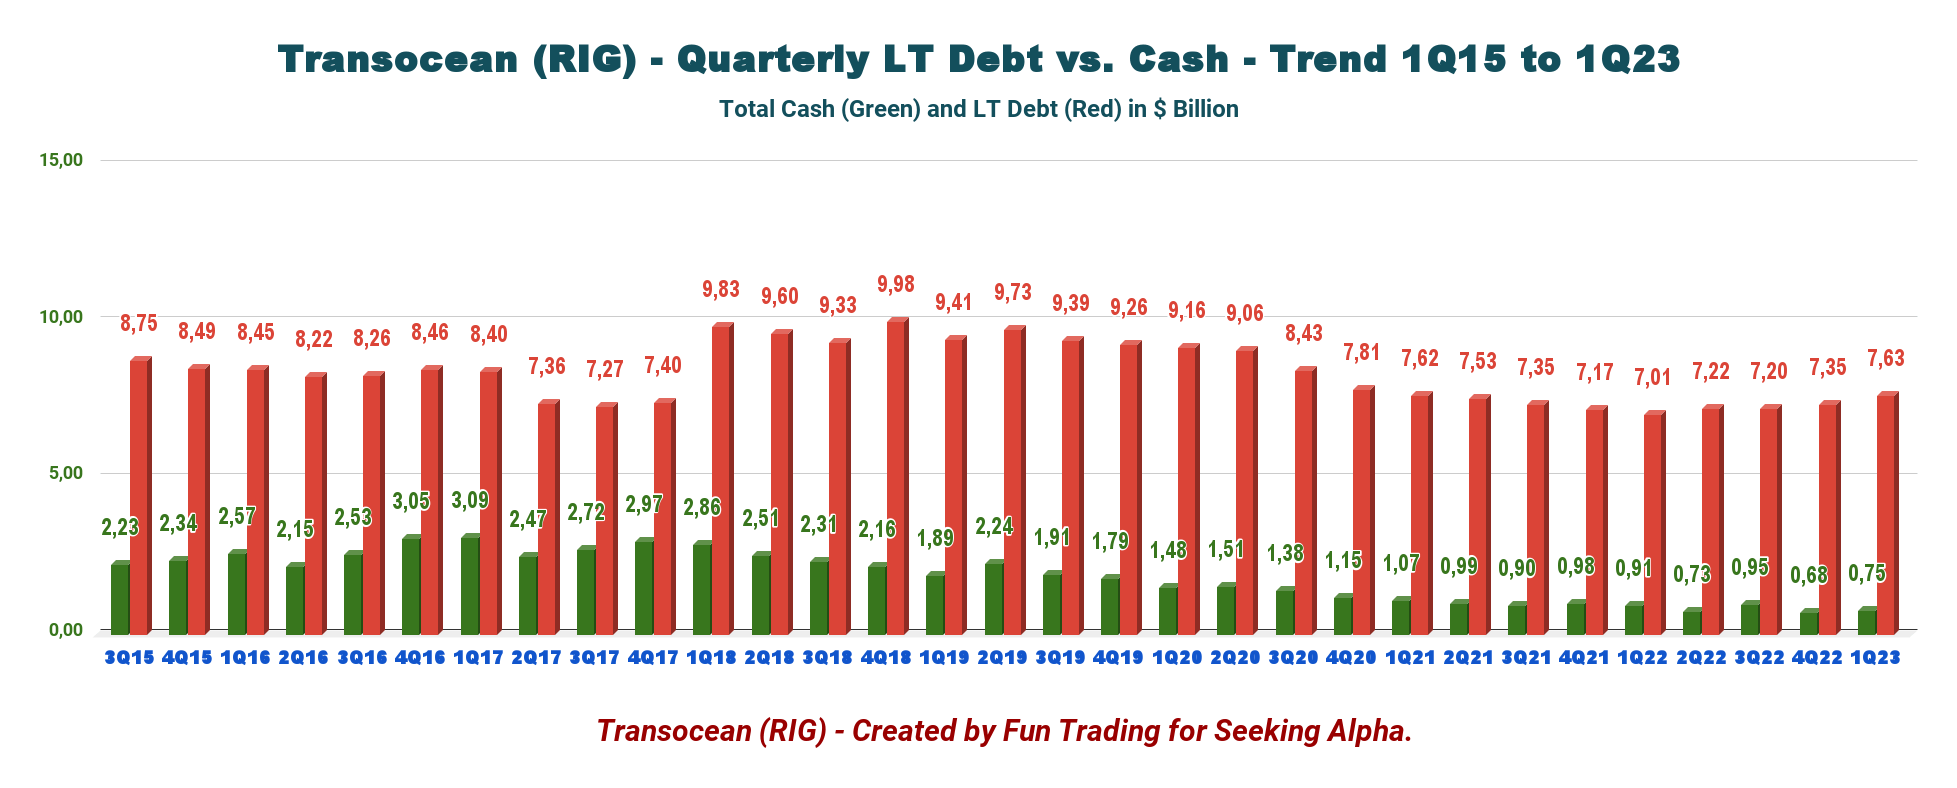
Net debt is about $6.88 billion as of March 31, 2023, compared to $6.10 billion in the same quarter a year ago. Total liabilities, including current, were $9.87 Billion in March 2023 compared with $9.64 billion in 4Q22.
However, the total cash was $747 million, up sequentially (please see the chart above).
The shares outstanding diluted for 1Q23 jumped to 728 million shares, up 9.6% on a one-year basis.
CFO Mark Mey said in the conference call:
We ended the first quarter with total liquidity of approximately $1.7 billion including unrestricted cash and cash equivalents of approximately $747 million approximately $175 million of restricted cash for debt service and $774 million from an undrawn revolving credit facility.
4 - 2Q23 and 2023 guidance
- For the second quarter of 2023, Transocean expects adjusted contract drilling revenues of $735 million, with O&M expenses of around $460 million . Some progress is anticipated in 2Q23 compared to 1Q23. The company is indicating an increase of 10% QoQ. Unfortunately, the CapEx increase may eat much of the benefits.
- RIG indicated net interest expenses for the second quarter between $118 million and $479 million.
- Finally, CapEx is estimated at $100 million , which includes $70 million related to new builds and $30 million for maintenance capex in the second quarter.
- For FY23, the company forecasts O&M expenses of $1.9 billion and expects adjusted contract revenues between $2.9 and $3 billion.
CFO Mark Mey said in the conference call:
This quarter-over-quarter increase is primarily attributable to a full quarter of utilization of the Transocean Barents and DD3, we started contracts in the prior quarter and the contract commencement of the Deepwater Titan and Transocean Norge during the second quarter, partially offset by in between contract auto [ph] time were Transocean Endurance in Norway.
Technical Analysis and Commentary
RIG TA Chart Short-Term (Fun Trading StockCharts)
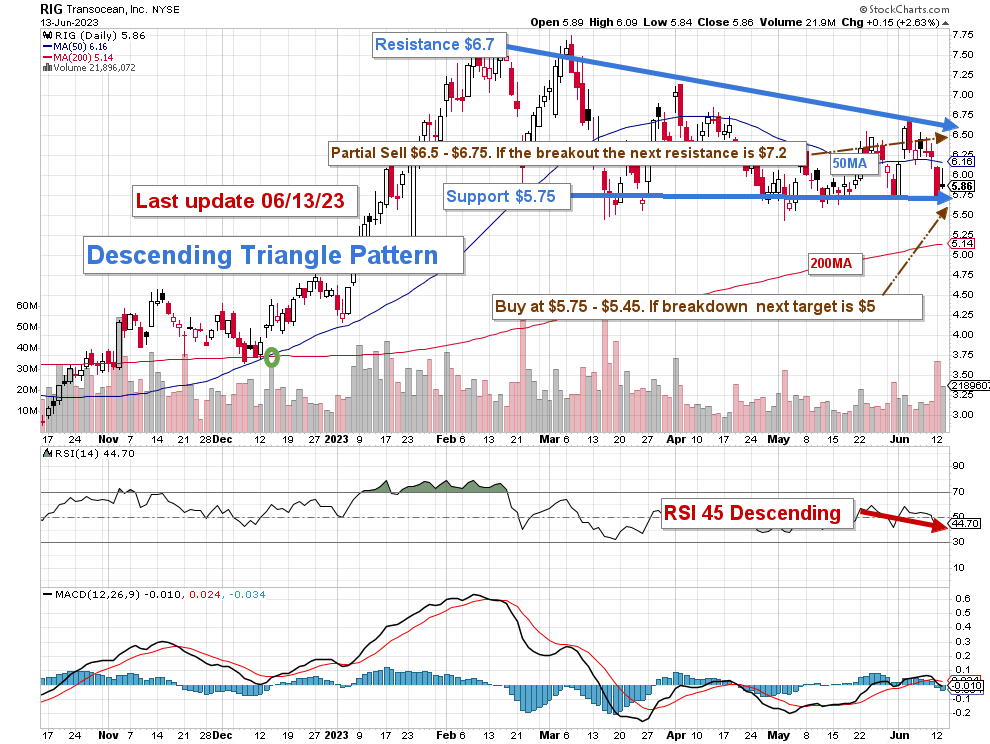
RIG forms a descending triangle pattern, with resistance at $6.7 and support at $5.75.
The descending triangle is a bearish formation that usually forms during a downtrend as a continuation pattern. There are instances when descending triangles form as reversal patterns at the end of an uptrend, but they are typically continuation patterns.
I recommend keeping a tiny long-term Transocean Ltd. position and using about 80%-85% to trade LIFO while waiting for a higher final price target for your core position between $7 and $8.
In my preceding article, I indicated that I sold my long-term position at $7.10 and have traded RIG short-term since then. This strategy has not changed, and I have done especially great playing the waves based on oil and gas price fluctuations. Thus, despite a weak and concerning balance sheet , I recommend RIG as an excellent trading vehicle.
I suggest selling ~40% between $6.50 and $6.75 and another 40% above $7.20. I recommend waiting for a retracement between $5.75 and $5.45 to accumulate again, with possible lower support at $5.00 if support cannot hold.
Warning: The TA chart must be updated frequently to be relevant. It is what I am doing in my stock tracker. The chart above has a possible validity of about a week. Remember, the TA chart is a tool only to help you adopt the right strategy. It is not a way to foresee the future. No one and nothing can.
For further details see:
Transocean: A Great Trading Tool, But Not Much More