VAL - Transocean Ltd.: Not Much Left To Expand
2023-04-18 19:31:32 ET
Summary
- Transocean Ltd. revenues in Q4 2022 dropped to $606 million from $621 million in 4Q21, a decrease of 2.4%.
- As of February 9, the company’s total backlog is approximately $8.5 billion.
- For the first quarter of 2023, Transocean Ltd. expects adjusted contract drilling revenue of $635 million.
- I recommend accumulating Transocean shares between $5.75 and $5.50 to accumulate again, with possible lower support at $4.60.
Introduction
Transocean Ltd. ( RIG ) released its fourth quarter 2022 results on February 21, 2023. The company is expected to report its Q1 earnings on May 1 post-market.
Also, Transocean published its last fleet Status Report on February 09, 2023.
Note: I have followed RIG quarterly since 2014. This new article is a quarterly update of my article published on December 8, 2022. The company indicated (emphasis added):
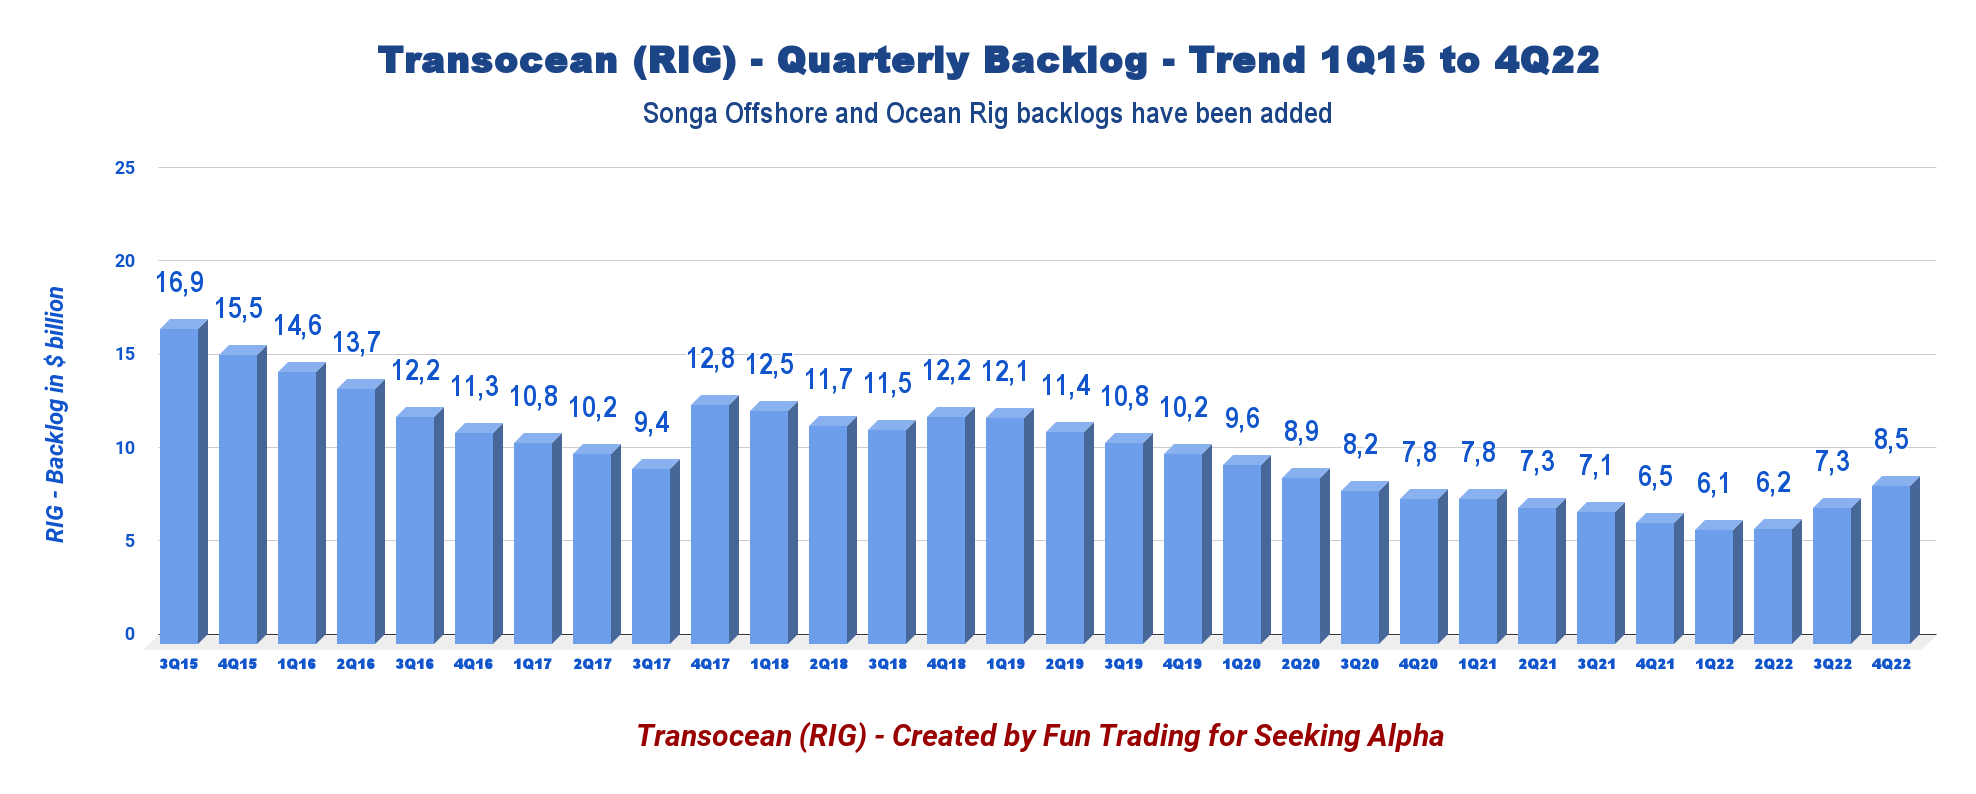
The aggregate incremental backlog associated with these fixtures is approximately $1.9 billion. As of February 9, the company's total backlog is approximately $8.5 billion .
Since then, on March 28, 2023, Transocean announced contract awards for two of its harsh environment semisubmersibles. Together, the awards represent approximately $382 million in the firm contract backlog.
On March 29, 2023, Transocean announced contract fixtures for two of its harsh environment semisubmersibles. The awards represent approximately $113 million in the firm contract backlog.
1 - 4Q22 and full-year 2022 results snapshot
Transocean came out with a disappointing quarterly loss of $350 million, or $0.50 per share, compared to a loss of $0.40 a year ago. Transocean's underperformance this quarter was due to a revenue decline from contract drilling.
Cash from operations was $178 million, and quarterly free cash flow was a loss of $231 million in 4Q22.
Operating and maintenance expense was $423 million, compared to $411 million in the prior period.
The backlog has dropped continuously despite two acquisitions (Songa Offshore and Ocean Rig) and has reached a rock bottom of $6.1 billion in 1Q22. The company is now turning around, and contracts are finally showing duration and daily rate improvements. Below is the backlog history since 2015.
RIG Quarterly Backlog History (Fun Trading)
Transocean's Ultra-deepwater floater revenues represent 71.6% of contract drilling revenues, while Harsh Environment floaters accounted for the remaining 28.4%.
Transocean owns or has partial ownership interests in and operates a fleet of 37 mobile offshore drilling units, consisting of 27 ultra-deepwater floaters and 10 harsh environment floaters. In addition, Transocean is constructing one ultra-deepwater drillship and holds a noncontrolling ownership interest in a company that is constructing one ultra-deepwater drillship.
During 4Q22, revenues from the Ultra-deepwater and HE floaters are $434 million and $172 million, from $433 million and $258 million in 3Q22.
CFO Mark Mey said in the conference call:
For the first quarter 2023, we expect adjusted contract drilling revenue of $635 million based upon an average fleet quired revenue efficiency of 96.5%. This is slightly higher than the fourth quarter of 2022, largely due to increased activity on certain rigs partially offset by fewer operating days to quarter.
2 - Investment thesis
I have followed Transocean for nearly a decade on Seeking Alpha and accept that the company will always struggle due to the nature of the offshore business.
Transocean is a decent company, but it is dealing with a weak business environment even if it offers a better outlook. The business model attached to offshore drillers is fundamentally flawed due to the excessive CapEx requirement, the cost of doing business, and the expected low-profit margin.
Thus, Transocean's balance sheet oscillates between near-bankruptcy status and barely above the water when business turns more favorable.
Thus, RIG is not suited for every investor's portfolio, but fits only a special kind of trader looking for high-risk/reward potential. With the right trading strategy, you can profit significantly from the volatility and the weaknesses.
Therefore, I suggest short-term trading LIFO, about 60%-80% of your RIG position, and keeping only a tiny long-term core position for a higher target.
This dual strategy entitles you to take full advantage of the offshore drilling sector's high volatility and inherent cyclicity. It is what I recommend in my marketplace, "The Gold and Oil Corner."
3 - Stock performance
Transocean has significantly underperformed Valaris Ltd. (VAL) on a one-year basis. However, RIG is now up 43% on a one-year basis.
4 - Average day rates and utilization for 4Q22
The fourth quarter average day rate increased to $348.6k/d from the year-ago level of $352.5k/d. However, the average daily rate increased more sequentially, which is encouraging. Utilization dropped from the same quarter a year ago and reached 49.4%.
| Day rates |
| 4Q21 |
| 1Q22 |
| 2Q22 |
| 3Q22 |
| 4Q22 |
| The average daily rate is /d |
| 352.5 |
| 334.5 |
| 358.1 |
| 343.4 |
| 348.6 |
| Average Utilization |
| 53.4% |
| 52.7% |
| 58.2% |
| 59.4% |
| 49.4% |
Transocean - 4Q22 and Selected Financials History - The Raw Numbers
| Transocean |
| 4Q21 |
| 1Q22 |
| 2Q22 |
| 3Q22 |
| 4Q22 |
| Total contract drilling in $ Billion |
| 0.621 |
| 0.586 |
| 0.692 |
| 0.691 |
| 0.606 |
| Net Income in $ Million |
| -260 |
| -175 |
| -68 |
| -28 |
| -350 |
| EBITDA $ Million |
| 192 |
| 165 |
| 249 |
| 284 |
| 153 |
| EPS diluted in $/share |
| -0.40 |
| -0.26 |
| -0.10 |
| -0.04 |
| -0.50 |
| Cash from operating activities in $ Million |
| 185 |
| -1 |
| 41 |
| 230 |
| 178 |
| Capital Expenditure in $ Million |
| 71 |
| 106 |
| 115 |
| 87 |
| 409 |
| Free Cash Flow in $ Million |
| 114 |
| -107 |
| -74 |
| 143 |
| -231 |
| Cash and short-term investments $ Billion |
| 0.976 |
| 0.911 |
| 0.729 |
| 0.954 |
| 0.683 |
| Long-term debt in $ Billion (including current) |
| 7.170 |
| 7.011 |
| 7.223 |
| 7.201 |
| 7.347 |
| Shares outstanding (diluted) in Million |
| 658 |
| 664 |
| 692 |
| 714 |
| 726 |
| Backlog |
| 4Q21 |
| 1Q22 |
| 2Q22 |
| 3Q22 |
| 4Q22 |
| RIG Backlog in $ billion |
| 6.5 |
| 6.1 |
| 6.2 |
| 7.3 |
| 8.5 |
Source: press release .
* Estimated by Fun Trading.
Analysis: Revenues, Earnings Details, Free Cash Flow, and Net Debt
1 - The company posted quarterly revenues of $606 million in 4Q22
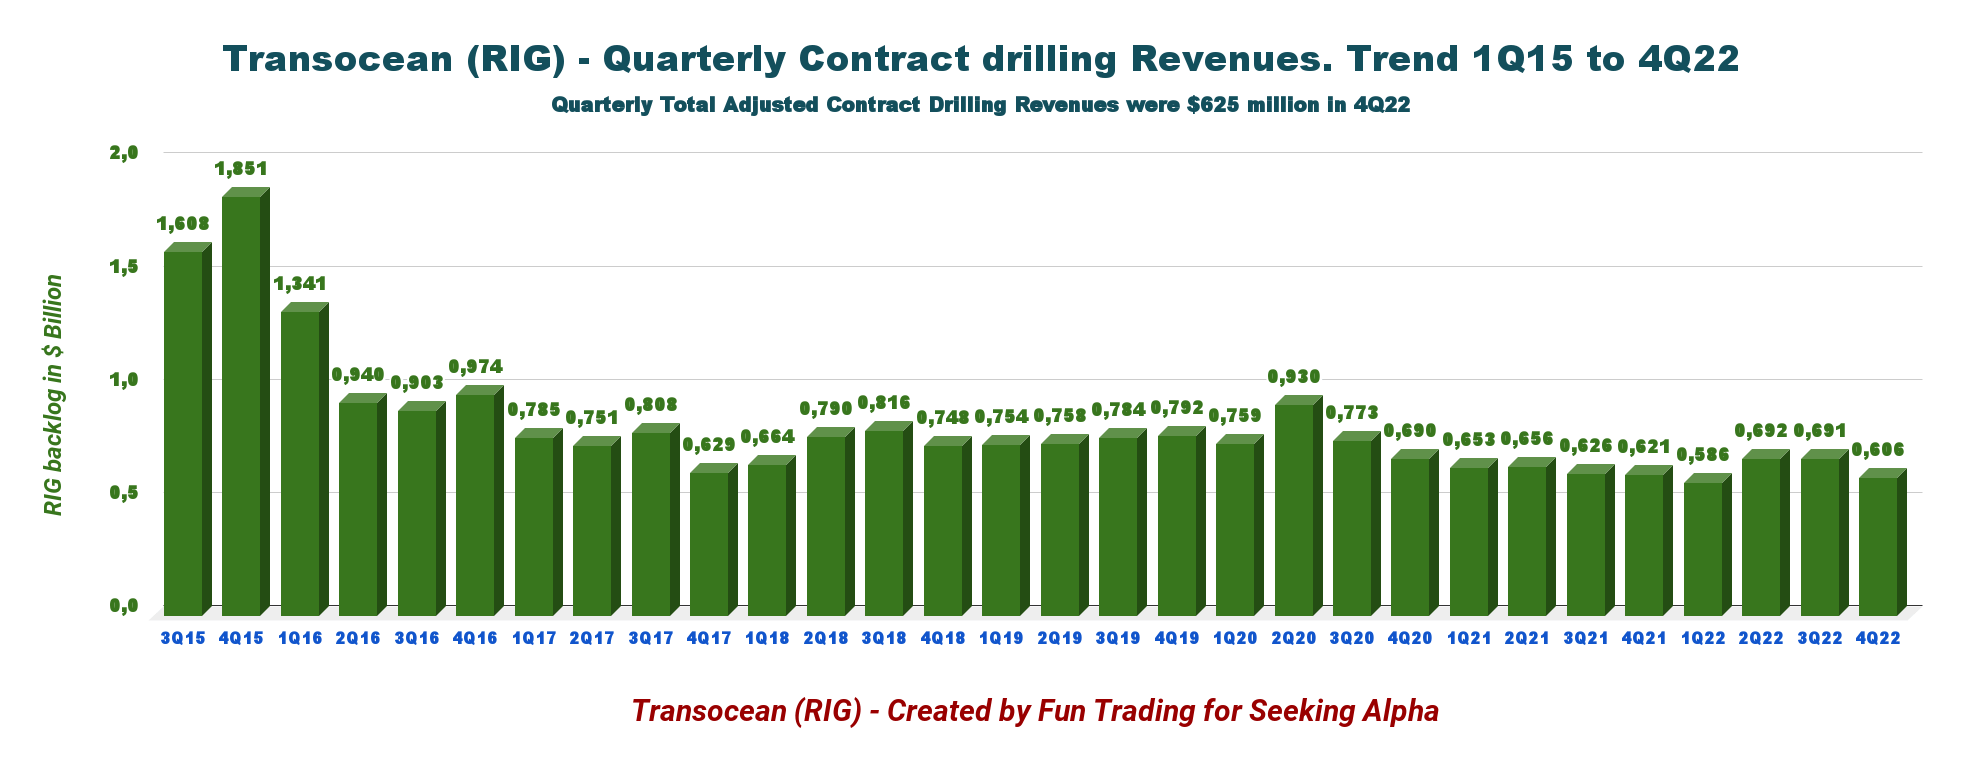
Note: The total adjusted contract drilling revenues were $625 million, from $730 million in 3Q22.
RIG Quarterly Revenues history (Fun Trading)
Transocean's revenues in 4Q22 dropped to $606 million from $621 million in 4Q21, a decrease of 2.4%. Total adjusted contract drilling revenues were $730 million in 3Q22. Revenue efficiency was high this quarter at 98%, compared to 95% in the prior quarter.
The net loss in the fourth quarter of 2022 was $350 million or $0.50 per diluted share.
The adjusted EBITDA was $140 million, compared to $268 million in the prior quarter.
Contract drilling revenues for the three months ended December 31, 2022, decreased sequentially by $85 million to $606 million, primarily due to reduced activity for five rigs that were idle in the fourth quarter, partially offset by higher revenue efficiency and revenues earned by the newbuild ultra-deepwater floater Deepwater Atlas , which commenced operations in October 2022.
CFO Mark Mey said in the conference call:
Indeed, we think that 2022 will be remembered as a pivotal year in the offshore drilling industry, particularly for Transocean. Offshore contracting activity increased significantly, driving utilization rates and day rates materially higher throughout the year. And as evidenced by our December and January contract announcements, Transocean continues to be a primary beneficiary of this heightened demand.
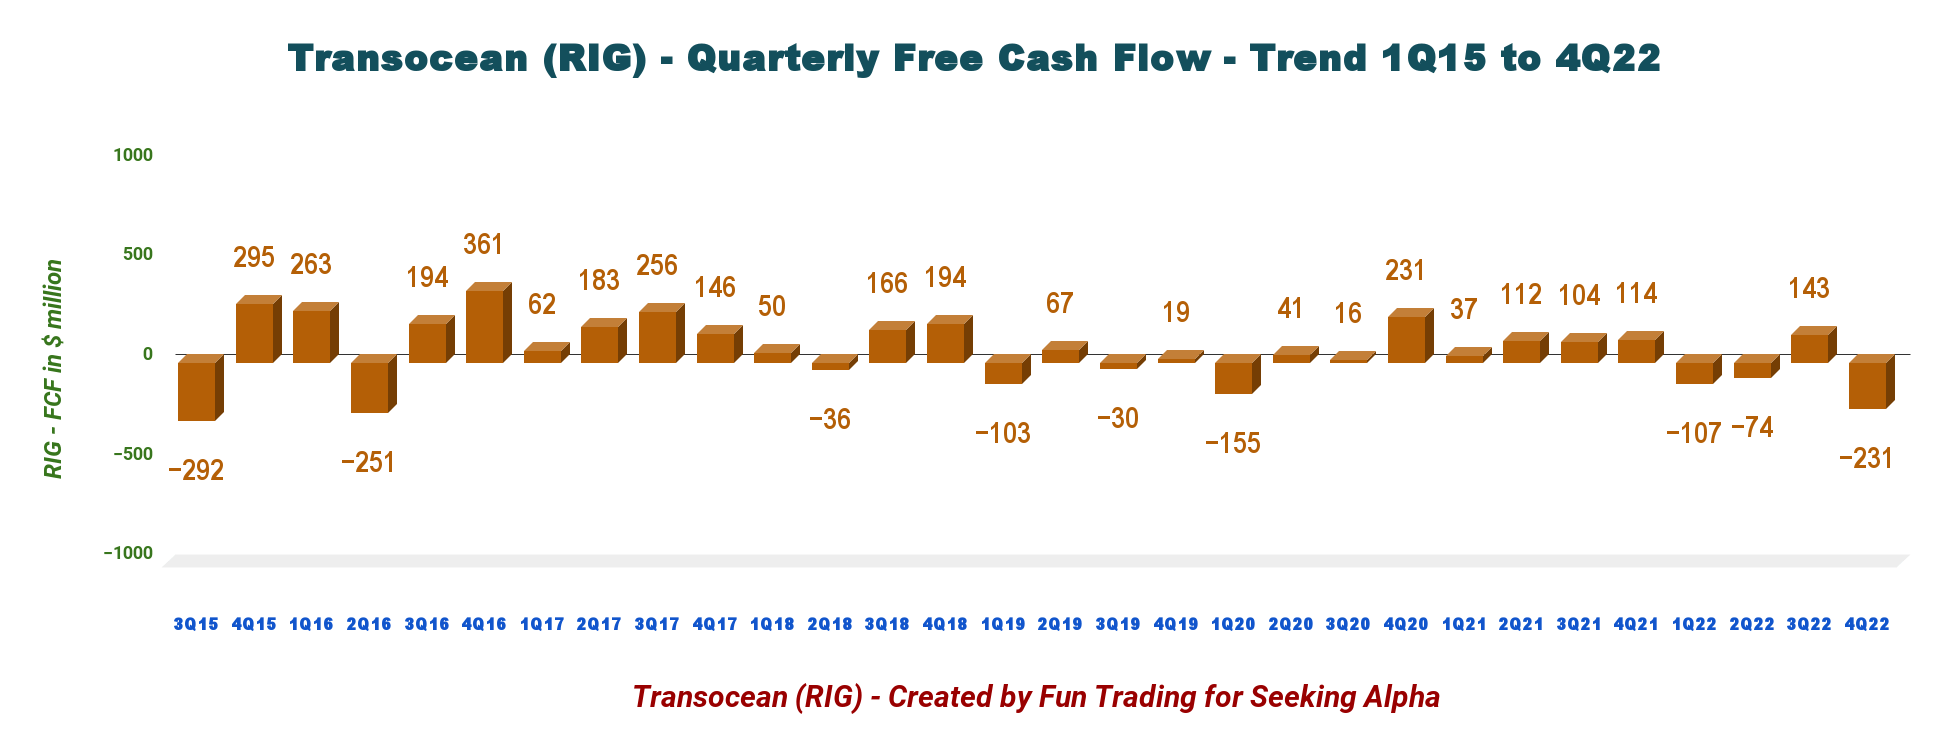
2 - Free cash flow was a loss of $231 million in 4Q22
RIG Quarterly Free cash flow history (Fun Trading)
Important Note: The generic free cash flow is the cash from operating activities minus CapEx.
The cash from operations was $178 million in 4Q22, while CapEx jumped to $409 million from $87 million the preceding quarter. RIG had a free cash flow loss of $231 million in 4Q22. Trailing 12-month free cash flow loss was $269 million.
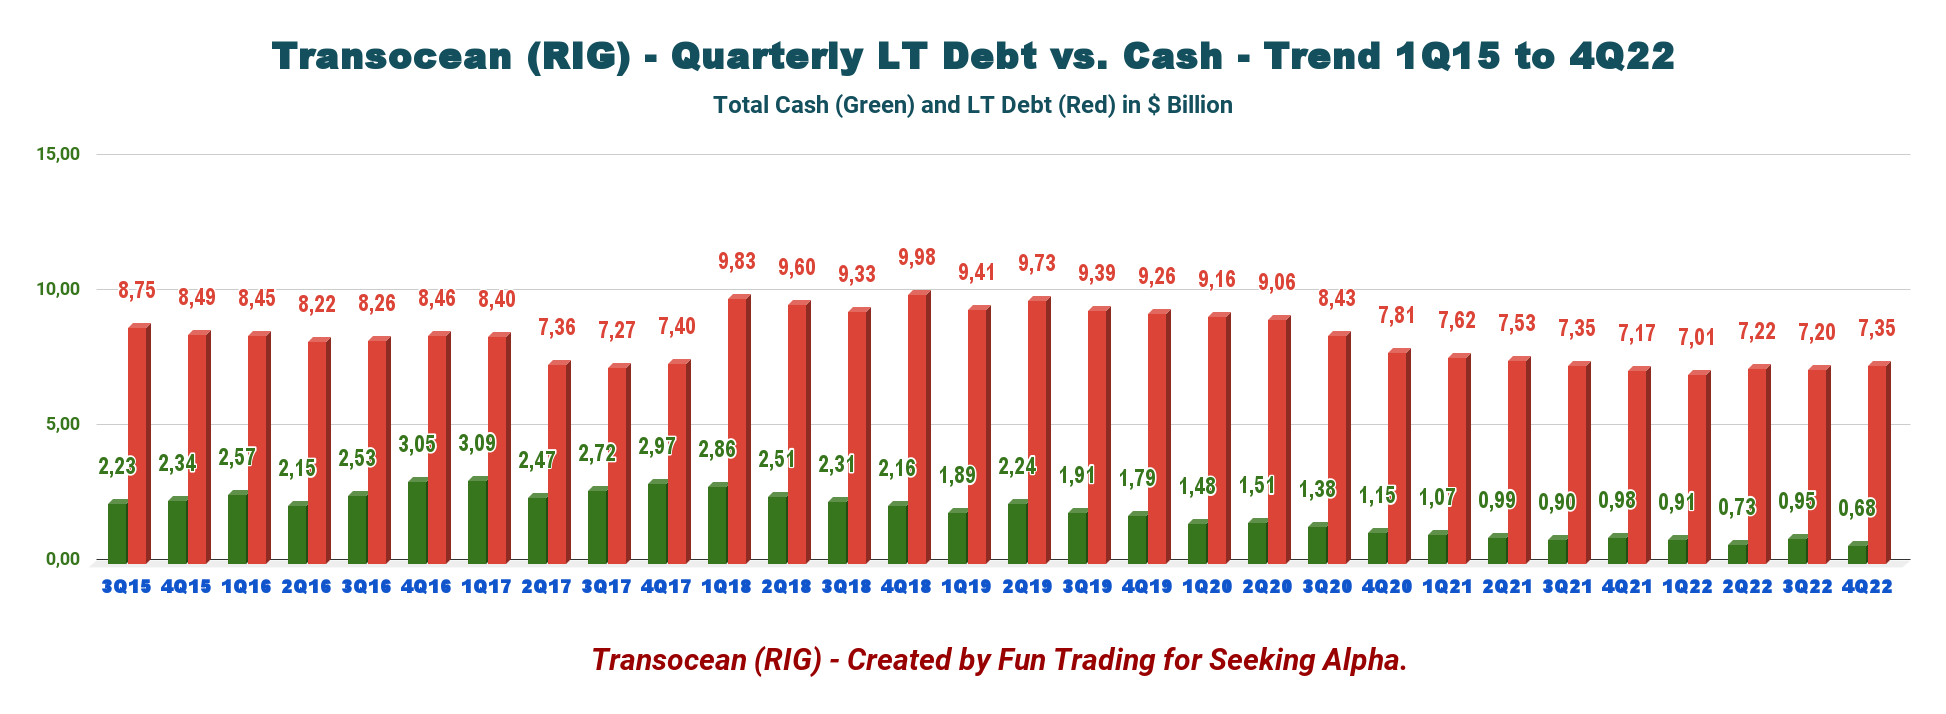
3 - Net debt (gross debt minus total cash) increased sequentially to $6.66 billion in 4Q22
RIG Quarterly Cash versus Debt History (Fun Trading)
Net debt is about $6.66 billion as of December 31, 2022, compared to $6.20 billion in the same quarter a year ago. Total liabilities, including current, increased to $11.15 Billion in December 2022.
However, the total cash was $683 million, down significantly sequentially (please see the chart above).
The shares outstanding diluted for 4Q21 jumped to 726 million shares, up 10.3% on a one-year basis.
Also, the company indicated that it received proceeds for the issuance of shares of $263 million and proceeds for the issuance of debt of $175 million during the fourth quarter of 2023. This raises some serious red flags (dilution, etc.).
Technical Analysis and Commentary
RIG TA Chart short-term (Fun Trading StockCharts)
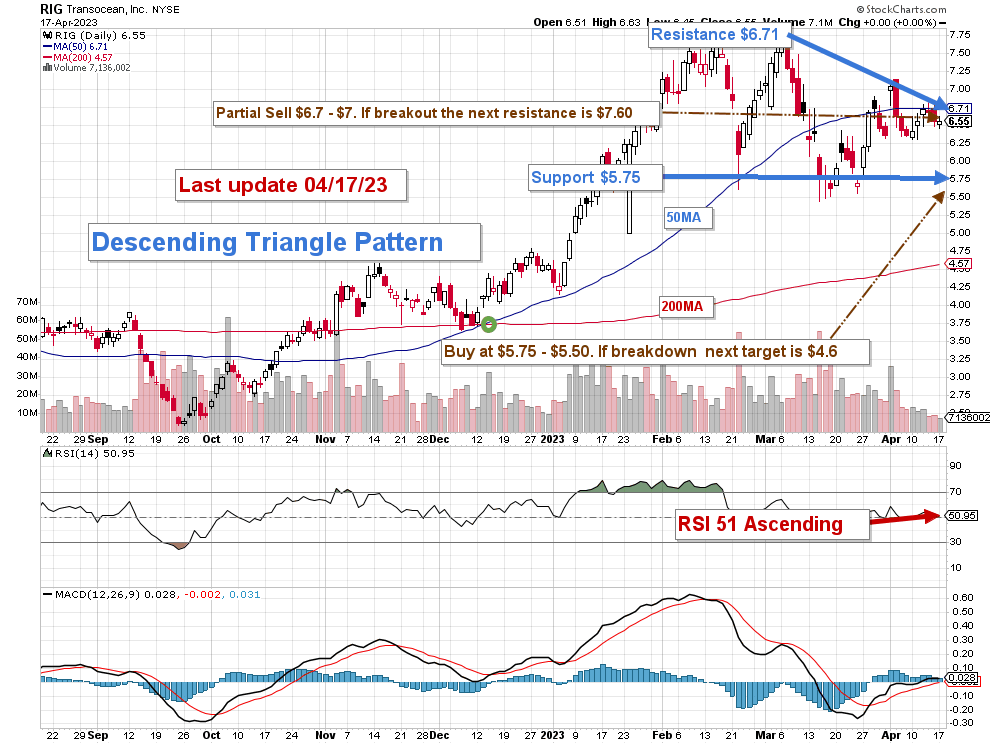
RIG forms a descending triangle pattern, with resistance at $6.71 and support at $5.75.
The descending triangle is a bearish formation that usually forms during a downtrend as a continuation pattern. There are instances when descending triangles form as reversal patterns at the end of an uptrend, but they are typically continuation patterns.
The trading strategy that I recommend is to keep a tiny long-term Transocean Ltd. position and use about 80% to trade LIFO while waiting for a higher final price target for your core position between $7 and $8. I sold my long-term position at $7.10 many weeks ago and have traded RIG short-term since then.
I suggest selling ~40% between $6.70 and $7 and another 40% above $7.60. I recommend waiting for a retracement between $5.75 and $5.50 to accumulate again, with possible lower support at $4.60 if support cannot hold.
Warning: The TA chart must be updated frequently to be relevant. It is what I am doing in my stock tracker. The chart above has a possible validity of about a week. Remember, the TA chart is a tool only to help you adopt the right strategy. It is not a way to foresee the future. No one and nothing can.
For further details see:
Transocean Ltd.: Not Much Left To Expand